INTEGRAL observations of the PSR B1259-63 / SS2883 system after the 2004 periastron passage
The millisecond pulsar PSR B1259-63 and the Be star SS2883 are situated in a highly eccentric binary system, with orbital period 3.4 years. We report on hard X-ray observations obtained with the INTEGRAL satellite close to the 2004 periastron passage. These are the first imaging observations of this system in the hard X-ray range (20 keV) and allow the emission of PSR B1259-63 to be separated from that of a nearby unidentified variable source which may have contaminated previous hard X-ray observations of this system. Using the IBIS/ISGRI instrument we measured a flux of 2–6 mCrab in the 20–200 keV range, with a power law spectrum of photon index .
Key Words.:
gamma-rays: observations – pulsars:individual PSR B1259-631 Introduction
PSR B1259-63 is a 47.6 ms radio pulsar in a highly eccentric () orbit, with a period of 1236.7 days, around the massive Be star SS2883 (Johnston et al. 1992). Be stars are well known to be the source of strong, anisotropic matter outflows via a diluted polar wind and a denser equatorial disk (Waters et al. 1988). Timing analysis of the system indicates that the disk surrounding the Be star SS2883 is highly tilted and that the line of intersection of the disk and orbital planes is almost perpendicular to the orbital major axis (Wex et al. 1998). Hence, the pulsar crosses the disk twice, at approximately days, where denotes the date of periastron, which is Modified Julian Date (MJD) 53071.4307 in this epoch.
Since its discovery, this source has been intensively studied in the radio domain and, to a lesser extent, at X-ray and gamma-ray energies. Monitoring of the source shows that unpulsed radio emission appears after the first disk passage, at about days, and persists until days, with no significant pulsed radio emission being observed around the periastron (see Connors et al. 2002, and references therein).
The first X-ray detections of PSR B1259-63 were made, near apastron of the system, by the ROSAT telescope in February 1992 – February 1993 after earlier observations with Ginga produced only upper limits (Cominsky et al. 1994; Greiner et al. 1995). Observations near the 1994 January 9 periastron, with the ASCA satellite, showed that the 1–10 keV luminosity varied from erg s-1 at periastron to erg s-1 at apastron (Kaspi et al. 1995). At periods close to the disk crossings (, days) the 1–10 keV luminosity was approximately twice higher than at the periastron. A reanalysis of the ASCA data found that the spectrum of the source was consistent with a moderately absorbed power law ( cm-2) with photon index varying from 1.96 at periastron, to 1.7 during the time of the disk crossing, and to 1.6 at apastron (Hirayama et al. 1999). No pulsed X-ray emission has been detected from the system.
Before the observations reported here, the only hard X-ray measurement (40–300 keV) from PSR B1259-63 was obtained by the OSSE instrument during monitoring of the 1994 periastron passage (Grove et al. 1995). Since OSSE was a non-imaging detector, it cannot be excluded that other sources in this region contributed to the measured flux. In fact, a variable source with a hard X-ray spectrum is present at only 10′ from PSR B1259-63 (see Sect. 2.1). Furthermore, the OSSE sensitivity was such that a significant detection could only be obtained by summing all the data taken during a 20 day long observation starting at days.
Recently, the first detection of photons at very high energies ( 200 GeV) from this system has been obtained using the HESS Cherenkov telescope. Beilicke et al. (2004) report a flux corresponding to 10% of the Crab Nebula from observations taken in the period between and days.
2 Data analysis and results
2.1 INTEGRAL
Prompted by the HESS high-energy detection, a Target of Opportunity (ToO) observation was requested with the INTEGRAL satellite, which includes several imaging instruments covering the 3 keV to 10 MeV band (Winkler et al. 2003). The INTEGRAL ToO observation of PSR B1259-63 was conducted between 2004 March 21 12:34 – March 24 12:13 UTC (from days to days). This time interval was chosen based on the expected period for the second disk crossing (20-25 March).
We concentrate here mainly on data obtained with the IBIS coded mask telescope (Ubertini et al. 2003) and in particular with its lower energy detector ISGRI (Lebrun et al. 2003). ISGRI operates in the 15 keV – 1 MeV energy range, providing images with an angular resolution of 12′ over a large field of view of 29. Note that the source location accuracy of coded mask imaging instruments is much better than the nominal angular resolution. For example, sources detected with a significance of 10 can be located by ISGRI with an accuracy of 1′ (Lebrun et al. 2003).
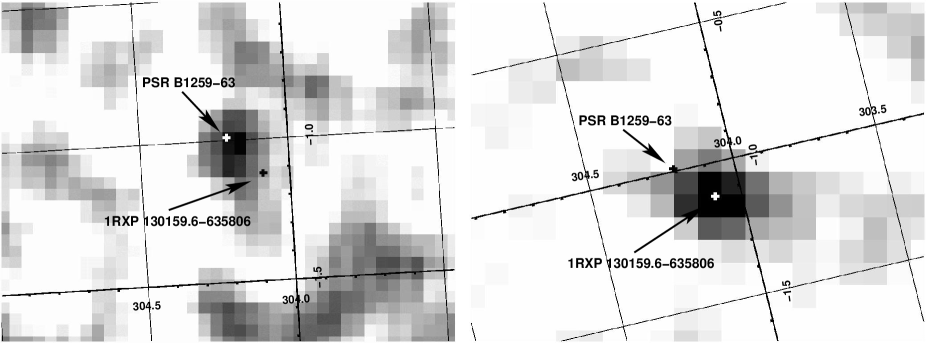
The ISGRI data consist of 120 exposures, each lasting 1800 s and pointed according to a hexagonal dithering pattern chosen to optimize the INTEGRAL imaging performance. Data were analysed using a pre-release version of the ISDC OSA 4 software package, with images from individual pointings being combined with the mosaic software described in Bird et al. (2004). The target was not detected in any individual exposure. In Fig. 1 (left panel) we show a section of the mosaic image obtained by summing the data in the 30-50 keV energy range for the whole observation, which amounts to a total of 190 ksecs of effective exposure time. A source with a statistical significance of is detected at the position of PSR B1259-63.
This region of the sky was also briefly observed by INTEGRAL, during the Core Program monitoring of the Galactic plane, on 2004 February 7 and 19. The ISGRI image obtained on February 7, corresponding to an integration time of only 8800 s, is shown in the right panel of Fig. 1. The source detected on February 7 coincides with the X-ray source 1RXP J130159.6-635806. This source, located approximately 10′ from PSR B1259-63, was seen with a flux of 1 mCrab in 1994 with ASCA (Kaspi et al. 1995), while it was about a factor ten brighter during recent XMM-Newton observations carried out in January 2004. The ISGRI data show that 1RXP J130159.6-635806 had an 18-60 keV flux of 13 mCrab on February 7 and it faded below the sensitivity threshold by February 19 (Chernyakova et al. 2004).
The comparison of the two panels of Fig. 1 clearly indicates the importance of imaging observations to properly identify the origin of the hard X-ray flux measured from this region. Other sources were detected in the large field of view of ISGRI during these observations (e.g. Cen X-3, GX 301–2, 1E 1145.1–6461, the results on which will be reported elsewhere) and were found at their known coordinates. Hence we can be confident that the effect seen in Fig. 1 is due to the variability of the two sources and not to some problem in the attitude reconstruction.
To study the spectrum of PSR B1259-63 we extracted fluxes in different energy ranges from the mosaic images and used the December 2003 version of the instrumental response matrix. The resulting spectrum is shown in Fig. 3 and appears consistent with those measured by other experiments. Because of the small number of points and large errors, it his hard to constrain a power law photon index, , with this data and a fit with XSPEC in the 20–200 keV range gives (90% confidence levels). Although seemingly harder, this is within the errors of the OSSE spectrum, measured in the 20–300 keV range by Grove et al. (1995), of .
Timing analysis of ISGRI data, using the event list method (Ebisawa et al. 2004), did not reveal any pulsations in the 20–60 keV energy band above the 3 level (but note that the high background level at these energies implies that the limits on the pulsed fraction from such a search are not very constraining).
We also analyzed data from the INTEGRAL spectrometer SPI (Vedrenne et al. 2003), obtaining only a marginally significant detection () in the 20–40 and 40–100 keV bands. The SPI points, plotted as upper limits in Fig. 3, are consistent with the ISGRI detection of PSR B1259-63.
Finally, PSR B1259-63 appears to be too faint to be significantly detected in the 3–20 keV range with the JEM-X X-ray monitor aboard INTEGRAL (Lund et al. 2003).
2.2 RXTE
PSR B1259-63 was monitored with RXTE during a public ToO programme (n.P90405). The data from the Proportional Counter Array (PCA) instrument were reduced and analysed, using the LHEASOFT V5.3 software package, as described in Rodriguez et al. (2003). In addition, time intervals contaminated by high fluxes of energetic electrons were removed.
The 2–20 keV PCA light curve is shown in the top panel of Fig. 2. Due to the source faintness, some contamination by the Galactic Ridge X-ray emission in the field of view of the PCA collimator is likely. To estimate it we assume that the Galactic Ridge contribution at the position of PSR B1259-63 is the same as that of region R1 of Valinia & Marshall (1998), corresponding to erg cm-2 s-1.
The lower panel of Fig. 2 shows the photon index obtained by fitting the PCA data with an absorbed power law, with frozen to cm-2, plus an iron line at 6.5 keV (Hirayama et al. 1999). The power law photon index was found to be 1.6–1.8 in all the observations, which is consistent with earlier measurements.
Four points in the light curve were simultaneous with the INTEGRAL ToO observation and, since their fluxes and fitted spectral indices are consistent with a constant value, it was possible to make an average RXTE spectrum. The Galactic background was subtracted before the spectrum was fitted in XSPEC (v11.3). With frozen to 0.6 cm-2 (Hirayama et al. 1999), we obtain a harder photon index of 1.5, while a flattening is obvious at low energies (see Fig. 3). Allowing to vary, leads to a photon index consistent with that of the individual spectra, and previous findings although tends to much higher values. This is interpreted as evidence of a slight overestimate of the background, especially at low energies. Restraining the fit to the 5-30 keV energy range, with frozen to its normal value, leads to (90%) and (48 dof).

The non detection of 1RXP J130159.6-635806 in the ISGRI images of March, the relative steadiness of the RXTE flux, and the relatively high absolute value of the power law photon index suggest that the RXTE flux is dominated by emission from PSR B1259-63. However, due to the lack of imaging of the PCA instrument, we cannot exclude contribution from 1RXP J130159.6-635806 at other times (e.g. the flux increase seen at MJD 53089).
3 Discussion
The spectral energy distribution for PSR B1259-63, combining these and previous soft gamma / hard X-ray measurements, is shown in Fig. 3. The flux measured with ISGRI corresponds to 2 mCrab at 30 keV, and rises to 3 mCrab and 6 mCrab at 60 and 190 keV respectively. The average luminosity, given that the system is 1.5 kpc from Earth (Johnston et al. 1996), is estimated as erg s-1 in the 20–80 keV band. The ISGRI spectrum is in good agreement with the extrapolation of the simultaneous RXTE/PCA spectrum and is consistent with that measured above 30 keV with OSSE during the 1994 periastron passage. However, contrary to the OSSE data, the ISGRI observation has the great advantage of clearly identifying the PSR B1259-63 / SS2883 system as the source responsible for the observed hard X-ray emission.
Also shown in Fig. 3 is a spectrum taken during the 1994 post-periastron disk passage ( days) with the ASCA X-ray telescope, which can be compared with the INTEGRAL observations ( to days). Hirayama et al. (1999) suggested a potential hardening of the ASCA spectrum, from a photon index of 1.96 at periastron to 1.69 at days. The RXTE data, shown in Fig. 2, also indicate a hardening of the spectrum, which seems to be accompanied by a slight increase in flux, at days. Unfortunately, this occurs just after the INTEGRAL observation and contamination by 1RXP J130159.6-635806 can not be ruled out without the high resolution ISGRI images.

Several models have been put forward to explain the high energy emission from PSR B1259-63. Although all involve the interaction between the two stars they differ in the invoked mechanisms for the emitted radiation, as the properties of pulsar relativistic winds are a matter of debate.
Tavani & Arons (1997) suggest a high Lorentz factor of the pulsar wind, , with X-rays from synchrotron emission of relativistic particles in the pulsar wind. In this case the non-pulsed radio emission is explained by synchrotron emission from the electrons of the disk of the Be star, accelerated at a shock wave which appears during the passage of the neutron star through the disk (Ball et al. 1999). Chernyakova & Illarionov (1999, 2000) suggest a more moderate of 10-100 with the relativistic particles of the pulsar wind being responisble for both the X-ray (inverse Compton scattering of the pulsar wind on Be star soft photons) and non-pulsed radio emission (synchrotron radiation).
For the source of the TeV emission, Kirk et al. (1999) propose relativistic electrons from the pulsar wind, while Kawachi et al. (2004) favour interactions of protons accelerated in a shock wave during the passage of the neutron star through the Be-star disk. As the hard X-ray and TeV emission may originate from different populations of particles, TeV observations alone may be unable to constrain and the post-periastron data reported here also leaves this question open. A report on the full HESS observation of PSR B1259-63 around periastron is being produced (Aharonian, et. al., in prep.).
Our observations underline the need for broad band simultaneous coverage, with instruments able to resolve source confusion problems, to investigate the high energy emission of this source in detail. The combination of the post-periastron observations reported here, with pre-periastron XMM-Newton data, which show a sudden increase of the X-ray intensity during the first disk crossing, may be enough to rule out some models (Chernyakova, et. al., in prep.).
Finally we note that the data reported here show that INTEGRAL has the capability of detecting PSR B1259-63 with observing times about a factor 10 shorter than OSSE. More intensive and coordinated hard X-ray observations of the future periastron passages will certainly provide useful constraints and lead to the possible detection of flux and spectral variability on time scales of days, which might help to discriminate among the different models.
Acknowledgements.
This paper is based on observations made with the ESA INTEGRAL project and also uses data obtained from the HEASARC Online Service, provided by the NASA Goddard Space Flight Center. Individual authors thank the following bodies for financial support: JR, the French Space Agency (CNES); SES, UK PPARC.References
- Ball et al. (1999) Ball, L., Melatos, A., Johnston, S., & Skjæraasen, O. 1999, ApJ, 514, L39
- Beilicke et al. (2004) Beilicke, M., Ouchrif, M., Rowell, G., & Schlenker, S. 2004, IAUC, 8300, 2
- Bird et al. (2004) Bird, A. J., Barlow, E. J., Bassani, L., et al. 2004, ApJ, 607, L33
- Chernyakova & Illarionov (2000) Chernyakova, M. & Illarionov, A. 2000, Ap&SS, 274, 177
- Chernyakova et al. (2004) Chernyakova, M., Shtykovsky, P., Lutovinov, A., et al. 2004, The Astronomer’s Telegram, 251, 1
- Chernyakova & Illarionov (1999) Chernyakova, M. A. & Illarionov, A. F. 1999, MNRAS, 304, 359
- Cominsky et al. (1994) Cominsky, L., Roberts, M., & Johnston, S. 1994, ApJ, 427, 978
- Connors et al. (2002) Connors, T. W., Johnston, S., Manchester, R. N., & McConnell, D. 2002, MNRAS, 336, 1201
- Ebisawa et al. (2004) Ebisawa, K., Shaw, S. E., & et al. 2004, in 5th INTEGRAL Workshop - The INTEGRAL Universe: ESA SP-552, in press
- Greiner et al. (1995) Greiner, J., Tavani, M., & Belloni, T. 1995, ApJ, 441, L43
- Grove et al. (1995) Grove, J. E., Tavani, M., Purcell, W. R., et al. 1995, ApJ, 447, L113
- Hirayama et al. (1999) Hirayama, M., Cominsky, L. R., Kaspi, V. M., et al. 1999, ApJ, 521, 718
- Johnston et al. (1992) Johnston, S., Lyne, A. G., Manchester, R. N., et al. 1992, MNRAS, 255, 401
- Johnston et al. (1996) Johnston, S., Manchester, R. N., Lyne, A. G., et al. 1996, MNRAS, 279, 1026
- Kaspi et al. (1995) Kaspi, V. M., Tavani, M., Nagase, F., et al. 1995, ApJ, 453, 424
- Kawachi et al. (2004) Kawachi, A., Naito, T., Patterson, J. R., et al. 2004, ApJ, 607, 949
- Kirk et al. (1999) Kirk, J. G., Ball, L., & Skjaeraasen, O. 1999, Astroparticle Physics, 10, 31
- Lebrun et al. (2003) Lebrun, F., Leray, J. P., Lavocat, P., et al. 2003, A&A, 411, L141
- Lund et al. (2003) Lund, N., Budtz-Jørgensen, C., Westergaard, N. J., et al. 2003, A&A, 411, L231
- Rodriguez et al. (2003) Rodriguez, J., Corbel, S., & Tomsick, J. A. 2003, ApJ, 595, 1032
- Tavani & Arons (1997) Tavani, M. & Arons, J. 1997, ApJ, 477, 439
- Ubertini et al. (2003) Ubertini, P., Lebrun, F., Di Cocco, G., et al. 2003, A&A, 411, L131
- Valinia & Marshall (1998) Valinia, A. & Marshall, F. E. 1998, ApJ, 505, 134
- Vedrenne et al. (2003) Vedrenne, G., Roques, J.-P., Schönfelder, V., et al. 2003, A&A, 411, L63
- Waters et al. (1988) Waters, L. B. F. M., van den Heuvel, E. P. J., Taylor, A. R., Habets, G. M. H. J., & Persi, P. 1988, A&A, 198, 200
- Wex et al. (1998) Wex, N., Johnston, S., Manchester, R. N., et al. 1998, MNRAS, 298, 997
- Winkler et al. (2003) Winkler, C., Courvoisier, T. J.-L., Di Cocco, G., et al. 2003, A&A, 411, L1