H i Observations of an Ultra-Compact High-Velocity Cloud
We present H i observations of the compact high-velocity cloud HVC289+33+251 that was discovered by Putman et al. (putman (2002)). Observations with the 100-m Effelsberg telescope demonstrate that this cloud is still unresolved by the 9′ beam of the Effelsberg telescope. The cloud shows a small line width of km s-1 providing an upper limit to the kinetic temperature of the H i gas of K. The total observed flux indicates an H i mass of (H i) = 5.66 M⊙ . Follow-up H i observations using the Australia Telescope Compact Array (ATCA) resolve HVC289+33+251 into 5 condensations that are embedded in a common H i envelope. The HVC shows a faint tail, indicating an ongoing ram-pressure interaction with an ambient low-density medium. A FWHM diameter of = 44 makes this HVC the by far most compact HVC known till now. The observed parameters suggest that pressure stabilization by an ambient medium is rather unlikely. At a distance of 150 kpc, the virial mass is by a factor of 5.6 higher than the observed gas mass – consistent with HVC289+33+251 being one of the “missing” dark matter mini halos that were predicted by cosmological CDM simulations (e.g. Klypin et al. klypin (1999); Moore et al. moore (1999)). Comparable clouds in other groups of galaxies or even around the Milky Way are not detectable with the resolution and sensitivity of present surveys.
Key Words.:
Galaxy: halo – ISM: clouds – ISM: individual objects: high-velocity clouds – dark matter1 Introduction
High-velocity clouds (HVCs) were first discovered by Muller et al. (muller (1963)). They are defined as neutral atomic hydrogen clouds with radial velocities (relative to the local-standard-of-rest frame, LSR) that cannot be explained by simple Galactic rotation models (Wakker wakkerdev (1991)).
Oort (oort (1966)) proposed an extragalactic origin for HVCs. He argued, that the formation of galaxies is still an ongoing process and HVCs represent primordial clouds that are currently accreted by the Milky Way. Blitz et al. (blitz (1999)) revived the hypothesis that some HVCs are primordial gas left over from the formation of the Local Group galaxies. Braun & Burton (bb99 (1999)) used the Leiden/Dwingeloo Survey (LDS) of neutral hydrogen (Hartmann & Burton hartmann (1997)) to compile a catalog of 66 clouds with an angular diameter below 2° that are isolated from neighboring emission. They argued that this ensemble of compact HVCs (CHVCs) represents a homogeneous subsample of HVCs at Mpc distances. An HVC catalog of the southern sky with 1997 high-velocity objects and 179 CHVCs was compiled by Putman et al. (putman (2002)) using the H i Parkes All-Sky Survey (HIPASS, Barnes et al. barnes (2001)).
Recent surveys (e.g. Zwaan zwaan (2001), de Blok et al. deblok (2002), Minchin et al. minchin (2003), Pisano et al. pisano (2004)) failed to detect a similar population in other groups of galaxies. They concluded that CHVCs represent rather a circum-galactic population at typical distances below 150 kpc than an intergalactic population at 1 Mpc.
The CHVCs might represent the missing satellites expected from cosmological CDM simulations (e.g. Klypin et al. klypin (1999); Moore et al. moore (1999)). Recent models conclude that the majority of the dark matter mini halos is most likely located close to the Milky Way with a median distance of about 120 kpc (e.g. Kravtsov et al. kravtsov (2004)). Sternberg et al. (sternberg (2002)) modeled the physical state of the H i gas in dark matter mini halos and concluded that the observed CHVC parameters are consistent with a circum-galactic population at typical distances of 150 kpc.
Several CHVCs have been studied in great detail (Braun & Burton bb2000 (2000), Brüns et al. bruens2 (2001), Burton et al. burton (2001), de Heij et al. 2002a ). These clouds have angular diameters larger than 30′ and they show a complex morphology that could be explained by ram-pressure interaction with an ambient medium or tidal interaction with the Milky Way. A CHVC that is undisturbed and spherically symmetric has not yet been found.
The compact cloud HVC289+33+251 was discovered by Putman et al. (putman (2002), catalog number 1345). HVC289+33+251 is a CHVC that is unresolved by the effective Parkes beam of 155. This CHVC is located 5° north of the Leading Arm of the Magellanic Clouds (Putman et al. putman98 (1998)) and shows a 50 km s-1 higher radial velocity than the gas at the northern end of the Leading Arm. No high-velocity H i emission has been detected within a radius of 5° around HVC289+33+251, making it sufficiently isolated to be treated as a CHVC.
In this paper, we present high-resolution H i observations of HVC289+33+251 using the 100-m Effelsberg telescope and the Australia Telescope Compact Array (ATCA). In Sect. 2, we summarize these H i observations and outline the data reduction. In Sect. 3, we present the results of the single dish Effelsberg data and in Sect. 4 those of the interferometric ATCA data. HVC289+33+251 is considerably smaller than all other CHVCs that have been studied so far. The extreme compactness compared to compact HVCs justifies the designation as an ultra-compact HVC. The physical parameters of this potential dark matter mini halo are discussed in Sect. 5.
2 Observations and Data Reduction
2.1 Effelsberg Data
The observations were carried out in October 2002 with the 100-m Effelsberg telescope using the 21-cm receiver. The HPBW at 21-cm wavelength is 9′. The standard calibration source S7 was used for the flux calibration. The 1024 channel autocorrelator was split into two banks of 512 channels for the two orthogonal circular polarizations. The bandwidth of 1.5 MHz offers a velocity resolution of = 0.65 . The HVC was mapped on a regular grid of 5 by 5 positions in equatorial coordinates with grid spacings of 45 and an integration time of 10 minutes for the central position and 3 minutes for the outer positions. This results in an rms-noise of = 0.1 K and = 0.17 K, respectively, after averaging the two polarizations. We subtracted a third order polynomial for the baseline correction.
2.2 ATCA Data
The high resolution H i data were observed in February 2003 using the 750D configuration of the ATCA interferometer. The five antennae provide baselines between 30 m and 720 m. The correlator configuration FULL_4_1024-128 offers 1024 channels over a 4 MHz bandwidth for both orthogonal polarizations. The velocity resolution is = 0.825 . We used the source B1934-638 as primary calibrator and B1127-145 as secondary calibrator for the bandpass, gain and phase calibration. The CHVC was observed for 12 hours to allow for a good -coverage. The secondary calibrator was observed once per hour for 5 minutes. The relatively northerly position of the source, combined with shadowing effects at low elevations produced an elliptical synthesized beam of HPBW 1124359 with a position angle of 25.
The data were reduced using the MIRIAD package (Sault et al. sault (1995)). We have chosen robust weighting with a robustness parameter of 0.5 to optimize resolution and sensitivity. The deconvolution was performed using the maximum entropy method. The final data-cube has an rms-noise of = 7 mJy/beam. We converted the observed fluxes, , to brightness temperature, , using
| (1) |
where and are measured in K and Jy beam-1, respectively. is the wavelength measured in cm, and and are the sizes of the major and the minor beam in arc minutes. Using = 21 cm and the beam size stated above yields a conversion factor of 148.9 K(Jy beam-1)-1. The rms noise of the data-cube corresponds therefore to 1 K using the brightness temperature scale.
3 Results from the Effelsberg Telescope
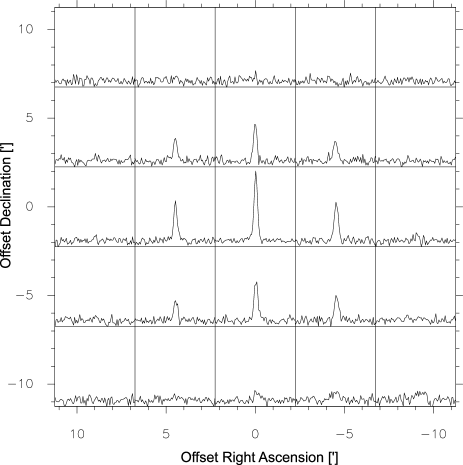
Figure 1 shows the 5 by 5 spectra map observed with the Effelsberg telescope. The 45 grid corresponds to HPBW/2 of the Effelsberg telescope. The map demonstrates that HVC289+33+251 is smaller than the beam size of 9′. There is, however, some faint emission detected in the south-west between offsets –9′ 0′ at = –9′. This emission has a column density of (H i) = (81)1018 cm-2 and a FWHM line width of = (132) km s-1. It indicates a faint H i tail associated with HVC289+33+251 (see Sect. 5).
The central H i spectrum has a peak intensity of = (3.20.1) K, a line width of = (4.90.1) km s-1 and a column density of (H i) = (2.870.06)1019 cm-2. For comparison, Putman et al. (putman (2002)) gave a peak intensity of = 0.22 K for HVC289+33+251. The considerable difference between = 3.2 K and = 0.22 K is a result of the larger effective beam size of 155 and the velocity resolution of the HIPASS data of 26.4 km s-1 which is too coarse for a line width of 5 km s-1.
The total H i mass of HVC289+33+251 is related to the total H i flux observed with the 100-m Effelsberg telescope:
| (2) |
where is the distance to the source and the integrated flux given in units of Jy km s-1. The estimated mass depends on the unknown distance to the cloud. Using the observed total flux of = (10.680.21) Jy km s-1 yields an H i mass of (H i) = (5.660.11) M⊙ . The error reflects solely the observational uncertainty of the total flux.
4 Results from the ATCA
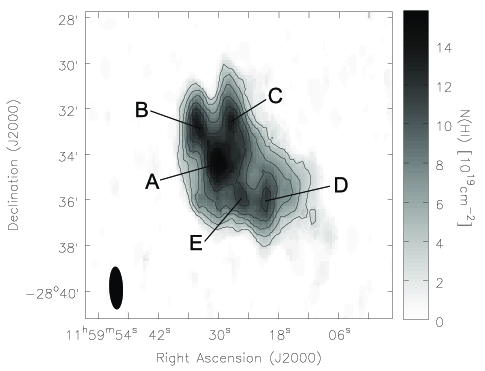
Figure 2 shows a column density map of the ATCA H i data. The angular extent of the cloud is apparently smaller than the Effelsberg beam of HPBW = 9′. The angular resolution of the ATCA data of HPBW = 1124359 is sufficiently high to resolve HVC289+33+251. The angular diameter can be estimated by fitting a two-dimensional Gaussian to the column density distribution. The fit yields a FWHM diameter of = 44. This is considerably smaller than the typical sizes of compact HVCs with 30′. The extreme compactness of HVC289+33+251 compared to typical compact HVCs justifies the designation as an ultra-compact HVC. The linear diameter, , of HVC289+33+251 is = 192 pc , where is the unknown distance to HVC289+33+251.
The peak column density observed with the ATCA is (H i) = 1.91020 cm-2, 6.6 times higher than the column density observed with Effelsberg, clarifying the compactness of the HVC. The total flux observed with the ATCA of = 10.63 Jy km s-1 is in good agreement with the observed single dish flux of = 10.68 Jy km s-1.
The ATCA data resolve HVC289+33+251 into 5 condensations that are embedded in a common envelope (Fig. 2). The coordinates of the five condensations are listed in Table 1. The central condensation (A) is slightly more extended than the angular resolution. The angular diameter can be estimated by fitting a Gaussian to the column density distribution in direction of right ascension, where the ATCA beam is HPBW = 359. The fit yields a diameter of FWHM = 96″ which is consistent with an intrinsic diameter of about = 90″. The other 4 condensations are unresolved by the 1124359 beam, indicating that the intrinsic diameter must be smaller than 50″. All five condensations have H i column densities higher than (H i) 11020 cm-2.
The spectra of the central positions of all five condensations were fit with Gaussians. The fits provide the peak brightness temperature, the peak column density, the mean velocity, and the FWHM line width of the individual spectra. The results are summarized in Table 1. The five condensations have almost the same mean velocity, i.e. there is no velocity gradient observed across the extent of HVC289+33+251.
A mean volume density of each condensation can be estimated assuming spherical symmetry for the condensations: , where is the mean density of a condensation, (H i) is the observed column density, is the angular diameter of the condensation given in radian, and is the distance to the cloud. The five condensations of HVC289+33+251 have mean densities of the order 1 cm-3 .
The fit yields narrow line widths between = 3.8 km s-1 for condensation B and = 6.1 km s-1 for condensation E (see Table 1). The line width provides an upper limit to the kinetic temperature of the gas – the so-called Doppler temperature, , where is measured in K and the observed line width, , is measured in units of km s-1. This upper limit to the temperature is between = 315 K for condensation B and = 811 K for condensation E. Table 1 also lists the values for the other condensations.
The upper limit for the temperature and the mean density can be used to derive an estimate of the pressure in the condensations, using the approximation of an ideal gas, , where is the pressure of a condensation and k is the Boltzmann constant. The estimated pressures are between = 360 K cm-3 for condensation A and = 852 K cm-3 for condensation E. The gaseous condensations are expected to be located in a common gravitational potential filled with gas. This gas is expected to be in approximate pressure equilibrium. The median pressure of the condensations, 450 K cm-3 , provides an estimate of the overall pressure of the gas in HVC289+33+251.
Wolfire et al. (wolfire (1995)) and Sternberg et al. (sternberg (2002)) modeled the physical state of low-metalicity HVCs. They concluded that pressures of the order few100 K cm-3 are necessary to have a stable HVC consisting predominantly of a cold gas phase. Their pressures are consistent with our observationally determined value.
| Region | Telescope | RA | Dec | (H i) | k-1 | ||||||
|---|---|---|---|---|---|---|---|---|---|---|---|
| J2000 | J2000 | K | 1020 cm-2 | km s-1 | km s-1 | K | ″ | cm-3 | K cm-3 | ||
| A | ATCA | 11h59m296 | –28°34′22″ | 18.9 | 1.58 | 250.55 | 4.6 | 461 | 90 | 0.8 | 360 |
| B | ATCA | 11h59m345 | –28°32′46″ | 19.1 | 1.37 | 250.70 | 3.8 | 315 | 50 | 1.2 | 384 |
| C | ATCA | 11h59m278 | –28°32′38″ | 15.6 | 1.33 | 250.03 | 4.7 | 482 | 50 | 1.2 | 574 |
| D | ATCA | 11h59m205 | –28°35′58″ | 15.0 | 1.19 | 251.60 | 4.4 | 422 | 50 | 1.1 | 447 |
| E | ATCA | 11h59m254 | –28°35′50″ | 10.9 | 1.18 | 251.65 | 6.1 | 811 | 50 | 1.1 | 852 |
| all | Effelsberg | 11h59m260 | –28°34′30″ | 3.1 | 0.29 | 250.67 | 4.9 | 532 | 264 | 0.62 | 330 |
5 Discussion
Both data sets from the Effelsberg telescope (Fig. 1) and the ATCA (Fig. 2) indicate that there is a faint tail towards the south-west. A head-tail structure is a sign of ram-pressure interaction with an ambient medium (Brüns et al. bruens1 (2000),bruens2 (2001); Quilis & Moore quilis (2001); Konz et al. konz (2002)). The numerical simulations from Quilis & Moore (quilis (2001)) and Konz et al. (konz (2002)) suggest that the gas in an interacting HVC has its lowest temperatures at the leading edge, slightly higher temperatures in the head, and much higher temperatures in the tail of recently stripped material. Exactly this trend is observed in terms of line widths (or Doppler temperatures): condensation B, that is located on the opposite side of the tail shows the lowest line width, = 3.8 km s-1, the other condensations have line widths of about 4.6 km s-1, while the gas in the tail has a much larger line width of = 13 km s-1 (see Sect. 3). These results indicate that HVC289+33+251 is most likely embedded in a low-density medium, either in the outer Galactic halo or in the intergalactic medium of the Local Group.
A distance of = 150 kpc was assumed in the last two sections to derive the physical parameters: H i mass, size, mean density, and pressure. The total H i mass of HVC289+33+251 is (H i) = 5.66 M. The total gas mass must be higher as ionized hydrogen, helium, or molecular gas are not traced by the 21-cm line of neutral hydrogen: = (H i). The factor is the ratio of the total gas mass and the H i mass. We expect to have 10 percent helium (by number) in this cloud, yielding 1.4 and therefore 7.92 M.
The generalized version of the virial theorem for a homogeneous, spherically symmetric cloud including pressure support from an ambient medium is:
| (3) |
where is the mean-square velocity that is related to the observed line-width by = 3/(8 ln 2). G is the Gravitational constant, is the radius of the cloud given by , where is the angular diameter in radian and is the distance of the cloud. is the external pressure and is the volume of the cloud. Solving for the external pressure and using the overall line width from the Effelsberg data and the FWHM diameter of HVC289+33+251 derived from the ATCA column density map (see Sect. 4) yields
| (4) | |||||
Figure 3 shows the external pressure needed to stabilize HVC289+33+251 as a function of distance to the sun, if its mass is given by its H i mass including helium. For comparison, the dotted line indicates the pressure in the halo of the Milky Way as given by the model of Kalberla (kalberla (2003)). This pressure is significantly lower than the pressure needed for stabilization at all distances. Even an intergalactic medium with a very high pressure of = 200 K cm-3 would not stabilize HVC289+33+251 at distances less than 250 kpc (see Fig. 3).
The gas mass of HVC289+33+251 could be higher, e.g. in form of a massive envelope of warm, ionized hydrogen. HVC289+33+251 shows a faint head-tail structure, indicating an ongoing ram-pressure interaction with an ambient medium. An outer envelope of warm, ionized hydrogen would be much more affected by this interaction. The fact that we see a head-tail structure in the cold gas phase contradicts the existence of a massive envelope, as this envelope would have lost most of its mass before the innermost regions were affected by the ram-pressure.
The assumption of virialization is not necessarily true as indicated by the faint H i tail. A dynamical time-scale can be estimated dividing the linear diameter of HVC289+33+251 by its overall line-width. Using the overall line width from the Effelsberg data and the FWHM diameter derived from the ATCA column density map yields a time-scale of = 38.3 Myr . One orbit around the Milky Way is expected to take a few Gyrs, i.e. the gravitational forces from the Milky Way and ram-pressure forces should be approximately constant over considerably longer time-scales than = 38.3 Myr . This time-scale is therefore sufficiently short to assume that HVC289+33+251 is at least close to equilibrium.
The assumption of virialization with negligible external pressure allows us to estimate the mass needed to stabilize HVC289+33+251 at a given distance. The virial mass for a density distribution is
| (5) |
where is the virial mass in units of solar masses, is the line width in units of km s-1, and is the radius of the cloud in units of pc. Using the same parameters as in Eq. 4 yields a virial mass of
| (6) |
The ratio of the virial mass and the gas mass is
| (7) |
The distance where the gas mass equals the dynamical mass, = 825 kpc, can be used as an upper limit of the distance to HVC289+33+251 (see also Fig. 3). While no dark matter is needed for stabilization at = 825 kpc, about 80 percent of the dynamical mass would be undetected at a distance of = 150 kpc. For comparison, about 95 percent dark matter would be needed for stabilization at a distance of = 50 kpc. These percentages of dark matter are common for various types of galaxies.
Stabilization by dark matter yields a reasonable amount of dark matter, while the stabilization by the pressure of an ambient medium or a massive envelope of ionized hydrogen is very unlikely. The true distance to HVC289+33+251 – the key parameter for the physical state – cannot be derived on the basis of the data presented in this paper. The observed morphology and the estimated physical parameters of the compact cloud HVC289+33+251 are, however, consistent with a low-mass dark matter mini halo in the vicinity of the Milky Way that moves through a low density medium.

The FWHM diameter of only 44 makes this cloud undetectable for low-resolution telescopes like the 25-m Dwingeloo telescope. Its angular resolution of HPBW = 36′ yields a beam filling factor of about 1.5%. The considerable difference between the peak brightness temperatures observed with Effelsberg ( = 3.2 K) and the HIPASS survey using the Parkes telescope ( = 0.22 K) clarifies the importance of high angular and velocity resolution for the detection of clouds like HVC289+33+251. An assumed distance of = 150 kpc corresponds to a linear diameter of 192 pc. A comparable cloud located in a nearby group at 3 Mpc would have an angular diameter of about 13″ – the size of the synthesized beam of the VLA in the C configuration. A signal of that size that appears only in one spectral channel would most likely be regarded as a noise peak.
Recent surveys for compact clouds in galaxy groups, e.g. Zwaan (zwaan (2001)), de Blok et al. (deblok (2002)), Minchin et al. (minchin (2003)), Pisano et al. (pisano (2004)), have mass detection limits of (H i) = 7106M⊙, (H i) = 3106M⊙, (H i) = 2106M⊙, and (H i) = 4105M⊙, respectively. They all lack the spatial resolution and sensitivity to detect clouds comparable to HVC289+33+251 in these galaxy groups.
A larger sample of similar clouds in the vicinity of the Milky Way and other galaxies might exist that are undetectable for currently available surveys.
Acknowledgements.
T. Westmeier is supported by the German Deutsche Forschungsgemeinschaft, DFG project number KE 757/4-1. Based on observations with the 100-m telescope of the MPIfR (Max-Planck-Institut für Radioastronomie) at Effelsberg. The ATCA is part of the Australia Telescope which is funded by the Commonwealth of Australia for operation as a National Facility managed by CSIRO.References
- (1) Barnes, D. G., Staveley-Smith, L., de Blok, W. J. G., et al. 2001, MNRAS, 322, 486
- (2) Blitz, L., Spergel, D.N., Teuben, P.J., Hartmann, D., Burton, W. B. 1999, ApJ, 514, 818
- (3) de Blok, W. J. G., Zwaan, M. A., Dijkstra, M., Briggs, F. H., Freeman, K. C. 2002, A&A, 382, 43
- (4) Braun, R., Burton, W.B. 1999, A&A, 341, 437
- (5) Braun, R., Burton, W. B. 2000, A&A, 354, 853
- (6) Brüns, C., Kerp, J., Kalberla, P.M.W., Mebold, U. 2000, A&A, 357, 120
- (7) Brüns, C., Kerp, J., Pagels, A. 2001, A&A, 370, L30
- (8) Burton, W.B., Braun, R., Chengalur, J.N. 2001 A&A, 369, 616
- (9) Hartmann, D., Burton, W. B. 1997, “An atlas of Galactic Neutral Hydrogen Emission”, Cambridge University Press
- (10) de Heij, V., Braun, R., Burton, W. B. 2002, A&A, 391, 67
- (11) Kalberla, P.M.W. 2003, ApJ, 588, 805
- (12) Klypin, A., Kravtsov, A.V., Valenzuela, O., Prada, F. 1999, ApJ, 522, 82
- (13) Kravtsov, A.V., Gnedin, O.Y., Klypin, A.A. 2004, ApJ, 609, 482
- (14) Konz, C., Brüns, C., Birk, T. 2002, A&A, 391, 713
- (15) Minchin, R. F., Disney, M. J., Boyce, P. J., et al. 2003, MNRAS, 346, 787
- (16) Moore, B., Ghigna, S., Governato, F., et al. 1999, ApJ, 524, 19
- (17) Muller, C.A., Oort, J.H., Raimond, E. 1963, C.R. Acad. Sci. Paris, 257, 1661
- (18) Oort, J.H. 1966, Bull. Astr. Inst. Netherlands, 18, 421
- (19) Pisano, D. J., Barnes, D.G., Gibson, B.K., et al. 2004, ApJ, 610, 17
- (20) Putman, M.E., Gibson B.K., Staveley-Smith L., et al. 1998, Nature, 394, 752
- (21) Putman, M.E., de Heij, V., Staveley-Smith, L., et al. 2002, AJ, 123, 873
- (22) Quilis, V., Moore, B. 2001, ApJ, 555, L95
- (23) Sault, R. J., Teuben, P. J., Wright, M. C. H., 1995, in ASP Conf. Ser. 77, Astronomical Data Analysis Systems IV, ed. R. A. Shaw, H. E. Payne, & J. J. E. Haynes (San Francisco: ASP), 433
- (24) Sternberg, A., McKee, C.F., Wolfire, M.G. 2002, ApJS, 143, 419
- (25) Zwaan, M.A. 2001, MNRAS, 325, 1142
- (26) Wakker, B. P. 1991, A&A, 250, 499
- (27) Wolfire, W.G., McKee, C.F., Hollenbach, D., Tielens, A.G.G.M. 1995, ApJ, 453, 673