Why do some spotted stars become bluer as they become fainter?
Abstract
Chromospherically active, spotted stars generally become redder as well as fainter when large starspots rotate into view on the stellar disc. However, the \objectRS CVn system \objectUX Ari (a triple-lined system), becomes bluer as it gets fainter. One possible explanation is that hot, bright facular regions accompany the cool, dark photospheric spots of the active component. The bluer flux of the hotter, inactive component does not appear to be sufficient to explain the observed behaviour. We have begun a search for additional chromospherically active stars with a similar relation between colour and brightness, to investigate whether these relations can be explained in the same way. Our results for \objectV711 Tau are presented here, and we conclude that the faculae explanation holds also in this case.
keywords:
stars: activity – binaries: spectroscopic – stars: individual: \objectV711 Tau – stars: late-type – starspots1 Introduction
Very active, late-type stars, e.g. \objectUX Ari, \objectV711 Tau and \objectMM Her, show a bluer photometric colour with fainter photometric magnitude ([\astronciteCatalano et al.1996, \astronciteTaş et al.1999, \astronciteAarum Ulvås & Henry2003]); opposite to what one would expect from spotted stars. [*]amado03 found that active giants (from chromospherically active single-lined spectroscopic binaries) later than G8 have a bluer than inactive giants of the same spectral type. The effect on is smaller than that on reported by [*]ab97. The most probable explanation, according to both papers, is a facular component in the photosphere of the active star. [*]aue03 modelled as function of for \objectUX Ari and concluded that the relation cannot be explained by the bluer flux of the hotter secondary component becoming more dominant as the starspots rotate into view. It can, however, easily be explained by facular regions surrounding the starspots.
Our goal is to investigate whether the faculae explanation can apply to other stars showing the same colour-brightness relation as \objectUX Ari. We describe here a similar modelling of the relation between colour and brightness for \objectV711 Tau.
V711 Tau (\objectHR 1099, \objectHD 22468) is one of the most active and well studied \objectRS CVn stars. The spectroscopic binary star is the primary (A) component of the visual binary ADS 2644 and consists of a K1 IV primary component and a G5 V secondary component. The secondary (B) component of the visual binary is situated away and has spectral classification K3 V ([\astronciteJeffers & van den Bos1963, \astronciteWilson1963, \astronciteWilson1964, \astronciteBopp & Fekel1976, \astronciteFekel1983]).
In the following discussion we follow the notation of [*]fekel83: Components Aa and Ab refer, respectively, to the more active K1 IV primary component and the less active G5 V secondary component of the spectroscopic binary. Component A refers to the primary component of the visual binary and will also be used for any combined properties of Aa and Ab. Finally, component B refers to the K3 V secondary component of the visual binary.
The photospheric and chromospheric activity is mainly associated with component Aa, but also Ab has shown some spot activity ([\astronciteGarcía-Alvarez et al.2003], and references therein). This fact makes \objectV711 Tau particularly interesting, since it results in a complicated colour-brightness relation as the activity varies on two stars simultaneously on a timescale of years.
2 Observations
Photometric data of \objectV711 Tau in the Johnson and bands were obtained with the T3 0.4 m automated photoelectric telescope (APT) at Fairborn Observatory111http://www.fairobs.org/ in southern Arizona. About half of the data has previously been published by [*]hehh95, where descriptions of the observing and reduction procedures can be found.
The observations of \objectV711 Tau were made with a diaphragm, implying that component B was also included in the measurements. For this reason we included B also in our modelling.
3 Modelling of spots and faculae
We used the method of [*]aue03 to calculate the differences in and for the whole \objectV711 Tau system compared to the case of unspotted stars. The calculations resulted in and in the sense spotted minus unspotted and made use of the stellar and spot parameters as presented in Table 1.
| Parameter | Reference |
|---|---|
| K | [*]garcia-alvarezetal03 |
| K | [*]garcia-alvarezetal03 |
| K | [*]gray92 |
| [*]garcia-alvarezetal03 | |
| [*]garcia-alvarezetal03 | |
| [*]gray92 | |
| K | [*]garcia-alvarezetal03 |
| K | [*]aue03 |
Most of the parameter values were taken from [*]garcia-alvarezetal03. This is the case for the stellar effective temperatures and , the stellar radii and , and the spot temperature . We used the same for both Aa and Ab, in agreement with [*]garcia-alvarezetal03. Only the very active Aa was assumed to have faculae, in agreement with findings by [*]ab97 and [*]amado03. The facular temperature was set 250 K higher than the Aa effective temperature, consistent with the modelling by [*]aue03.
The changes in and for the whole system were modelled in two cases:
-
1.
The active regions were visible on both the active stars at the same time.
-
2.
The active regions were visible on only one active star at a time.
The observed changes in and are the results of the rotations of the Aa and Ab spotted surfaces. Our model mimics the rotational modulation by varying the relative areas of the active regions.
4 Results and discussion
In order to compare our modelled to the observed values, we derived from the observations in the sense observed value minus the brightest observed value. Similarly, we derived in the observations in the sense observed minus the average of those observations having . The brightest measurement represents the \objectV711 Tau system as close to unspotted as we can get from the data.
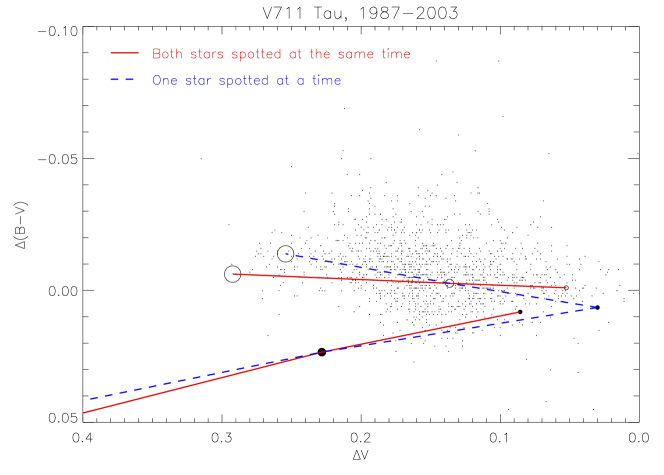
Our results are presented in Figure 1. The observations are shown as dots. The model calculation results are represented by open and filled circles with different sizes. The filled circles represent cases where the active regions contained only dark spots, and no faculae. The open circles represent cases where the active regions contained both dark spots and faculae (but only for Aa, as explained in Section 3). The varying sizes of the plotting symbols reflect varying relative areas of the active regions. Along the lines connecting the plotting symbols, only the relative areas of the active regions were varied, mimicing the rotation of the system. The red, solid lines represent case 1, where the active regions on both stars were visible at the same time. The blue, dashed lines represent case 2, where the active regions on only one star were visible at a time.
Figure 1 shows that the models with spots only (filled circles) cannot explain the observed relation between and . This is the case even when Ab is unspotted as the spots of Aa rotate into view (blue, dashed line, filled circles). The bluer flux of Ab is insufficient to compensate for the redder flux of the starspots, given the parameters in Table 1.
[*]aue03 made a test in the case of \objectUX Ari to find for which stellar and spot parameters the bluer flux of the hotter secondary component would compensate for the redder flux of the starspots. They found that this requires such a low spot temperature and such a small primary component radius that the active component would be quite different from its listed spectral type, and this explanation consequently seems unlikely.
In both cases with faculae (open circles in Figure 1) the modelling results fall within the observed range in , thereby providing an explanation for the observed relation. The observations do not facilitate a distinction between cases 1 and 2 (red, solid lines and blue, dashed lines, respectively), however.
It seems likely that the spots of Ab and the active regions of Aa are visible at the same orbital phase during some observing seasons and at opposite phases during other seasons. This effect is likely to cause the large spread in the observed for all observed values of in Figure 1 (also suggested by the two lines connected by open circles). We also note that the measurements towards redder in Figure 1 can represent cases where the active regions of Aa contain spots only, and no faculae, as was also found in the case of \objectUX Ari ([\astronciteAarum Ulvås & Engvold2003]).
We conclude that photospheric facular areas remain the most plausible explanation for the observed relation between photometric colour and photometric brightness for \objectV711 Tau. The bluer flux of the hotter, less active component only partly compensates the redder flux of the cool starspots.
Acknowledgements.
This work is supported by the German Research Foundation under project number TW9249–DFG STR 645/1–2. This research has made use of the SIMBAD database, operated at CDS, Strasbourg, France.References
- [\astronciteAarum Ulvås & Engvold2003] Aarum Ulvås V., Engvold O. 2003, A&A 399, L11
- [\astronciteAarum Ulvås & Henry2003] Aarum Ulvås V., Henry G.W. 2003, A&A 402, 1033
- [\astronciteAmado2003] Amado P.J. 2003, A&A 404, 631
- [\astronciteAmado & Byrne1997] Amado P.J., Byrne P.B. 1997, A&A 319, 967
- [\astronciteBopp & Fekel1976] Bopp B.W., Fekel F. 1976, AJ 81, 771
- [\astronciteCatalano et al.1996] Catalano S., Rodonò M., Frasca A., Cutispoto G. 1996, in Stellar Surface Structure, ed. K.G. Strassmeier & J.L. Linsky, IAU Symp. 176 (Kluwer Academic Publishers), 403
- [\astronciteFekel1983] Fekel F.C. 1983, ApJ 268, 274
- [\astronciteGarcía-Alvarez et al.2003] García-Alvarez D., Barnes J.R., Collier Cameron A. et al. 2003, A&A 402, 1073
- [\astronciteGray1992] Gray D.F. 1992, The observation and analysis of stellar photospheres, 2nd edn. (Cambridge University Press)
- [\astronciteHenry et al.1995] Henry G.W., Eaton J.A., Hamer J., Hall D.S. 1995, ApJS 97, 513
- [\astronciteJeffers & van den Bos1963] Jeffers H.M., van den Bos W.H. 1963, Pub. Lick Obs. 21, 1
- [\astronciteTaş et al.1999] Taş G., Evren S., İbanoǧlu C. 1999, A&A 349, 546
- [\astronciteWilson1963] Wilson O.C. 1963, ApJ 138, 832
- [\astronciteWilson1964] Wilson O.C. 1964, PASP 76, 238