Global Characteristics of X-Ray Flashes and X-Ray-Rich GRBs Observed by HETE-2
Abstract
We describe and discuss the global properties of 45 gamma-ray bursts (GRBs) observed by HETE-2 during the first three years of its mission, focusing on the properties of X-Ray Flashes (XRFs) and X-ray-rich GRBs (XRRs). We find that the numbers of XRFs, XRRs, and GRBs are comparable. We find that the durations and the sky distributions of XRFs and XRRs are similar to those of GRBs. We also find that the spectral properties of XRFs and XRRs are similar to those of GRBs, except that the values of the peak energy of the burst spectrum in , the peak energy flux , and the energy fluence of XRFs are much smaller – and those of XRRs are smaller – than those of GRBs. Finally, we find that the distributions of all three kinds of bursts form a continuum in the [(2-30 keV),(30-400) keV]-plane, the [(2-400 keV), ]-plane, and the [(50-300 keV), ]-plane. These results provide strong evidence that all three kinds of bursts arise from the same phenomenon.
1 Introduction
Gamma-ray bursts (GRBs) whose energy fluence in the X-ray energy band (2-30 keV) is larger than their energy fluence in the gamma-ray energy band (30-400 keV) have received increasing attention over the last few years. In particular, the Wide Field Camera (WFC) on BeppoSAX detected events that were not detected by the Gamma-Ray Burst Monitor (GRBM) on the same satellite. These events have been termed “X-ray flashes” (XRFs) (Heise et al., 2000). Events for which the ratio of the fluence in the X-ray energy band is intermediate between those for XRFs and GRBs have been termed “X-ray-rich GRBs” (XRRs).111Throughout this paper, we define “X-ray-rich” GRBs (XRRs) and “X-ray flashes” (XRFs) as those events for which and 0.0, respectively. Understanding the relationship between XRFs, XRRs, and GRBs may provide a deeper understanding of the prompt emission of GRBs.
2 Observations
In this paper, we investigate the global properties of a sample of HETE-2 bursts. We require the bursts in this sample to satisfy the following criteria: (1) the burst is detected in the WXM, (2) the burst is localizable by the WXM, and (3) the signal-to-noise of the WXM data is sufficient to carry out a spectral analysis of the burst. Generally, a joint spectral analysis is carried out for the WXM and the FREGATE data.
Forty-five bursts observed by HETE-2 between the beginning of the HETE-2 mission and 2003 September 13 met these criteria, and this is the sample of bursts that we study. In this study, we consider three spectral models: (1) a power law (PL) model whose two parameters are the power-law index and the normalization constant of the spectrum at 15 keV; (2) a power law times exponential (PLE) model whose three parameters are the power-law index , the cutoff energy , and ; and (3) the Band function (Band et al., 1993) whose four parameters are the low-energy power-law index , the cutoff energy , the high-energy power-law index , and . We determine whether the data requests a more complicated model (e.g., the PLE model instead of the PL model, or the Band function instead of the PLE model) using the maximum likelihood ratio test, and require a significance in order to adopt the more complicated model.
Table 1 gives some information about the localization and the WXM time histories of the 45 bursts in the sample. Table 2 gives the details of the fits made to the time-averaged spectral data for each of the bursts, including the class of the burst (e.g., XRF, XRR, GRB) and the spectral parameters of the best-fit spectral model. Table 3 gives the photon number and energy fluence of each burst in the 2-30, 30-400, and 2-400 keV energy bands, and also energy fluence ratio between 2-30 keV and 30-400 keV. Table 4 gives the photon number peak flux (1 second) of each burst in 2-30 keV, 30-400 keV, 2-400 keV and 50-300 keV (BATSE Channels 3 and 4; Paciesas et al. (1999)) bands.
When the WXM photon time- and energy-tagged data (TAG data) are available, we apply a “cut” to the WXM data using only the photons from the pixels on wires in the X and Y detectors that were illuminated by the burst and that maximize the signal-to-noise ratio (S/N), in the same manner as we did for GRB 020531 (Lamb et al., 2004a). We used the spectral survey data (PHA data for WXM, and SP data for FREGATE), when TAG data are not available. The WXM and FREGATE detector response matrix has been well-calibrated using observations of the Crab nebula (WXM; Shirasaki et al. (2003), FREGATE; Olive et al. (2003)). We use the XSPEC version 11.2.0 software package to do the spectral fits. Details of instruments are given in Kawai et al. (2003) and Shirasaki et al. (2003) for the WXM, and in Atteia et al. (2003) for the FREGATE.
The time histories of the bursts, details of the spectral fitting procedure, and time-resolved spectroscopy of some of the bursts are given in a companion paper (Sakamoto et al 2004b; see also Lamb et al. 2004b). Other information about the bursts, including skymaps of the HETE-2 WXM and SXC localizations; the FREGATE and durations of the bursts; whether an X-ray, optical, or radio afterglow was detected; whether a host galaxy has been identified; and the redshift of the burst can be found in the First HETE-2 Burst Catalog (Vanderspek et al., 2004).
3 X-ray and -ray Fluences
3.1 Distribution of Ratio of X-ray and -ray Fluences
The distribution of the fluence ratio (2-30 kev)/ (30-400 keV) for the 45 bursts in this study is shown in Figure 1. The boundaries between GRBs and XRRs, and XRRs and XRFs are shown as dashed lines. The Figure clearly shows that XRFs, XRRs, and GRBs form a single broad distribution. The numbers of XRFs, XRRs, and GRBs, are 16, 19, and 10, respectively. The numbers of all three kinds of bursts are roughly equal, modulo the relatively small sample size.
3.2 SX versus Sγ
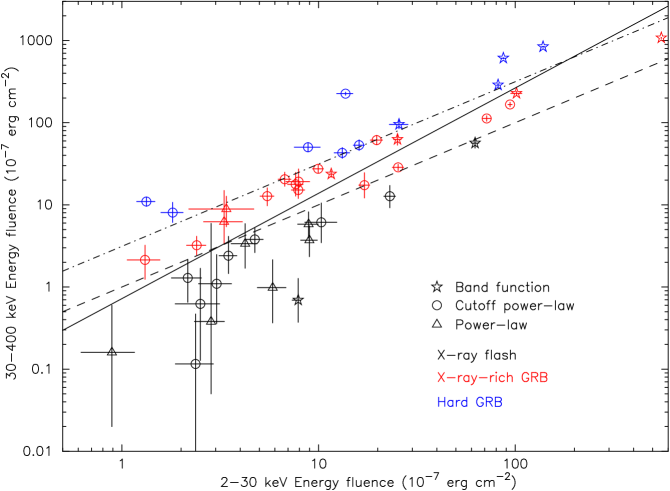
Figure 2 shows the distributions of XRFs, XRRs, and GRBs in the [(2-30 keV), (30–400 keV)]-plane. As was evident in Figure 1, the three GRB classes seem to form a single distribution. There is a strong, tight positive correlation between (2-30 keV) and (30-400 keV): (30-400 keV) = (0.7220.161) (2-30 keV)1.282±0.082. The tightness of the correlation implies that there are no bursts in the HETE-2 sample with a high X-ray fluence and a low -ray fluence, or vice versa.
4 Durations
Figure 3 shows the distribution of (top panel) and (bottom panel) in the WXM energy band (2-25 keV) for each kind of GRB. For comparison, we also show the distribution of and for the BATSE bursts (Paciesas et al., 1999). Although the energy bands in which and are calculated are different for HETE-2 and BATSE, the distribution of the durations of the HETE-2 GRBs are consistent with the distribution of the durations of the BATSE long GRBs. There is also no evidence for any difference in the distribution of durations between the three kinds of GRBs. This result is consistent with the BeppoSAX WFC/CGRO BATSE sample of XRFs (Kippen et al., 2002).
5 Sky Distributions
Figure 4 shows the sky distribution in ecliptic coordinates of HETE-2 XRFs, XRRs, and GRBs (upper three panels), and of all of the 44 HETE-2 bursts 222Since the attitude control camera was not operational, the celestial coordinates of GRB010225 is not available. in this study (bottom panel). The HETE-2 sky coverage is not uniform, and as a result, it is difficult to make a meaningful statement about the sky distributions of these three kinds of GRBs. Modulo this and the relatively small sample size of each of the three kinds of bursts, there is no statistically significant evidence that the sky distributions of the three kinds of bursts are different.
6 Distribution of Spectral Parameters
We find that a simple PL model provides an adequate fit to the spectral data for eight of the 45 bursts in this study. Six of these bursts are XRFs and two are XRRs. In the case of the five XRFs, the slope of the power-law index is 2. We inteprete that the spectral data for these bursts do not constrain but the fact that means that is about 2 keV. This energy is near or below the lower limit of the WXM energy band. Therefore, we are observing the high-energy power-law portion of their Band spectrum and they are XRFs. In the case of the four XRRs, the normalization constants of the spectra are the lowest among all of the XRRs and GRBs. We therefore interprete the lack of evidence for in these bursts as due to the low signal-to-noise of their spectra. In this case, it is difficult to constrain the break energy, , of the spectra and the best representable spectral model will be a simple power-law.
We find that the PLE model provides an adequate fit to the spectral data for 28 of the 45 bursts in this study. Eight of these bursts are XRFs, thirteen are XRRs, and six are GRBs. The remaining ten bursts in this study are adequately fit by the Band model but not by any simpler model.
We do not include two GRBs (GRB020813 and GRB030519) with in this study, because they do not represent actual “peak” energy in spectrum.
6.1 Distribution of -Values
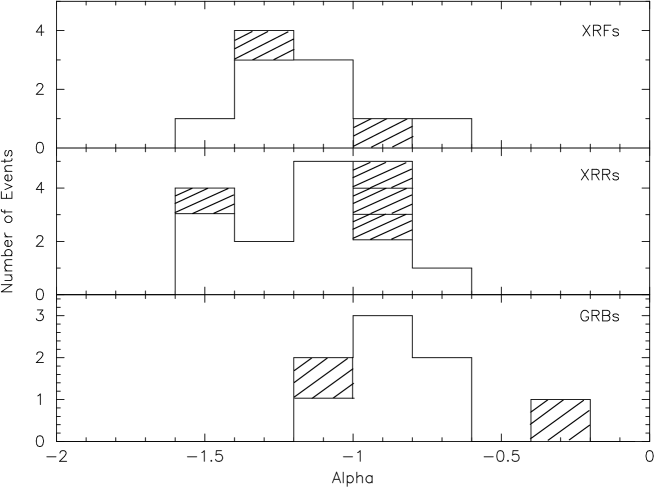
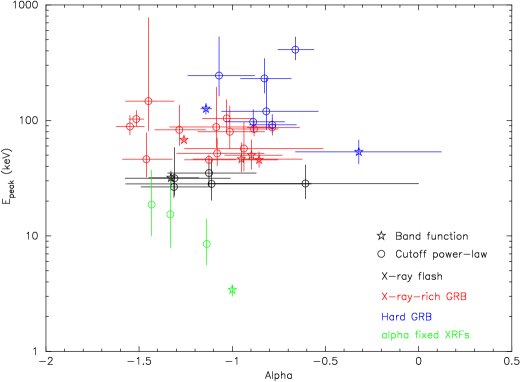
Figure 5 shows the distribution of the low-energy photon index . We include in this figure bursts which require the PLE model or the Band model in order to adequately represent their energy spectra. We do not include bursts whose spectra are adequately represented by a simple PL model, since in this case the photon index of the PL model is most likely the high-energy photon index of the Band model. There is a well-known systematic effect when fitting the PLE model to a spectrum whose shape is that of the Band model but for which the energy range or the signal-to-noise of the observations is insufficent to require the Band model: the low-energy power-law index is smaller (more negative) than it would otherwise be, and the peak energy of the spectrum in is larger than it would otherwise be. This systematic effect must be kept in mind when comparing bursts for which the PLE model adequately represents the data and bursts for which the Band model is required to adequately represent the data. We therefore show as hatched the -values for burst spectra requiring the Band model and as non-hatched the -values for burst spectra that are adequately fit by the PLE model. However, there is no clear evidence in Figure 5 of the above systematic effect.
The distribution of the low-energy photon index clusters around , and is similar to the BATSE distribution of values (Preece et al., 2000). The relatively small number of bursts with in the HETE-2 burst sample compared to the BATSE sample of bright bursts (Preece et al., 2000) could be due to three reasons: (1) the HETE-2 burst sample might be lacking very hard GRBs because such bursts are relatively more difficult for the WXM to detect and to localize, (2) the HETE-2 values are for time-averaged burst spectra whereas the values reported for the BATSE sample of bright bursts by (Preece et al., 2000) are for time-resolved spectra; and (3) the PLE model provides an adequate fit to the spectra of most of the HETE-2 bursts, and therefore the value of is systematically more negative than it would otherwise be, as mentioned above. The first reason is unlikely because very hard GRBs are also very intense (i.e., they have large peak fluxes and fluences). The second reason may play a role, since it is well known that the spectra of most bursts are hardest at or near the peak of the burst time history and softer afterward. We regard the third reason as the most likely, since the vast majority of the 5000 time-resolved burst spectra in the BATSE sample required the Band model in order to adequately fit the spectrum.
There are no statistically significant differences between the distributions of values for XRFs, XRRs, and GRBs (see the top three panels of Figure 5), although comparison of the three distributions suffers from small number statistics and from the presence of the above systematic effect. Nevertheless, we conclude that there is no evidence that the distribution of -values for XRFs, XRRs, and GRBs are different.
6.2 Distribution of -Values
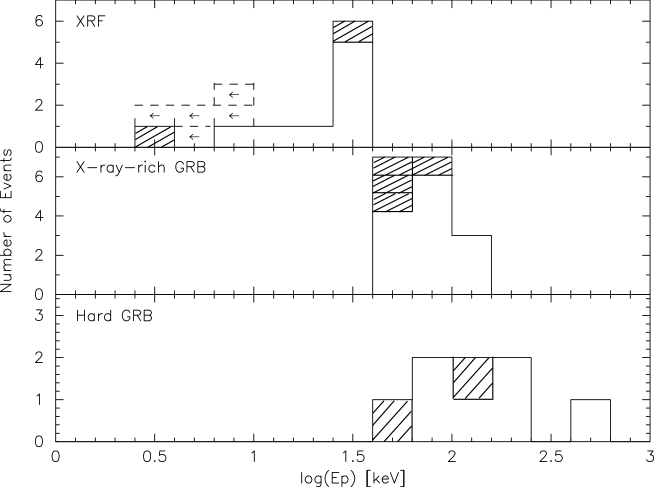
Figure 6 shows the distribution of the observed peak energy of the burst spectra in . The events labeled with left-pointing arrows are the 99.7% upper limits for derived using the constrained Band function (Sakamoto et al., 2004a). The distribution of is clearly distorted by the systematic effect mentioned above; i.e., bursts for which the PLE model provides an adequate representation of the data have values of that are larger than they would otherwise be. Despite this systematic effect, the distribution of values for the sample of HETE-2 GRBs is much broader than that for the BATSE sample of time-resolved spectra of bright bursts (Preece et al., 2000). In particular, the distribution of values in the HETE-2 burst sample extends to much lower energies. There are clear differences between the distributions for XRFs, XRRs, and GRBs, but this is simply because of the strong correlation that must exist between and the fluence ratio (2-30 keV)/(30-400 keV). This is the fact that we are classifying the GRBs for 30 keV as a boundary. The distributions of the XRRs and the hard GRBs are quite similar.
7 Correlations Between and Other Burst Properties
7.1 vs. Fluence Ratio
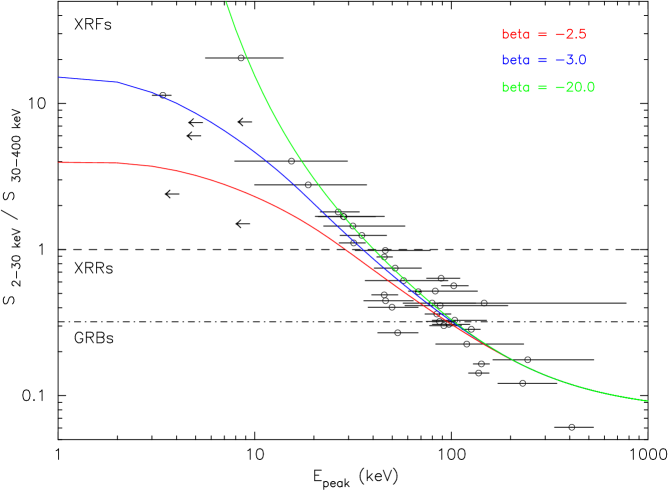
Figure 8 shows the distribution of observed peak energy versus the fluence ratio (2-30 keV)/(30-400 keV). Since the fluence ratio is independent of the normalization parameter of the model spectrum, it is possible to calculate the relationship between the fluence ratio and . The overlaid curves in Figure 8 are the calculated relationships, assuming the Band function, for = 1 and = 2.5 (red), 3.0 (blue), and 20.0 (green). The dependence of the fluence ratio on is weak when is greater than 30 keV, and understandably, becomes strong when is less than 30 keV. This implies that the choice of the proper spectral model is important for determining the fluence ratio, and for determining which bursts are XRFs and XRRs. Fortunately, the importance of choosing the correct spectral model for the latter is modest because a range in of (2)-(20) produces a range in the fluence ratio of only 40% at = 30 keV, which corresponds to the boundary between XRFs and XRRs.
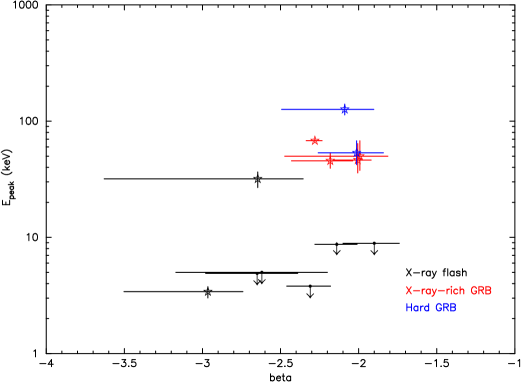
7.2 and vs.
Figure 9 shows the distribution of -values (left panel) and -values (right panel) versus . and show no statistically significant correlation with , and therefore none with the kind of burst. Kippen et al. (2002) also found no statistically significant correlation between and in the BeppoSAX WFC/CGRO BATSE sample of XRFs and GRBs.
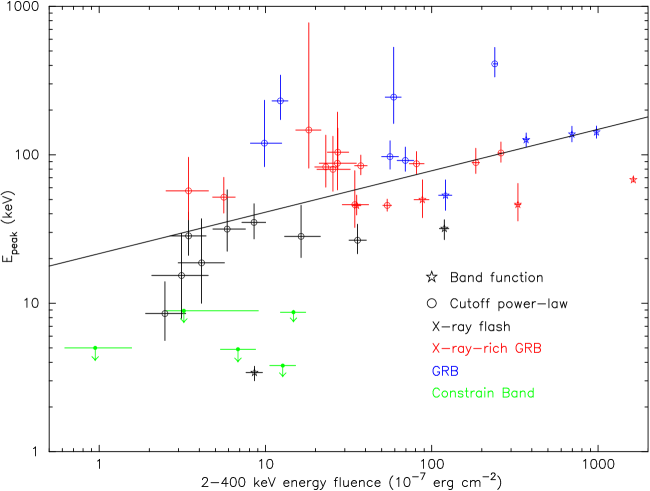
7.3 2-400 keV Fluence vs.
The correlation between the fluence in 2–400 keV and are shown in Figure 10. This figure shows the correlation between (2–400 keV) and . The best-fit power-law slope between and (2–400 keV) is 0.279 0.053. Thus, while the scatter in the correlation is large (the correlation coefficient is 0.511), the significance of the correlation is also large.
7.4 Peak Photon Number Flux vs.
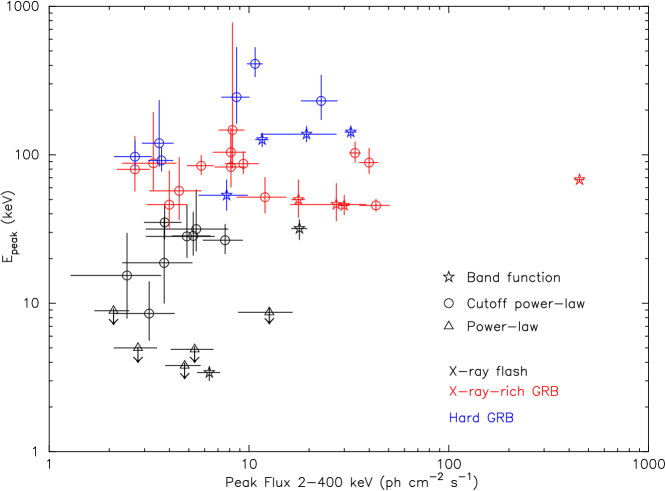
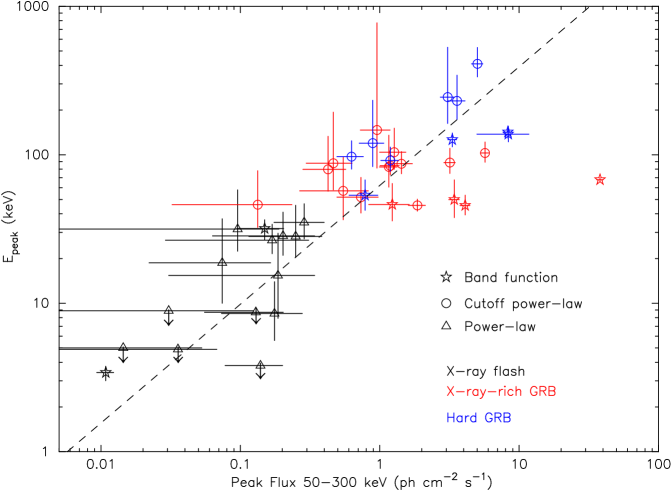
Figures 11 and 12 show the distribution of HETE-2 bursts in the [(2–400 keV),]-plane and the [(50–300 keV),]-plane, respectively. There is no evidence for a correlation between and the peak photon flux (2–400 keV), while a strong correlation exists between and the peak photon flux (50–300 keV) (the latter has a correlation coefficient of 0.802). Kippen et al. (2002) suggested a similar correlation for the WFC/BATSE sample of XRFs and GRBs.
However, the correlation between and (50-300 keV) is an artifact of the choice of 50-300 keV for the energy band in which the peak flux is measured. The reason is that for GRBs (50–300 keV) is roughly the bolometric peak photon number flux, whereas for XRRs, and especially for XRFs, (50–300 keV) it is clearly not. This is because lies near or below the lower limit of this energy band for XRRs, and far below the lower limit of the energy band for XRFs. The result is that the peak photon number fluxes for these bursts are greatly reduced from their bolometric values, as can be clearly seen by comparing Figures 11 and 12.
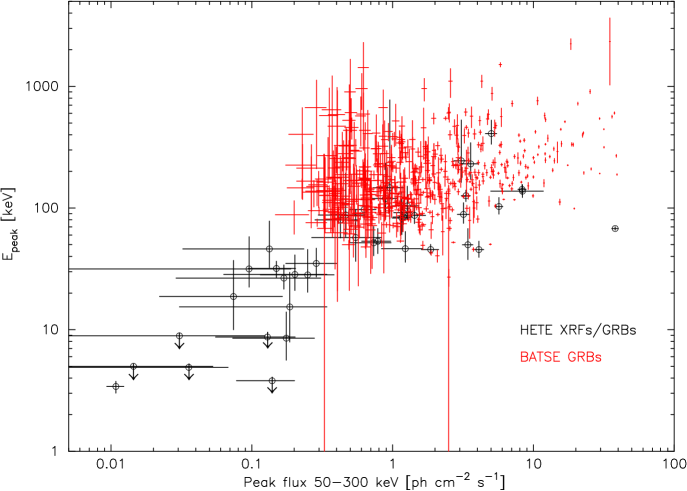
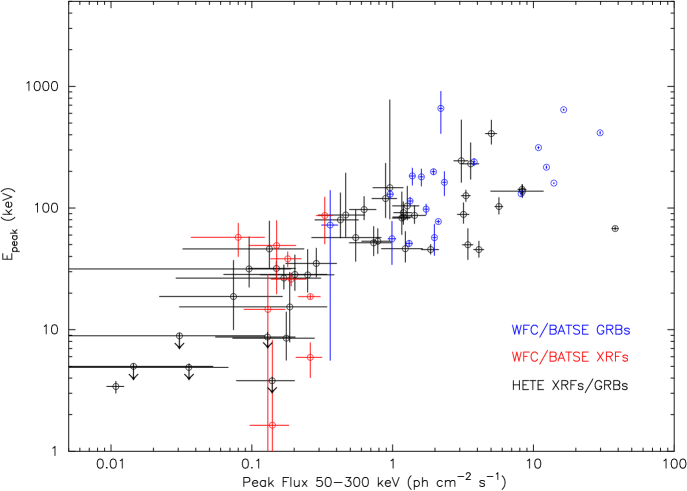
Figures 13 and 14 compare the distribution of HETE-2 bursts in the [(50-300 keV),]-plane with the distribution of BATSE bursts and the distribution of WFC/BATSE bursts, respectively, in the same plane. The distribution of HETE-2 bursts is consistent with the distribution of BATSE bursts for 50 keV but extends farther down in (and therefore in (50-300 keV)). This is expected because of the BATSE trigger threshhold, which is 50 keV. The distribution of HETE-2 bursts is consistent with the distribution of WFC/BATSE bursts but also extends down to fainter peak photon number fluxes for a similar reason.
8 Discussion
8.1 Comparison of XRF, XRR, and GRB Properties
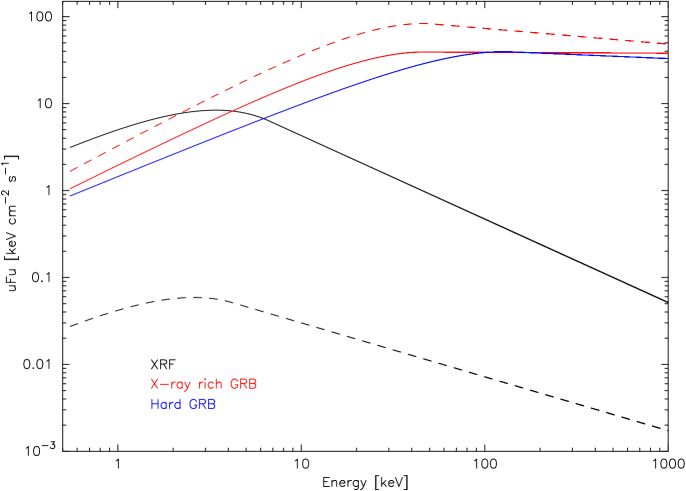
We have studied the global properties of 45 GRBs localized by the HETE-2 WXM during the first three years of its mission, focusing on the properties of XRFs and XRRs. We find that the numbers of XRFs, XRRs, and GRBs are comparable for bursts localized by the HETE-2 WXM. We find that there is no statistically significant evidence for any difference in the duration distributions or the sky distributions of the three kinds of bursts. We also find that the spectral properties of XRFs and XRRs are similar to those of GRBs, except that the values of the peak energy of the burst spectrum in , the peak flux ,and the fluence of XRFs are much smaller – and those of XRRs are smaller – than those of GRBs. Our results are consistent with Barraud et al. (2003) who studied the spectral properties of the HETE-2 GRBs using the FREGATE data. Figure 15, which shows the best-fit spectra of two XRFs, two XRRs, and two GRBs, illustrates this. Finally, we find that the distributions of all three kinds of bursts form a continuum in the [(2-30 keV), (30-400 keV)]-plane, the [(2-400 keV), ]-plan, and the [(50-300 keV), ]-plane. These results provide strong evidence that all three kinds of bursts arise from the same phenomenon.
8.2 Theoretical Models of XRFs
Several theoretical models of XRFs have been proposed. GRBs at very high redshifts might be observed as XRFs (Heise et al., 2000). However, the fact that the duration distribution for XRFs is similar to that for GRBs argues against this hypothesis as the explanation of most XRFs, as does the low redshifts (Soderberg et al., 2004; Fynbo et al., 2004) and the redshift constraints (Bloom et al., 2003) that exist for several XRFs.
According to Mészáros, Ramirez-Ruiz, Rees, & Zhang (2002) and Woosley, Zhang, & Heger (2003), X-ray (20-100 keV) photons are produced effectively by the hot cocoon surrounding the GRB jet as it breaks out, and could produce XRF-like events if viewed well off the axis of the jet. However, it is not clear that such a model would produce roughly equal numbers of XRFs, XRRs, and GRBs, or the nonthermal spectra exhibited by XRFs.
Yamazaki et al. (2002, 2003) have proposed that XRFs are the result of a highly collimated GRB jet viewed well off the axis of the jet. In this model, the low values of and (and therefore for and ) seen in XRFs is the result of relativistic beaming. However, it is not clear that such a model can produce roughly equal numbers of XRFs, XRRs, and GRBs, and still satisfy the observed relation between and (Amati et al., 2002; Lamb et al., 2004b).
The “dirty fireball” model of XRFs posits that baryonic material is entrained in the GRB jet, resulting in a bulk Lorentz factor 300 (Dermer et al., 1999; Huang et al., 2002; Dermer and Mitman, 2003). At the opposite extreme, GRB jets in which the bulk Lorentz factor 300 and the contrast between the bulk Lorentz factors of the colliding relativistic shells in the internal shock model are small can also produce XRF-like events (Mochkovitch et al., 2003).
It has been proposed that XRFs are due to universal GRB jets in which the luminosity falls off like a power law from the jet axis (Zhang & Mészáros, 2002; Rossi et al., 2002) and are viewed well off the jet axis (Zhang et al., 2004). However, Lamb, Donaghy & Graziani (2004) have shown that such a model predicts far more XRFs than GRBs, in conflict with the HETE-2 results described in this paper. A universal GRB jet model in which the luminosity falls off like a Gaussian may do better (Zhang et al., 2004).
Lamb, Donaghy & Graziani (2004) have shown that a unified description of XRFs, XRRs, and GRBs is possible in a model in which the GRB jet opening angle varies over a wide range. In this model, XRFs are due to jets with wide opening angles while GRBs are due to jets with narrow opening angles.
As this discussion suggests, understanding the properties of XRFs and XRRs, and clarifying the relationship between these two kinds of events and GRBs, could provide a deeper understanding of the prompt emission of GRBs. And as Lamb, Donaghy & Graziani (2004) have emphasized, XRFs may provide unique insights into the nature of GRB jets, the rate of GRBs, and the relationship between GRBs and Type Ic supernovae.
9 Conclusions
We have studied the global properties of 45 GRBs observed by HETE-2 during the first three years of its mission, focusing on the properties of XRFs and XRRs. We find that the numbers of XRFs, XRRs, and GRBs are comparable. We find that the durations and the sky distributions of XRFs and XRRs are similar to those of GRBs. We also find that the spectral properties of XRFs and XRRs are similar to those of GRBs, except that the values of the peak energy of the burst spectrum in , the peak flux ,and the fluence of XRFs are much smaller – and those of XRRs are smaller – than those of GRBs. Finally, we find that the distributions of all three kinds of bursts form a continuum in the [(2-30 keV), (30-400 keV)]-plane, the [(2-400 keV), ]-plan, and the [(50-300 keV), ]-plane. These results provide strong evidence that all three kinds of bursts arise from the same phenomenon. They also provide constraints on theoretical models of XRFs.
References
- Amati et al. (2002) Amati, L., et al. 2002, A&A, 390, 81
- Atteia et al. (2003) Atteia, J-L, et al. 2003, in Gamma-Ray Bursts and Afterglow Astronomy, eds. G. R. Ricker and R. Vanderspek (New York: AIP), 17
- Band et al. (1993) Band, D. L., et al. 1993, ApJ, 413, 281
- Barraud et al. (2003) Barraud, C., et al. 2003, A&A, 400, 1021
- Bloom et al. (2003) Bloom, J. S., et al. 2003, ApJ, 599, 957
- Dermer et al. (1999) Dermer, C. D., Chiang, J., and Bttcher 1999, ApJ, 513, 656
- Dermer and Mitman (2003) Dermer, C. D., and Mitman, K. E. 2003, in proc. of Third Rome Workshop: Gamma-Ray Bursts in the Afterglow Era (astro-ph/0301340)
- Fynbo et al. (2004) Fynbo, J. P. U., et al. 2004, ApJ, 609, 962
- Heise et al. (2000) Heise, J., in’t Zand, J., Kippen, R. M., & Woods, P. M., in Proc. 2nd Rome Workshop: Gamma-Ray Bursts in the Afterglow Era, eds. E. Costa, F. Frontera, J. Hjorth (Berlin: Springer-Verlag), 16
- Huang et al. (2002) Huang, Y. F., Dai, Z. G., and Lu, T. 2002, MNRAS, 332, 735
- Kawai et al. (2003) Kawai, N., et al. 2003, in Gamma-Ray Bursts and Afterglow Astronomy, eds. G. R. Ricker and R. Vanderspek (New York: AIP), 25
- Kippen et al. (2002) Kippen, R. M., Woods, P. M., Heise, J., in’t Zand, J., Briggs, M. S., & Preece, R. D. 2002, in Gamma-Ray Bursts and Afterglow Astronomy, eds. G. R. Ricker and R. Vanderspek (New York: AIP), 244
- Lamb, Donaghy & Graziani (2004) Lamb, D. Q., Donaghy, T. Q., and Graziani, C. 2004, submitted to ApJ(astro-ph/0312634)
- Lamb et al. (2004a) Lamb, D. Q., et al. 2004a, submitted to ApJ, (astro-ph/0206151)
- Lamb et al. (2004b) Lamb, D. Q., et al. 2004b, in preparation
- Mallozzi et al. (1995) Mallozzi, R. S., Paciesas, W. S., Pendleton, G. N., Briggs, M. S., Preece, R. D., Meegan, C. A. & Fishman, G. J. 1995, ApJ, 454, 597
- Mészáros, Ramirez-Ruiz, Rees, & Zhang (2002) Mészáros, P., Ramirez-Ruiz, E., Rees, M. J., & Zhang, B. 2002, ApJ, 578, 812
- Mochkovitch et al. (2003) Mochkovitch, R., Daigne, F., Barraud, C., & Atteia, J. L. 2003, ASP Conference Series (San Francisco: ASP), in press (astro-ph/0303289)
- Olive et al. (2003) Olive, J.-F., et al. 2003, in Gamma-Ray Bursts and Astronomy, eds. G. R. Ricker and R. Vanderspek (New York: AIP), 88
- Paciesas et al. (1999) Paciesas, W. S., et al. 1999, ApJS, 122, 465
- Preece et al. (2000) Preece, R. D., Briggs, M. S., Mallozzi, R. S., Pendleton, G. N., & Paciesas, W. S. 2000, ApJS, 126, 19
- Rossi et al. (2002) Rossi, E., Lazzati, D., and Rees, M. J. 2002, MNRAS, 332, 945
- Sakamoto et al. (2004a) Sakamoto, T., et al. 2004, ApJ, 602, 875
- Sakamoto et al. (2004b) Sakamoto, T., et al. 2004, in preparation.
- Shirasaki et al. (2003) Shirasaki, Y., et al. 2003b, PASJ, 55, 1033
- Soderberg et al. (2004) Soderberg, A. M., et al. 2004, ApJ, 606, 994
- Vanderspek et al. (2004) Vanderspek, R., et al. 2004, in preparation
- Woosley, Zhang, & Heger (2003) Woosley, S. E., Zhang, W. & Heger, A. 2003, ApJ, submitted (astro-ph/0206004)
- Yamazaki et al. (2002) Yamazaki, R., Ioka K. & Nakamura T. 2002, ApJ, 571, L31
- Yamazaki et al. (2003) Yamazaki, R., Ioka K. & Nakamura T. 2003, ApJ, submitted (astro-ph/0212557)
- Zhang & Mészáros (2002) Zhang, B. & Mészáros, P. 2002, ApJ, 571, 876
- Zhang et al. (2004) Zhang, B., Dai, X., Lloyd-Ronning, N. M., & Mészáros, P. 2004, 601, L119
| GRB | BID | TTa | TSb | EBc | R.A. | Dec. | errord | t50 (WXM) | t90 (WXM) | ||||
|---|---|---|---|---|---|---|---|---|---|---|---|---|---|
| GRB010213 | 10805 | -2.41 | 13.60 | — | — | — | 10h31m36s | +05d30m39s | 239.6 | 50.3 | 30.2′ | 8.6 1.2 | 24.5 1.2 |
| GRB010225e | 1491 | -23.10 | 0.97 | G | 1.3s | 5-120 | — | — | — | — | — | 6.2 1.3 | 15.9 3.9 |
| GRB010326B | 1496 | 7.97 | -15.02 | G | 160ms | 5-120 | 11h24m24s | -11d09m57s | 271.2 | 46.3 | 36′ | 1.7 0.2 | 5.2 0.2 |
| GRB010612 | 1546 | 13.81 | 1.17 | G | 160ms | 30-400 | 18h03m18s | -32d08m01s | 359.2 | -4.9 | 36′ | 17.4 0.8 | 28.5 0.2 |
| GRB010613 | 1547 | -30.50 | 25.17 | G | 1.3s | 30-400 | 17h00m40s | +14d16m05s | 33.9 | 30.9 | 36′ | 23.8 1.2 | 51.8 0.7 |
| GRB010629B | 1573 | -26.60 | 8.29 | G | 1.3s | 5-120 | 16h32m38s | -18d43m24s | 358.6 | 19.5 | 15′ | 9.3 0.3 | 16.2 0.2 |
| GRB010921 | 1761 | -23.95 | 39.45 | G | 1.3s | 5-120 | 23h01m53s | +44d16m12s | 103.1 | -14.3 | 20∘15′ | – | – |
| GRB010928 | 1770 | -2.99 | 35.00 | G | 1.3s | 30-400 | 23h28m55s | +30d39m11s | 102.9 | -26.7 | 16.4′ 11∘ | 29.5 3.5 | 59.0 1.8 |
| GRB011019 | 10823 | -18.29 | -17.63 | — | — | — | 00h42m50s | -12d26m58s | 114.7 | -75.2 | 35′ | 12.2 1.3 | 31.6 1.2 |
| GRB011103 | 1829 | -0.32 | -10.94 | XG | 5.12s | — | 03h20m37s | 17d40m01s | 166.1 | -32.4 | — | 8.6 1.7 | 19.7 1.2 |
| GRB011130 | 1864 | -13.03 | 22.83 | XG | 5.12s | — | 03h05m36s | +03d48m36s | 174.4 | -45.2 | 10′ | 23.8 0.6 | 39.5 0.4 |
| GRB011212 | 10827 | -1.60 | 9.71 | — | — | — | 05h00m05s | +32d07m39s | 171.8 | -6.3 | 11′ | 33.2 1.2 | 72.5 2.8 |
| GRB020124 | 1896 | 14.65 | -31.57 | G | 1.3s | 30-400 | 09h32m49s | -11d27m35s | 244.9 | 28.3 | 12′ | 18.6 1.1 | 50.2 2.3 |
| GRB020127 | 1902 | -7.51 | 20.76 | G | 5.12s | 30-400 | 08h15m06s | +36d44m31s | 184.7 | 31.8 | 8′ | 6.0 0.3 | 17.6 1.9 |
| GRB020317 | 1959 | -17.14 | 15.15 | G | 1.3s | 5-120 | 10h23m21s | +12d44m38s | 228.1 | 52.5 | 18′ | 2.4 0.4 | 14.7 0.5 |
| GRB020331 | 1963 | 6.91 | -14.33 | G | 160ms | 30-400 | 13h16m34s | -17d52m29s | 311.3 | 44.6 | 10′ | 35.7 1.8 | 78.7 1.8 |
| GRB020531 | 2042 | 22.94 | 11.33 | G | 20ms | 30-400 | 15h14m45s | -19d21m35s | 343.6 | 32.0 | 38′ | 1.1 0.2 | 2.5 0.3 |
| GRB020625 | 2081 | 5.64 | 10.12 | G | 5.2s | 30-400 | 20h44m14s | +07d10m12s | 53.3 | -21.1 | 13.8′ | 13.5 1.2 | 119.2 2.4 |
| GRB020801 | 2177 | 4.73 | 35.44 | G | 1.3s | 30-400 | 21h02m14s | -53d46m13s | 343.9 | -40.7 | 13.9′ | 262.9 4.2 | 348.9 4.4 |
| GRB020812 | 2257 | -15.30 | -12.13 | G | 1.3s | 30-400 | 20h38m48s | -05d23m34s | 40.7 | -26.3 | 13.8′ | 14.1 0.6 | 42.0 1.0 |
| GRB020813 | 2262 | 0.04 | -3.81 | G | 1.3s | 30-400 | 19h46m38s | -19d35m16s | 20.8 | -20.7 | 1′(S) | 30.0 | 89.0 |
| GRB020819 | 2275 | 17.70 | -22.45 | G | 160ms | 30-400 | 23h27m07s | +06d21m50s | 88.5 | -50.8 | 7′ | 11.5 0.3 | 46.9 2.0 |
| GRB020903 | 2314 | 4.20 | 12.64 | XG | 5.12s | — | 22h49m25s | -20d53m59s | 38.9 | -61.5 | 16.7′ | 4.8 0.4 | 10.0 0.7 |
| GRB021004 | 2380 | 3.92 | -12.39 | G | 5.2s | 30-400 | 00h26m57s | +18d55m44s | 114.9 | -43.6 | 2′(S) | 26.6 1.0 | 77.1 2.6 |
| GRB021021 | 10623 | 15.24 | 11.92 | — | — | — | 00h17m23s | -01d37m00s | 103.8 | -63.2 | 20′ | 22.1 1.2 | 56.5 1.2 |
| GRB021104 | 2434 | 22.56 | 22.38 | G | 1.3s | 5-120 | 03h53m48s | +37d57m12s | 158.1 | -12.2 | 26′ | 10.2 0.5 | 18.1 0.2 |
| GRB021112 | 2448 | 12.24 | 27.06 | G | 1.3s | 5-120 | 02h36m52s | +48d50m56s | 140.2 | -10.5 | 20′ | 6.8 1.2 | 14.7 1.1 |
| GRB021211 | 2493 | -12.55 | -0.01 | G | 160ms | 30-400 | 08h09m00s | +06d44m20s | 215.7 | 20.3 | 2′(S) | 3.1 0.1 | 13.3 0.3 |
| GRB030115 | 2533 | 13.01 | -3.11 | G | 1.3s | 30-400 | 11h18m30s | +15d02m17s | 237.4 | 65.2 | 2′(S) | 9.2 0.5 | 49.6 4.3 |
| GRB030226 | 10893 | -13.00 | -16.27 | — | — | — | 11h33m01s | +25d53m56s | 212.5 | 72.4 | 2′(S) | 66.4 3.9 | 137.7 4.9 |
| GRB030323 | 2640 | 4.05 | 35.06 | XG | 320ms | — | 11h06m54s | -21d51m00s | 273.0 | 34.9 | 18′ | 13.9 1.6 | 32.6 2.7 |
| GRB030324 | 2641 | -26.35 | 0.57 | G | 1.3s | 30-400 | 13h37m11s | -00d19m22s | 326.6 | 60.4 | 7′ | 8.9 0.3 | 25.8 0.8 |
| GRB030328 | 2650 | 5.05 | 7.14 | G | 1.3s | 5-120 | 12h10m51s | -09d21m05s | 286.4 | 52.2 | 1′(S) | 106.9 1.2 | 315.8 3.0 |
| GRB030329 | 2652 | 26.68 | -29.00 | G | 1.3s | 5-120 | 10h44m49s | +21d28m44s | 217.1 | 60.7 | 2′(S) | 12.1 0.2 | 33.1 0.5 |
| GRB030416 | 10897 | -1.98 | -11.32 | — | — | — | 11h06m51s | -02d52m58s | 258.8 | 50.8 | 7′ | 19.7 1.7 | 61.5 1.2 |
| GRB030418 | 2686 | 7.45 | -9.66 | XG | 13.280s | — | 10h54m53s | -06d59m22s | 259.1 | 45.7 | 9′ | 38.7 0.9 | 117.6 0.7 |
| GRB030429 | 2695 | 8.88 | 11.83 | XG | 6.72s | — | 12h13m06s | -20d56m00s | 291.0 | 41.1 | 1′(S) | 38.4 1.5 | 77.4 1.2 |
| GRB030519 | 2716 | -41.00 | 16.18 | G | 160ms | 30-400 | 14h58m18s | -32d56m57s | 331.5 | 22.8 | 30′ | 6.1 0.6 | 13.8 0.7 |
| GRB030528 | 2724 | 20.66 | 6.14 | G | 1.3s | 30-400 | 17h04m02s | -22d38m59s | 0.0 | 11.3 | 2′(S) | 20.8 1.2 | 49.2 1.2 |
| GRB030723 | 2777 | 1.55 | 10.93 | XG | 6.72s | WXM | 21h49m30s | -27d42m06s | 21.2 | -49.9 | 2′(S) | 9.9 0.3 | 20.2 0.5 |
| GRB030725 | 2779 | 18.41 | 33.10 | G | 160ms | 5-120 | 20h33m47s | -50d45m49s | 348.2 | -36.6 | 14.4′ | 68.3 3.4 | 200.0 2.5 |
| GRB030821 | 2814 | 12.13 | 32.47 | G | 1.3s | 30-400 | 21h42m33s | -45d12m12s | 354.3 | -48.5 | 120′x10′ | 11.7 1.5 | 22.9 0.5 |
| GRB030823 | 2818 | 11.67 | -32.65 | G | 5.2s | 5-120 | 21h30m47s | +21d59m46s | 73.2 | -21.0 | 5.4′ | 30.2 1.4 | 66.4 1.9 |
| GRB030824 | 2821 | -29.79 | -31.43 | G | 1.3s | 5-120 | 00h05m02s | +19d55m37s | 108.3 | -41.6 | 11.2′ | 13.1 1.8 | 36.4 0.4 |
| GRB030913 | 2849 | -2.05 | 4.62 | G | 1.3s | 30-400 | 20h58m02s | -02d12m32s | 46.5 | -29.0 | 30′ | 2.9 0.3 | 6.7 0.3 |
GRB Classa Modelb [keV] K D.O.F. GRB010213 XRF Band (fixed) 0.940 44 GRB010225 XRF PLE — 0.925 39 GRB010326B† XRR PLE — 0.856 111 GRB010612 GRB PLE — 0.884 65 GRB010613 XRR Band 0.785 134 GRB010629B XRR PLE — 0.817 110 GRB010921† XRR PLE — 0.939 140 GRB010928† GRB PLE — 0.825 125 GRB011019 XRF PLE (fixed) — 0.854 68 GRB011103 XRR PL — — 1.266 38 GRB011130 XRF PL — 3.9d 1.016 40 GRB011212 XRF PL — — 0.795 54 GRB020124 XRR PLE — 0.710 95 GRB020127 XRR PLE — 0.746 110 GRB020317 XRF PLE — 0.923 53 GRB020331 GRB PLE — 0.732 111 GRB020531 GRB PLE — 0.831 141 GRB020625 XRF PLE (fixed) — 0.781 55 GRB020801† GRB Band 0.638 140 GRB020812 XRR PLE — 0.664 68 GRB020813† GRB Band 1.160 140 GRB020819 XRR Band 0.945 108 GRB020903 XRF PL — 5.0d ( 0.845 26 GRB021004 XRR PLE — 0.949 68 GRB021021 XRF PLE (fixed) — 0.879 41 GRB021104† XRF PLE — 0.744 38 GRB021112 XRR PLE — 1.126 61 GRB021211 XRR Band 1.149 140 GRB030115 XRR PLE — 0.812 67 GRB030226 GRB PLE — 0.894 139 GRB030323 XRR PL — — 0.835 33 GRB030324 XRR PLE — 0.882 76 GRB030328 GRB Band 0.982 140 GRB030329 XRR Band 1.537 139 GRB030416 XRF PL — 3.8d (2.6) 0.870 54 GRB030418 XRR PLE — 0.929 68 GRB030429 XRF PLE — 0.720 68 GRB030519† GRB Band 0.742 124 GRB030528† XRF Band 0.809 109 GRB030723 XRF PL — 8.9d 0.952 142 GRB030725 XRR PLE — 1.069 141 GRB030821 XRR PLE — 0.971 98 GRB030823 XRF PLE — 0.708 110 GRB030824 XRF PL — 8.7d (6.1) 0.813 53 GRB030913 GRB PLE — 0.740 53
a GRB classification; XRF: X-ray-flash, XRR: X-ray-rich GRB, GRB: GRB
b Spectral model; PL: Power-law; PLE: Power-law times exponential cutoff; Band: Band function
c Normalization at 15 keV in units of 10-2 photons cm-2 s-1 keV-1
d 99.7% upper limit and 90% confidence interval (in parenthesis) derived by the
constrained Band function
The constant factor is multiplied to the spectral model.
GRB Duration Photon fluencea Energy fluenceb X/ ratio [sec.] 2–30 keV 30–400 keV 2–400 keV 2–30 keV 30–400 keV 2–400 keV GRB010213 34.41 11.38 GRB010225 9.76 1.45 GRB010326B 3.50 0.75 GRB010612 47.19 0.18 GRB010613 141.56 0.45 GRB010629B 24.58 0.89 GRB010921 23.85 0.64 GRB010928 34.55 0.06 GRB011019 24.57 2.77 GRB011103 14.75 0.53 GRB011130 50.00 5.96 GRB011212 57.68 1.26 GRB020124 40.63 0.32 GRB020127 25.63 0.33 GRB020317 10.00 1.68 GRB020331 75.00 0.30 GRB020531 1.04 0.12 GRB020625 41.94 20.49 GRB020801 117.97 0.27 GRB020812 60.16 0.41 GRB020813 113.00 0.16 GRB020819 50.16 0.40 GRB020903 13.00 7.31 GRB021004 49.70 0.43 GRB021021 49.15 4.03 GRB021104 31.41 1.69 GRB021112 4.00 0.61 GRB021211 8.00 0.49 GRB030115 36.00 0.52 GRB030226 68.81 0.31 GRB030323 19.61 0.38 GRB030324 15.73 0.43 GRB030328 199.23 0.28 GRB030329 62.94 0.51 GRB030416 78.64 2.42 GRB030418 110.10 0.99 GRB030429 24.58 1.25 GRB030519 20.97 0.14 GRB030528 83.56 1.11 GRB030723 31.25 7.47 GRB030725 83.88 0.56 GRB030821 21.21 0.36 GRB030823 55.56 1.81 GRB030824 15.73 1.53 GRB030913 9.12 0.23
a Photon number fluences are in units of photon cm-2
b Photon energy fluences are in units of 10-7 erg cm-2
GRB Classa Modelb Fc F F F GRB010213 XRF Band 6.33 0.77 (2.97 0.55) 10-3 6.33 0.81 (1.08 0.15) 10-2 GRB010225 XRF PLE 5.11 2.36 0.33 0.17 5.45 2.39 (9.56 9.37) 10-2 GRB010326B XRR PLE 10.52 3.29 1.51 0.35 12.03 3.33 0.73 0.24 GRB010612 GRB PLE 4.32 1.16 4.35 0.48 8.67 1.38 3.07 0.35 GRB010613 XRR Band 24.66 11.60 2.68 0.87 27.34 11.19 1.23 0.40 GRB010629B XRR PLE 39.08 7.30 4.17 0.42 43.25 7.40 1.86 0.26 GRB010921 XRR PLE 34.20 4.05 5.74 0.46 39.93 4.21 3.19 0.30 GRB010928 GRB PLE 3.83 0.76 6.91 0.45 10.74 0.94 5.02 0.46 GRB011019 XRF PL 3.62 1.41 0.15 0.13 3.76 1.44 (7.41 7.33) 10-2 GRB011103 XRR PL 4.42 1.12 0.14 0.08 4.55 1.14 (6.53 4.27) 10-2 GRB011130 XRF PL 5.27 1.27 (8.20 6.28) 10-2 5.35 1.28 (3.57 3.21) 10-2 GRB011212 XRF PL 1.13 0.97 7.66 10-2 1.14 0.96 4.43 10-2 GRB020124 XRR PLE 6.90 1.63 2.49 0.40 9.38 1.77 1.43 0.28 GRB020127 XRR PLE 5.95 1.17 2.17 0.42 8.12 1.50 1.27 0.27 GRB020317 XRF PLE 4.63 1.04 0.64 0.25 5.26 1.13 0.20 0.14 GRB020331 GRB PLE 1.93 0.37 1.72 0.23 3.65 0.51 1.19 0.17 GRB020531 GRB PLE 17.41 4.46 5.56 0.74 22.97 4.69 3.58 0.51 GRB020625 XRF PL 2.86 0.97 0.31 0.17 3.17 1.07 0.18 0.10 GRB020801 GRB Band 6.36 1.13 1.38 0.25 7.73 2.11 0.79 0.18 GRB020812 XRR PLE 2.48 0.84 0.84 0.26 3.32 1.00 0.47 0.17 GRB020813 GRB Band 19.53 1.29 12.79 0.83 32.31 2.07 8.31 0.55 GRB020819 XRR Band 12.09 1.05 5.60 0.44 17.68 1.34 3.42 0.29 GRB020903 XRF PL 2.75 0.66 3.23 10-2 2.78 0.67 1.37 10-2 GRB021004 XRR PLE 1.80 0.38 0.89 0.20 2.69 0.50 0.43 0.15 GRB021021 XRF PL 2.14 1.06 0.31 0.24 2.45 1.17 0.19 0.16 GRB021104 XRF PLE 4.23 1.79 0.67 0.22 4.89 1.83 0.25 0.13 GRB021112 XRR PLE 3.45 1.15 1.03 0.37 4.47 1.29 0.55 0.28 GRB021211 XRR Band 21.60 1.33 8.36 0.56 29.97 1.74 4.10 0.34 GRB030115 XRR PLE 6.97 1.32 1.16 0.17 8.13 1.38 1.16 0.17 GRB030226 GRB PLE 1.71 0.51 0.99 0.17 2.69 0.57 0.63 0.14 GRB030323 XRR PL 3.37 2.10 0.49 0.22 3.86 2.11 0.29 0.15 GRB030324 XRR PLE 6.63 1.04 1.63 0.30 8.27 1.20 0.96 0.23 GRB030328 GRB Band 6.72 0.51 4.92 0.33 11.64 0.85 3.32 0.24 GRB030329 XRR Band 378.59 21.20 72.20 3.77 450.88 24.68 38.06 2.04 GRB030416 XRF PL 4.50 0.91 0.26 0.10 4.77 0.94 (1.39 0.62) 10-2 GRB030418 XRR PLE 3.69 0.85 0.30 0.15 3.99 0.91 0.13 0.10 GRB030429 XRF PLE 3.08 0.72 0.71 0.19 3.79 0.79 0.29 0.11 GRB030519 GRB Band 7.52 3.37 11.89 4.81 19.41 7.96 8.36 3.38 GRB030528 XRF Band 17.28 1.52 0.61 0.12 17.89 1.57 (1.50 0.55) 10-1 GRB030723 XRF PLE 1.98 0.38 0.12 2.10 0.41 3.06 10-2 GRB030725 XRR PLE 24.83 1.79 9.12 0.55 33.96 2.15 5.69 0.37 GRB030821 XRR PLE 3.84 0.72 1.93 0.27 5.77 0.86 1.19 0.19 GRB030823 XRF PLE 7.03 1.62 0.57 0.26 7.60 1.70 0.17 0.14 GRB030824 XRF PL 12.37 3.77 0.28 0.14 12.65 3.82 (1.29 0.74) 10-1 GRB030913 GRB PLE 2.20 0.48 1.36 0.25 3.55 0.63 0.89 0.18
a GRB classification; XRF: X-ray-flash, XRR: X-ray-rich GRB, GRB: GRB
b Spectral model; PL: power-law, PLE: power-law times exponential cutoff, Band: Band function
c Photon number peak fluxes are in units of photons cm-2s-1