Determining cosmological parameters from X-ray measurements of strong lensing clusters
Abstract
We discuss a new method which is potentially capable of constraining cosmological parameters using observations of giant luminous arcs in rich X-ray clusters of galaxies. The mass profile and the mass normalization of the lenses are determined from X-ray measurements. The method also allows to probe the amount and equation of state of the dark energy in the universe. The analysis of a preliminary sample of 6 luminous, relatively relaxed clusters of galaxies strongly favours an accelerating expansion of the universe. Under the assumption that the dark energy is in the form of a cosmological constant, the data provide an estimate of with a statistical error of . Including the constraint of a flat universe and an equation of state for the dark energy , we obtain and . Relaxing the prior on , we find that the null energy condition is satisfied at the 3- confidence level.
keywords:
Gravitational lensing – cosmological parameters – cosmology: theory – cosmology: dark matter – galaxies: clusters: general – X-rays: galaxies: clusters1 Introduction
A growing body of evidence suggests that most of the energy density in the universe consists of some sort of dark energy. Recent observations of the power spectrum of fluctuations in the cosmic microwave background (CMB; Spergel et al. (2003)), of large scale structure (Hawkins et al., 2003) as well as supernovae data (Knop et al., 2003; Tonry et al., 2003) demand for significant pressure-negative dark energy that is not clustered with the galaxies.
The phenomenological equation of state , i.e. the ratio between the pressure of the unknown energy component and its rest energy density has therefore assumed a central role in observational cosmology. The simplest explanation for dark energy is a cosmological constant, for which ; another possibility is quintessence, i.e., a scalar field rolling down an almost flat potential (Caldwell et al., 1998; Ratra and Peebles, 1998; Rubano and Scudellaro, 2002); -essence, namely a scalar field with non canonical kinetic terms (Armendariz-Picon et al., 1999), or models based on branes and extra dimensions, such as the Cardassian scenario (Zhu and Fujimoto, 2003), can also drive an accelerated expansion.
Even though the equation of state is generally time-dependent, a properly calculated weighted mean of can approximate the late time behavior of a large class of models (Wang et al., 2000). In a Friedmann-Lemaître-Robertson-Walker (FLRW) model of universe, the distance depends on only through a multiple integral on the redshift (Maor et al., 2001), and current data do not enable to reconstruct the time evolution of the equation of state. In what follows, we will consider an equation of state for the dark energy assumed to be constant with redshift.
Investigations on are usually restricted to a limited range by assuming that the so called null energy condition (NEC) of general relativity is fulfilled on macroscopic scales. Under quite general hypotheses, NEC puts a lower bound to the value of (Schuecker et al., 2003). While no strict mathematical proofs of NEC exist, from a phenomenological point of view this assumption is not justified.
The necessity of extending dark energy analyses is further illustrated by some models of quintessence with a time dependent in which the assumption of constant leads to an estimated value of the mean equation of state smaller than (Melchiorri et al., 2003). So, it is useful to enlarge the parameter space to (Hannestad and Mörtsell, 2002; Melchiorri et al., 2003; Schuecker et al., 2003; Knop et al., 2003; Spergel et al., 2003; Zhu et al., 2004).
Matter with is named phantom energy (Caldwell et al., 2003). Theoretical motivations for such an unusual behavior have already been proposed, cf. for instance the string theory (Caldwell et al., 2003). The positive phantom energy density becomes infinite in a finite time, overcoming all other forms of matter and leading to a big rip.
Although several independent methods of observations all converge towards a coherent picture, the real signature of the accelerated expansion of the universe is provided by the apparent magnitude versus redshift test for type Ia supernovae. Other attempts to build the Hubble diagram, like those based on the compact radio source angular size (Chen and Ratra, 2003), give constraints that, even though consistent with supernovae data, are much weaker. Systematic effects, such as luminosity evolution, gray intergalactic dust, gravitational lensing or selection biases, could mimic the effects of dark energy (Sereno et al., 2002; Tonry et al., 2003). Although it is believed that these contaminants are under control, an independent constraint can improve the statistical significance of the statement about the expansion of the universe: it is therefore still useful to develop new tools for the determination of the cosmological parameters. Gravitational lensing studies can provide such methods.
Results from the statistical strong gravitational lensing of flat-spectrum radio sources based on the CLASS sample (Chae, 2003) are in good agreement with those from type Ia supernovae. Here, we are interested in cluster of galaxies acting as lenses. Clusters of galaxies provide a laboratory for studying and measuring the energy content of the universe in a variety of ways. They are the largest virialized structures and their importance in observational cosmology is well known. In the beginning of the last century, the need for unseen dark matter was first stated by direct estimates of their total masses (Zwicky, 1933). After a century, astronomers face again darkness. The turn of dark energy has came.
Clusters of galaxies acting as lenses on background high redshift galaxies have been long proposed as sources of information on the universe (Paczyński and Gorski, 1981; Breimer and Sanders, 1992; Fort et al., 1997; Link and Pierce, 1998; Lombardi and Bertin, 1998; Gautret et al., 2000; Meneghetti et al., 2004). Values of a particular ratio of angular diameter distances can be determined once the modeling of the lens is constrained and both the arc position and its redshift are measured (Chiba et al., 2002; Golse et al., 2002). Sereno (2002) discussed the feasibility of using these gravitational lens systems to discriminate between accelerating or decelerating models of universe and to probe the amount and equation of state of the dark energy. The observations of a suitable number of lensing clusters at intermediate redshift can determine the equation of state.
The combined analysis of independent observations of clusters of galaxies at different wavelengths can greatly improve the knowledge of the system allowing to gain an insight into the second-order cosmological parameters (De Filippis et al., 2004). Sereno (2003) used a combined analysis of the intracluster medium (ICM) within the hydrostatic region, as derived from both Sunyaev-Zel’dovich effect measurements and X-ray images, to constrain the Hubble constant and the cosmological matter density.
Under suitable hypotheses, in a cluster of galaxy, X-ray and lensing observations probe the same potential well. Here, we propose the use of X-ray spectroscopic and surface brightness analyses of clusters of galaxies to determine the mass profile and the mass normalization. In Sec. 2, we show how the mass profile of a cluster can be derived from X-ray measurements. Section 3 discusses some threshold requirements for strong lensing events in X-ray clusters. In Sec. 4, we present the cluster data sample used in the statistical analysis and the selection criteria applied. Section 5 is devoted to deriving cosmological parameters and testing the NEC condition. A discussion on some systematics that can affect the method is contained in Sec. 6. Section 7 contains some final considerations.
2 Isothermal -model
At least in theory and under some simple assumptions, the distribution of the cluster total mass can be inferred from the modeled gas pressure distribution. In fact, the ICM is usually assumed to be isothermal and in hydrostatic equilibrium in this potential, whereas nonthermal processes do not contribute significantly to the gas pressure. Under the assumption of spherical symmetry, we have
| (1) |
where is the total mass of a cluster within radius ; and are the gas temperature and number density, respectively; is the proton mass; denotes the mean molecular weight, assumed to be constant throughout the gas, so that the electron number density traces the gas density. Its value is usually fixed with solar metallicity measurements and we shall therefore assume , with an error of %.
A conventional -model (Cavaliere and Fusco-Femiano, 1976, 1978), which is widely adopted to fit the density profile of ICM, is:
| (2) |
where is the central electron number density, the core radius and the parameter determines the slope. By assuming a constant X-ray spectral emissivity, Eq. (2) predicts the following X-ray surface brightness,
| (3) |
which provides a good fit to X-ray observations; , where is the angular diameter distance to the cluster, is a dimensionless angular variable.
Inserting Eq. (2) in Eq. (1), we get the total mass of the isothermal -model,
| (4) |
The mass density distribution is given by,
| (5) |
where
| (6) |
The surface mass density, projected along the line of sight, is
| (7) |
where is the central surface density,
| (8) |
The mass enclosed by a cylinder of radius is,
| (9) |
The profile in Eq. (7) is known as softened power-law surface mass density and the slope parameter is fixed to (Schneider et al., 1992).
In a spherically symmetric, regular lens, a strong lensing event can occur if (Schneider et al., 1992):
| (10) |
where is the critical surface mass density,
| (11) |
being the angular diameter distance from the lens to the source and the angular diameter distance from the observer to the source. A tangential critical curve appears at (Schneider et al., 1992),
| (12) |
a radial critical curve forms at
| (13) |
The corresponding radial caustic in the source plane has an angular radius , where
| (14) |
A source inside the radial caustic produces three images, one which instead is outside has only one image.
The mass profile of a cluster can be fully determined by X-ray measurements. A morphological analysis of the X-ray surface brightness allows to constrain the parameters and , while the gas temperature is determined with spectroscopic measurements.
3 Strong lensing criteria


As seen in the previous section, when we assume a spherical mass distribution, a lens can produce multiple image systems only if the central surface density overcomes the critical one. According to Eqs. (8 ,11), the criterium in Eq. (10) is fulfilled if
| (15) |
In other words, as it was to be expected, very hot and massive clusters with a small core radius are more likely to form arc-like systems.
A proper X-ray modelling is needed to check the condition in Eq. (15). Estimating the temperature profile requires a detailed spatially resolved spectroscopy. A multiphase structure in the central ICM could result in significant discrepancies between emission-weighted and mass-weighted estimates of the temperature. A simple isothermal model which does not incorporate the cooling-flow components or other complexities in the X-ray structure can lead to systematic underestimates of order 10-40% in the temperature and mass determinations (Allen, 1998).
On the average, detailed X-ray morphologies show rapid variations in the central regions; such variations may be due, for instance, to recent merger or accretion activities and, therefore, they might invalidate the assumption of hydrostatic equilibrium. Complex dynamical activities can lead to overestimating the core radius of the dominant clump in the cluster, as inferred from X-ray data. The core radius for the gravitating matter in cooling-flow clusters is usually small, in agreement with optical studies. The radius nearly doubles for intermediate systems, and, in the case of non-cooling-flows, it may be larger by a factor six (Allen, 1998).
Threshold values for strong lensing events depend on the cosmological parameters through the ratio of distances . We consider a FLRW universe filled with non-interacting pressureless matter and dark energy, described as -matter (Chiba et al., 1997; Turner and White, 1997). Since the contribution from relativistic particles is negligible in the redshift range investigated in our analysis, we will neglect it in what follows. In such a model of universe, the angular diameter distance between an observer at and a source at is
| (16) |
where
and is the present value of the Hubble parameter; and are the today normalized densities of dust and dark energy, respectively; ; Sinn is defined as being sinh when , sin when , and as the identity when . For the expression of the distance in an inhomogeneous universe, we refer to Sereno et al. (2001, 2002).
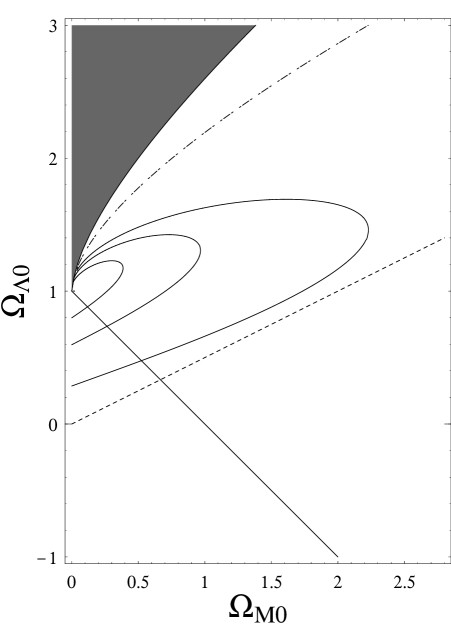
Depending on the values of the cosmological parameters, significant variations in the distance ratio have to be expected. As it can be seen from Figs. (1, 2), the ratio is an increasing function of both and . Dark energy with large negative pressure helps the formation of arc-like systems in X-ray clusters. The best case is that of a cosmological constant. Changing from to , the ratio of distances increases of 13% for a lens at and a background source at in a flat universe with . Sub-critical values of the pressureless matter density also favour strong lensing systems. The relative variation from to is for . A large value of a cosmological constant increases the cross section for strong lensing and lowers the threshold value of the combination of X-ray parameters in Eq. (15).
4 Cluster sample
| Cluster | (KeV) | refa | |||||
|---|---|---|---|---|---|---|---|
| A 2390 | 0.228 | 0.913 | 38.0 | 1,2 | |||
| MS 0451.6-0305 | 0.539 | 2.911 | 25.9 | 3 | |||
| MS 1358.4+6245 | 0.328 | 4.92 | 21.0 | 4 | |||
| MS 2137.3-2353 | 0.313 | 1.501 | 15.3 | 5,6 | |||
| PKS 0745-191 | 0.103 | 0.433 | 18.2 | 5,7 | |||
| RX J1347.5-1145 | 0.451 | 0.806 | 34.9 | 8 |
Our method to determine cosmological parameters relies on a number of assumptions: hydrostatic equilibrium, isothermality, spherical symmetry. The selection of the sample must therefore be very careful in order not to violate them (Smith et al., 2003). We have collected data from literature on luminous, relatively relaxed clusters with giant luminous arcs and well measured, X-ray spatially-resolved observations. Then, we have selected a sub-sample suitable for our analysis, by requiring: good agreement of optical and/or lensing mass measurements with the X-ray results; a regular X-ray morphology; temperature measured with Chandra Observatory or XMM-Newton satellites; arcs with known spectroscopic redshift.
The agreement between mass estimates from independent methods firmly limits the systematic uncertainties when determining the cosmological parameters. Apparently relaxed clusters can show significant discrepancy between X-ray and lensing masses (Kneib et al., 2003; Ota et al., 2004). Together with the regularity of the X-ray surface brightness emission, the consistency among the X-ray, optical and/or gravitational (both weak and strong) lensing mass measurements is a reliable indication of hydrostatic equilibrium and strongly suggests that the global properties of the clusters can be used as cosmological probes. X-ray gas should be supported by thermal pressure which dominates over non-thermal processes and the assumption of hydrostatic equilibrium can be considered valid.
Gas temperatures are typically very hard to measure (Gioia et al., 2004). whereas low resolution measurements suffer from point-source emission contaminating cluster spectra, Chandra’s or XMM-Newton’s spatial resolutions allow the identification of point sources and an independent spectral determination of the temperature in each radial shell (Allen et al., 2001a; Donahue et al., 2003). In order to be conservative in our selection procedure, we consider only clusters for which the temperatures determined with last generation satellites agree with previously reported values from ROSAT and/or ASCA data. Such an agreement is a strong indication that the temperature estimate is substantially free from systematics and that the adopted uncertainty is realistic.
We wish to stress that conditions and are often fulfilled by cooling flow clusters, which turn out to be quite regular, dynamically relaxed systems. The X-ray emission is typically symmetric and little or no substructures appear at optical wavelengths. These clusters are also amongst the most X-ray luminous.
Furthermore, the comparison of masses derived from X-ray and strong lensing show excellent agreement for cooling-flow clusters (Allen, 1998; Wu, 2000), while discrepancies appear in dynamically active clusters with either small or no cooling-flows. The oversimplification of a spherical model and the application of isothermality and equilibrium hypotheses may be inappropriate in presence of local dynamical activities.
Due to their regularity, from the point of view of gravitational lensing, cooling-flow clusters are “critical”, i.e. they may form giant arcs, only if the condition in Eq. (15) is fulfilled. On the other hand, substructures and non-equilibrium states in dynamically active, non-cooling flow systems enhance the probability of detecting strong lensing events (Bartelmann and Steinmetz, 1996), which are favourite in the presence of irregular and complex dark matter distributions. A simple spherical model, which does not account for the local dynamical activities, may lead to overestimating the gravitating masses inferred from lensing studies.
The nearly coincidence of a X-ray single peak with the cD galaxy position, which has been argued to be a good indicator of the presence of local violent activities of the intracluster gas in the central core, has also been proposed as an indicator of hydrostatic equilibrium (Allen, 1998). Typically, in cooling-flow clusters the emission is sharply peaked to a position nearly coincident or very close to the optically dominant cluster galaxy, which generally is the centre of the matter distribution as inferred from lensing studies.
After the application of our selection criteria, our final sample reduced to 6 clusters where strong lensing analysis and X-ray studies are likely to trace the same gravitational potential well. The main properties of this sample are listed in Table 1. Our sample, spanning the range , constitutes an updated sub-sample of the list in Wu (2000). Information on positions and redshifts of arcs were taken from Wu (2000) and references therein. New spectroscopic redshift measurements for MS 0451.6-0305 and MS 2137.3-2353 were instead taken from Borys et al. (2004) and Sand et al. (2002), respectively.
For each cluster, the ICM has been modeled with an isothermal -model. We consider fits to the X-ray surface brightness which extend well beyond the core radius. When more morphological analyses are available for a single cluster, we adopt results from fits that extend to the outer radius. Since we collected data from independent groups, in order to avoid unrealistic small uncertainties when comparing the data, we assume an error of on the slope when determined from Chandra observations.
Details on the X-ray spectroscopic and imaging analysis for each cluster can be found in the references listed in Table 1. Clusters in our sample have been the subjects of X-ray, optical and, often, Sunyaev-Zel’dovich effect studies. They present very regular X-ray isophotal patterns. Despite some local substructures which have been revealed in highly detailed X-ray surface brightness maps, morphological analyses support the spherical approximation: there are no evidences for violent merger shocks and the luminosity and temperatures do not seem to have been boosted substantially (Allen et al., 2001a, 2002; Arabadjis et al., 2002; Donahue et al., 2003; Hicks et al., 2002; Molikawa et al., 1999).
Apart from MS 0451.6-0305, all the clusters in our final sample present massive cooling flows in the central regions. Furthermore, for each cluster except again MS 0451.6-0305, X-ray morphological analyses have revealed a sharp central surface brightness peak at a position nearly coincident, within the astrometric resolution of Chandra observations, with the optical centroid for the dominant cluster galaxy. In MS 0451.6-0305, whereas the soft-energy peak of the X-ray surface brightness lies on the brightest cluster galaxy, a harder peak is slightly shifted (Donahue et al., 2003). However, due to the consistency between the X-ray and Sunyaev-Zel’dovich estimates of the central electron density and the agreement between the X-ray, lensing and optical estimates of the total mass of this cluster (Donahue et al., 2003), we have included it in our final sample.
5 Data analysis
Let us now perform a statistics. Observations of giant arcs in X-ray clusters enable us to estimate the distance ratio . From Eqs. (8, 11, 12), we get
| (18) |
The parameters , and are derived from a X-ray data analysis of temperature and surface brightness profiles.
The value of the angular radius of the tangential critical curve was derived from the observed arc radius . According to Ono et al. (1999), a conventional analysis where , could overestimate the strong lensing mass by 10-30%. To correct for this effect, we take , with .
The reads
| (19) |
The statistical errors include uncertainties arising from , , , and . Many input data in our analysis are presented with asymmetric uncertainties. To obtain unbiased estimates, we apply correction formulae for mean and standard deviation as given by Eqs. (15, 16) in D’Agostini (2004). Since the analysis of the X-ray parameters is highly correlated, we add the uncertainties from and as maximum errors.
Once we assume that the description of the data is a good approximation, the likelihood of the cosmological parameters turns out to be . Following Bayesian statistics, the posterior probability of a particular model after analyzing the available data is proportional to the prior probability of that model multiplied by the likelihood. For each parameter in the model, its one dimensional posterior probability function is found by marginalizing over all other parameters. Unless otherwise noted, for each parameter we quote the one-dimensional mean and standard deviation.
We first consider the case of a cosmological constant ). We limit our analysis to the region in the parameter space for which the distance to the most distant arc in our sample (at ) is not null. In Fig. 3, we show the function. According to the maximum likelihood ratio method, joint 1, 2 and 3- confidence regions for two parameters are bounded by values of 2.30 and 6.17 and 11.8, respectively. As it can be seen, our method is quite sensitive to the cosmological constant, while the pressureless matter density is poorly constrained. The best-fitting model, , is nearly coincident with a de Sitter model. As it was discussed in Gott et al. (2001), appropriate priors should be as vague or noninformative as possible. We consider two types of priors: a uniform prior, with the prior probability proportional to ; the logarithmic or Jeffrey prior, appropriate for a positive variable like , with a prior probability proportional to . Results on are highly sensitive on the choice of the prior, indicating that better data are needed to convincingly constrain this parameter (Gott et al., 2001). On the other hand, the determination of the cosmological constant is nearly insensitive to the prior.
Let us consider an uniform prior. Within 3- statistical significance, the data strongly favour accelerating models, whereas an Einstein-de Sitter model of universe () is not consistent. After marginalization, we find .
Then, following theoretical prejudices on an inflationary, nearly flat model of universe with a positive cosmological constant, we restrict our analysis to the square region of the parameter space defined by and . Adopting a uniform prior, we find and . Whichever prior we use, our analysis provides a strong evidence supporting the existence of dark energy.
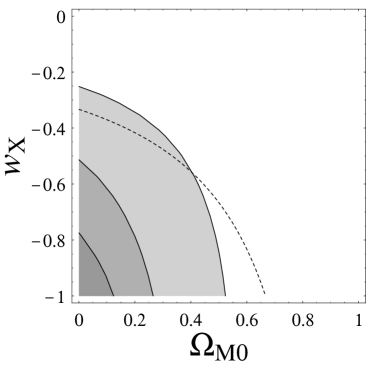
Let us now analyse the dark energy equation of state. We consider flat models (). As a first step, we impose a prior on the equation of state, . The best fit model occur for . Adopting uniform priors, after marginalization, we get and ; accelerating models of universe are favoured at the 2- level, see Fig. 4. Our analysis favours a model of universe in accelerate expansion with the energy budget dominated by dark energy. At this point, with the prior on , the cosmological constant turns out to be the best candidate as dark energy.
Our results are in a substantial agreement with current determinations (Hannestad and Mörtsell, 2002; Melchiorri et al., 2003; Knop et al., 2003; Spergel et al., 2003; Schuecker et al., 2003; Tonry et al., 2003; Zhu et al., 2004). A combined analysis of supernovae, galaxy distortion from the Two-Degree Field Galaxy Redshift Survey (2dFGRS; Hawkins et al. (2003)) and CMB data from WMAP (Spergel et al., 2003) provide an estimate of and a 95% upper confidence limit of (Knop et al., 2003). An independent analysis in Spergel et al. (2003), with some different external constraints and combining CMB, 2dFGRS power spectrum, supernovae, and the HST Key Project data, also gives the same constraint on .
5.1 Energy conditions violations
Under quite general hypotheses, in the case of a spatially flat FLRW geometry, with a negligible contribution from relativistic particles, NEC puts a lower bound on , (Schuecker et al., 2003). For , we have , i.e., the usual limit assumed in most of the investigations.
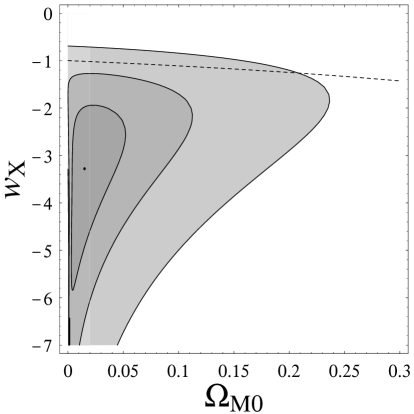
Following Schuecker et al. (2003), we use to test NEC. We find a best fitting value of . Whereas at 2- confidence level the NEC is violated, at the 3- confidence limit, it is fulfilled, see Fig. 5. The case of a cosmological constant is consistent with data at the 3- level.
Distance data alone do not well bound from below the equation of state and the lower limit of is quite uncertain (Knop et al., 2003). The weight of probability at very low pulls the confidence level downward. From supernovae data, at 99% confidence level, an upper limit of is derived, but interval extends to (Knop et al., 2003). The degeneracy can be broken by using orthogonal constraints, such as those arising from abundances of nearby clusters of X-ray clusters (Schuecker et al., 2003). The analysis in Knop et al. (2003) provides a measurement of (identified systematics). The independent analysis in Spergel et al. (2003) gives a similar result, .
6 Systematics
In the previous section, we have performed a statistical analysis based on data found in the literature. Whereas we selected a regular sample, with well measured properties, a number of systematics can still plague our analysis. We want now to address how they can affect our results.
6.1 Density profile
We have our high-redshift sample by using a -profile. Application of such a model provides robust estimates of the total mass, as shown for simulated clusters (Mohr et al., 1999) and observed clusters (Ettori et al., 2003). It is still interesting, however, to investigate the impact of a central cusp in the dark matter distribution, as predicted by numerical simulations, on our estimates. To this aim, we consider the so called universal Navarro, Frenk and White (NFW) density profile (Navarro et al., 1995). Since the similarity between the distribution of ICM tracing the dark halo of the NFW potential and the -profile (Makino et al., 1998; Ettori & Fabian, 1999), NFW parameters can be derived from the -model ones with helpful empirical formulae. We therefore applied the relations found in Makino et al. (1998). The introduction of a central cusp slightly reduces the estimated value of the cosmological constant of and the best fit value of increases of .
6.2 Temperature
Isothermal models provide a good representation of the physical properties of galaxy clusters (Ettori et al., 2002). Whereas the presence of a gradient in the temperature profile would reduce the total mass measurements and increase, consequently, the derived value of the cosmological constant, expected gradients in clusters are not steep enough to affect significantly the estimated total mass (Ettori et al., 2002). However, in order to be more confident on the temperature values used in our analysis, we checked our sample for consistency of the new temperature measurements obtained with high resolution satellite with those previously reported from ROSAT and/or ASCA data, covering a larger field of view (see data in Table 2 in Wu (2000)). This should control and exclude any systematic bias. In any case, a systematic offset in the temperature estimate of would determine a variation in of , with a positive offset determining an overestimation of the cosmological constant. The constraint on , when no priors are adopted, would be nearly washed out by such an offset.
6.3 Ellipticity and substructures
One of the more important sources of indetermination comes from the modeling of the mass profile of the lens. Morphological X-ray analyses revealed a tendency for clusters of galaxies to be elliptical, with a mean projected axis ratio of (Mohr et al., 1995; De Filippis et al., 2004). Furthermore, together with the overall mass profile, sub-structures should also be considered. High detailed X-ray surface brightness maps can reveal interesting details in the distribution of ICM. In RX J1347.5-1145 (Allen et al., 2002), Chandra observations revealed evidences of shocked gas to the south-east of the main X-ray peak, coincident with a region of enhanced Sunyaev-Zel’dovich effect, probably resulting from recent subcluster merger activity. Presence of some substructure in A 2390 (Allen et al., 2001a) and PKS 0745-191 (Hicks et al., 2002) was also detected and a hint that the brightest cluster galaxy may be just settling into the cluster core has been reported for MS 0451.6-0305 (Donahue et al., 2003).
However, when the lens presents a rather regular morphology, even if a “not correct” potential shape is used in the reconstruction, or the contribution of small sub-structures is neglected, the cosmological parameters are still retrieved, although with somewhat larger errors (Golse et al., 2002).
To best investigate the role played by these deviations from the assumed projected cylindrical symmetry, we considered an additional source of systematic uncertainty in the estimation of the position of the tangential critical radius, of the order of . The effect is quite large, introducing an error of in the determination of the reduced cosmological constant, and of in the determination of the global minimum for the equation of state (when no prior is assumed).
7 Discussion
We discussed a method to probe the cosmological parameters, based on observations of giant luminous arcs in strong lensing clusters whose mass scales and mass profiles are determined with X-ray spectroscopic and surface brightness analyses.
Giant arcs are more likely to form in massive, hot clusters with a small core radius. A large contribution to the energy budget of the universe in the form of dark energy with strong negative pressure also helps the occurrence of phenomena of strong lensing events.
In order to constrain the cosmological parameters, we considered an updated subsample of rich, strong lensing clusters from the list in Wu (2000). Only dynamically relaxed, regular systems were included. Our statistical analysis supports a dark energy dominated model of universe, in agreement with combined measurement from supernovae, galaxy clustering and CMB data, and a clear signature for an accelerated expansion of the universe is provided at the 2- confidence level. Dark energy with a strong negative pressure is also favoured. The cosmological constant provides the strongest candidate, but a wide range of quintessence models are compatible. The data are consistent with the NEC at 3- statistical significance.
The method that we have proposed is independent of the supernovae data and provides an alternative tool to probe the expansion of the universe. Our analysis is based on a very limited number of hypotheses and is not sensitive to . Clusters of galaxies are not required to be standard rulers or candles. On the contrary of supernovae analyses, our analysis does not require either homogeneity in the sample nor absence of evolution. Moreover, contamination from neighbours is truly negligible.
Then, the redshift range covered by observations of lensed, highly magnified galaxies extends well beyond the supernova survey limits and can probe the changing point between the pressureless matter dominated era and the dark energy one.
The method however needs a detailed modeling of the lens from X-ray observations and a deep understanding of the structure of the X-ray potential well is crucial. The identification of irregularities and substructures in a complex morphology is very important when predicting arc position.
Assumptions made in the methodology must be verified testing systematics. The use of new X-ray data enables us to refine the criteria to select clusters in hydrostatic equilibrium, such as the nearly coincidence of a X-ray single peak with the cD galaxy position or, mainly, the presence of a cooling-flow. Thus far, detailed X-ray analyses, based on Chandra or XMM-Newton observations, have been explicitly derived for several lensing clusters. Whereas for some clusters (A1835, MS 1358, and A2390), there is a good agreement with the lensing analyses (Allen et al., 2001a; Schmidt et al., 2001; Arabadjis et al., 2002), a significant discrepancy is found, for example, in the irregular clusters A2218 (Machacek et al., 2002) and A1689 (Xue and Wu, 2002). Whereas A2218 shows an offset between the X-ray centroid and the central dominant cD galaxy in A1689 the X-ray centre perfectly coincides with the cD galaxy. An analysis of AC 114 (De Filippis et al., 2004) shows a good agreement between X-ray and lensing results, despite an offset of . In a forthcoming paper, we want to extend our method to clusters of galaxies with an irregular X-ray morphology but very rich in multiple image systems.
Acknowledgments
The authors thank E. De Filippis for useful discussions and the anonymous referee for her/his comments that helped to greatly improve and clarify several points of the paper.
References
- Allen (1998) Allen, S.W., 1998, MNRAS, 296, 392
- Allen et al. (2001a) Allen, S. W., Ettori, S., & Fabian, A. C. 2001, MNRAS, 324, 877
- Allen et al. (2001b) Allen, S. W., Schmidt, R.W., & Fabian, A. C. 2001, MNRAS, 328, 37
- Allen et al. (2002) Allen, S. W., Schmidt, R.W., & Fabian, A. C. 2002, MNRAS, 335, 256
- Arabadjis et al. (2002) Arabadjis, J. S., Bautz, M. W., & Garmire, G. P. 2002, APJ, 572, 66
- Armendariz-Picon et al. (1999) Armendariz-Picon, C., Damour, T., Mukhanov, V., 1999, Phys. Lett. B, 458, 209
- Bartelmann and Steinmetz (1996) Bartelmann, M., Steinmetz, M., 1996, MNRAS, 283, 431
- Borys et al. (2004) Borys, C., et al., astro-ph/0404473
- Breimer and Sanders (1992) Breimer, T.G., & Sanders, R.H., 1992, MNRAS, 257, 97
- Caldwell et al. (1998) Caldwell, R.R., Dave, R., & Steinhardt, P.J., 1998, Phys. Rev. Lett., 80, 1582
- Caldwell et al. (2003) Caldwell, R.R., Kamionkowski, M., Weinberg, N.N, 2003, Phys. Rev. Lett, 91, 071301
- Cavaliere and Fusco-Femiano (1976) Cavaliere, A., & Fusco-Femiano, R., 1976, A&A, 49, 137
- Cavaliere and Fusco-Femiano (1978) Cavaliere, A., & Fusco-Femiano, R., 1978, A&A, 70, 677
- Chae (2003) Chae, K.-H., 2003, MNRAS, 346, 746
- Chen and Ratra (2003) Chen, G., & Ratra, B., 2003, ApJ, 582, 586
- Chiba et al. (1997) Chiba, T., Sugiyama, N., & Nakamura, T., 1997, MNRAS, 289, L5
- Chiba et al. (2002) Chiba, T., & Takahashi, R., 2002, Prog. Theor. Phys., 107, 625
- D’Agostini (2004) D’Agostini, G., physics/0403086
- De Filippis et al. (2004) De Filippis, E., Bautz, M.W., Sereno, M., Garmire, G.P., 2004, ApJ, in press; astro-ph/0405295
- De Filippis et al. (2004) De Filippis, E., Sereno, M., Longo, G., Bautz, M.W., 2004, in preparation
- Donahue et al. (2003) Donahue, M., Gaskin, J.A., Patel, S.K., Joy, M., Clowe, D., Hughes, J.P., 2003, ApJ, 598, 190.
- Ettori & Fabian (1999) Ettori, S., Fabian, A.C., 1999, MNRAS, 305, 834.
- Ettori et al. (2002) Ettori, S., De Grandi, S., Molendi, S., 2002, A&A, 391, 841.
- Ettori et al. (2003) Ettori, S., Tozzi, P., Borgani, S., Rosati, P., 2004, A&A, 417, 13.
- Fort et al. (1997) Fort, B., Mellier, Y., & Dantel-Fort, M., 1997, A&A, 321, 353
- Gavazzi et al. (2003) Gavazzi, R., Fort, B., & Mellier Y., Pelló, R., Dantel-Fort, M., 2003, A&A 403, 11
- Gautret et al. (2000) Gautret, L., Fort, B., & Mellier Y., 2000, A&A 353, 10
- Gioia et al. (2004) Gioia, I.M., Braito, V., Branchesi, M., Della Ceca, R., Maccacaro, T., Tran, K.-V. 2004, A&A, 419, 517
- Golse et al. (2002) Golse, G., Kneib, J.-P., & Soucail, G., 2002, A&A, 387, 788
- Gott et al. (2001) Gott J.R., Vogeley, M.S., Podariu, S., Ratra, B., 2001, ApJ, 549, 1
- Hannestad and Mörtsell (2002) Hannestad, S., Mörtsell, E., 2002, Phys. Rev. D, 66, 063508
- Hawkins et al. (2003) Hawkins, E., Maddox, S., Cole, S., Lahav, O., Madgwick, D.S., Norberg, P., Peacock, J.A., Baldry, I.K., et al. 2003, MNRAS, 346, 78
- Hicks et al. (2002) Hicks, A.K., Wise, M.W., Houck, J.C., Canizares, C.R., 2002, ApJ, 580, 573
- Kneib et al. (2003) Kneib, J.-P., Hudelot, P., Ellis, R.S., Treu, T., Smith, G.P., Marshall, P., Czoske, O., Smail, I., Natarajan, P., 2003, ApJ, 598, 804
- Knop et al. (2003) Knop, R.A., Aldering, G., Amanullah, R., Astier, P., Blanc, G., Burns, M.S., Conley, A., Deustua, S.E., et al. 2003, ApJ, 598, 102
- Link and Pierce (1998) Link, R., & Pierce, M.J., 1998, ApJ, 502, 63
- Lombardi and Bertin (1998) Lombardi, M., & Bertin, G., 1999, A&A, 342, 337
- Maor et al. (2001) Maor, I., Brustein, R., & Steinhardt, P.J., 2001, Phys. Rev. Lett., 86, 6.
- Machacek et al. (2002) Machacek, M. E., Bautz, M. W., Canizares, C., & Carmire, G. P., 2002, ApJ, 567, 188
- Makino et al. (1998) Makino, N., Sasaki,S., Suto, Y., 1998, ApJ, 449, 18
- Melchiorri et al. (2003) Melchiorri, A., Mersini, L., Ödman, C.J., Trodden, M., 2003, Phys. Rev. D, 68, 043509
- Meneghetti et al. (2004) Meneghetti, M., Bartelmann, M., Dolag, K., Moscardini, L., Perrotta, F., Baccigalupi, C., Tormen, G., astro-ph/0405070
- Molikawa et al. (1999) Molikawa, K., Hattori, M., Kneib, J.P., Yamashita, K., 1999, A&A, 351, 413
- Mohr et al. (1995) Mohr, J.J., Evrard, A.E., Fabricant, D.G., Geller, M.J, 1995, ApJ, 447, 8
- Mohr et al. (1999) Mohr, J.J., Mathiesen, B., Evrard, A.E., 1999, ApJ, 517, 627
- Navarro et al. (1995) Navarro, J.F., Frenk, C.S., White, S.D.M., 1995, MNRAS, 275, 720.
- Ono et al. (1999) Ono, T., Masai, K., Sasaki, S., 1999, PASJ, 51, 91
- Ota et al. (2004) Ota, N., Pointecouteau, E., Hattori, M., Mitsuda, K., 2004, ApJ 601, 120
- Paczyński and Gorski (1981) Paczyński, B., & Gorski, K., 1981, ApJ, 248, L101
- Ratra and Peebles (1998) Ratra, B., & Peebles, P.J., 1998, Phys. Rev. D 37, 3406
- Rubano and Scudellaro (2002) Rubano, C., & Scudellaro, P., 2002, Gen. Rel. Grav., 34, 307
- Sand et al. (2002) Sand, D.J., Treu, T., Ellis, R.S., 2002, ApJ, 574, L129
- Schmidt et al. (2001) Schmidt, R. W., Allen, S. W., & Fabian, A. C. 2001, MNRAS, 327, 1057
- Schmidt et al. (2004) Schmidt, R. W., Allen, S. W., & Fabian, A. C. 2004, astro-ph/0405374
- Schneider et al. (1992) Schneider, P., Ehlers, J., & Falco, E.E., 1992, Gravitational Lenses, Springer-Verlag, Berlin
- Schuecker et al. (2003) Schuecker, P., Caldwell, R.R., Böhringer, H., Collins, C.A., Guzzo, L., Weinberg, N.N, 2003, A&A, 402, 53
- Sereno (2002) Sereno, M., 2002, A&A, 393, 757; astro-ph/0209210
- Sereno (2003) Sereno, M., 2003, A&A, 412, 341; astro-ph/0309591
- Sereno et al. (2001) Sereno, M., Covone, G., Piedipalumbo, E., de Ritis, R., 2001, MNRAS, 327, 517
- Sereno et al. (2002) Sereno, M., Piedipalumbo, E., & Sazhin, M.V., 2002, MNRAS, 335, 1061; astro-ph/0209181
- Smith et al. (2003) Smith, G.P., Edge, A.C., Eke, V.R., Nichol, R.C., Smail, I., Kneib, J.-P., 2003, ApJ, 590, 79
- Spergel et al. (2003) Spergel, D.N., Verde, L., Peiris, H.V., Komatsu, E., Nolta, M.R., Bennett, C.L., Halpern, M., Hinshaw, G., Jarosik, N., Kogut, A., et al., 2003, ApJS, 148, 175
- Tonry et al. (2003) Tonry, J.L., Schmidt, B.P., Barris, B., Candia, P., Challis, P., Clocchiatti, A., Coil, A.L., Filippenko, A.V. et al., 2003, ApJ, 594, 1
- Turner and White (1997) Turner, M.S., & White, M., 1997, Phys. Rev. D, 56, 4439
- Wang et al. (2000) Wang, L., Caldwell, R.R., Ostriker, J.P., & Steinhardt P.J., 2000, ApJ, 530, 17
- Wu (2000) Wu, X.-P., 2000, MNRAS, 316, 299
- Xue and Wu (2002) Xue, S.-J., Wu, X.-P., 2002, ApJ, 576, 152
- Zhu and Fujimoto (2003) Zhu, Z-H., Fujimoto, M-K., 2003, ApJ, in press; astro-ph/0312022
- Zhu et al. (2004) Zhu, Z-H., Fujimoto, M-K., He, X.-T., 2004, A&A, 417, 833
- Zwicky (1933) Zwicky, F., 1933, Helv. Phys. Acta, 6, 110