Molecular Line Observations of Carbon-Chain-Producing Regions L1495B and L1521B
Abstract
We present the first comprehensive study on physical and chemical properties of quiescent starless cores L1495B and L1521B, which are known to be rich in carbon-chain molecules like the cyanopolyyne peak of TMC-1 and L1521E. We have detected radio spectral lines of various carbon-chain molecules such as CCS, C3S, C4H, HC3N, and HC5N. On the other hand, the NH3 lines are weak and the N2H+ lines are not detected. According to our mapping observations of the HC3N, CCS, and C3S lines, the dense cores in L1495B and L1521B are compact with the radius of 0.063 and 0.044 pc, respectively, and have a simple elliptical structure. The distributions of CCS seem to be different from those of well-studied starless cores, L1498 and L1544, where the distribution of CCS shows a shell-like structure. Since the H13CO+, HN13C, and C34S lines are detected in L1495B and L1521B, the densities of these cores are high enough to excite the NH3 and N2H+ lines. Therefore, the abundances of NH3 and N2H+ relative to carbon-chain molecules are apparently deficient, as observed in L1521E. We found that longer carbon-chain molecules such as HC5N and C4H are more abundant in TMC-1 than L1495B and L1521B, while those of sulfur-bearing molecules such as C34S, CCS, and C3S are comparable. Both distributions and abundances of the observed molecules of L1495B and L1521B are quite similar to those of L1521E, strongly suggesting that L1495B and L1521B is in a very early stage of physical and chemical evolution.
1 Introduction
It has been well established that dense cores in dark clouds are formation sites of low-mass stars. Because dense cores have low kinetic temperature (10 K) and high H2 density ( cm-3), they have been observed mainly with molecular lines in radio wavelength. Among a number of observational studies, the most systematic and extensive survey observations of NH3 by Myers and his collaborators have greatly contributed to understanding of the physical property of dark cloud cores (e.g. Benson & Myers 1989). They found that 68 % of the dense cores observed by the NH3 lines accompany the IRAS sources, which are newly born stars in the cores (Benson & Myers 1989; Beichman et al. 1986). Therefore, it has been recognized that the NH3 lines are useful to study the physical properties of star forming dense cores in dark clouds.
On the other hand, Suzuki et al. (1992) pointed out that NH3 is not always a good tracer of dense cores because of the chemical abundance variation from core to core. They carried out survey observations of CCS, HC3N, HC5N, and NH3 toward 49 dense cores and found that the spectra of carbon-chain molecules tend to be intense in starless cores, while those of NH3 tend to be intense in star forming cores. Especially, Suzuki et al. (1992) identified a few cores called ”carbon-chain-producing regions”, where the lines of carbon-chain molecules are intense while the NH3 lines are hardly detected. They are L1495B, L1521B, L1521E, and the cyanopolyyne peak of TMC-1. Recently, Hirota, Ikeda, & Yamamoto (2001, 2003) reported that deuterium fractionation ratios of DNC/HNC and DCO+/HCO+ are significantly lower in carbon-chain-producing regions than in the others. These systematic abundance variations would reflect the difference in chemical evolutionary stages of the cores; carbon-chain molecules and NH3 are abundant in relatively early and late stages, respectively (Suzuki et al. 1992) and deuterium fractionation ratios increase as the core evolves (Hirota et al. 2001; Saito et al. 2000; Saito et al. 2002).
Although detailed studies on carbon-chain-producing regions, which cannot be traced by the NH3 lines, are essential for understanding of chemical and physical evolution of dense cores (Suzuki et al. 1992), no systematic study has been carried out for a long time, except for TMC-1 (e.g. Olano, Walmsley, & Wilson 1988; Hirahara et al. 1992; Pratap et al. 1997). In order to investigate the basic physical and chemical properties, we carried out detailed observations of a representative carbon-chain-producing region, L1521E, with various molecular lines (Hirota, Ito, & Yamamoto 2002). The important results obtained there are as follows; (1) there exists a compact dense core traced by the H13CO+, HN13C, CCS, and HC3N lines, and their distributions have a single peak at the same position; (2) the distribution of CCS in L1521E is different from those in well-studied starless cores, L1498 and L1544, where the distribution of CCS shows a shell-like structure; (3) although the H2 density is as high as (1.3-5.6)105 cm-3 at the center of L1521E, the inversion lines of NH3 are found to be very faint in L1521E, indicating the low NH3 abundance; (4) abundances of carbon-chain molecules in L1521E are systematically higher than those in the other dark cloud cores, and especially the abundances of sulfur-bearing carbon-chain molecules CnS are comparable to those in cyanopolyyne peak of TMC-1. According to these results along with a fact that there exist neither IRAS point sources, evidence of molecular outflow, nor signature of infall motion, we suggested that L1521E would be in a very early stage of physical and chemical evolution (Hirota et al. 2002). Very recently, detailed chemical model calculations (Aikawa, Ohashi, & Herbst 2003) and molecular line and millimeter continuum observations (Tafalla & Santiago 2004) also confirmed our results.
The carbon-chain-producing regions would be chemically and dynamically less evolved than other dark cloud cores, and are rare objects. In fact, only 4 such sources have been recognized (Suzuki et al. 1992). Therefore, it is important to carry out detailed studies on the other carbon-chain-producing regions in order to understand general properties of dense cores in a very early stage of chemical and dynamical evolution. Although L1521B has been observed and detected in previous molecular line surveys (NH3 for Benson & Myers 1989; HC5N for Benson & Myers 1983; CCS for Ohashi 2000; H13CO+ Onishi et al. 2002), L1495B was not detected in such survey observations except for Suzuki et al. (1992) and Hirota et al. (1998; 2001). In this paper, we report observations of L1495B and L1521B with various molecular lines.
2 Observations
The observed lines are summarized in Table Molecular Line Observations of Carbon-Chain-Producing Regions L1495B and L1521B. We took the reference position of L1495B to be , 39′39″. Note that this reference position is taken to be 1′ north of that in the previous papers (e.g. Myers, Linke, & Benson 1983; Suzuki et al. 1992). We took the reference position of L1521B to be , 30′00″, which is the same as most of previous papers (e.g. Myers et al. 1983; Suzuki et al. 1992).
The 42-45 GHz and 93 GHz lines were observed with the 45 m radio telescope at Nobeyama Radio Observatory (NRO)111Nobeyama Radio Observatory is a branch of the National Astronomical Observatory of Japan, an interuniversity research institute operated by the Ministry of Education, Science, Sports and Culture of Japan in several observing sessions from 1990 to 1999. All of them were observed with SIS mixer receivers whose system temperatures were 200-500 K. The main-beam efficiencies () were 0.7 and 0.5 for the 42-45 GHz and 93 GHz regions, respectively, and the beam sizes were 37″ and 17″ for the 42-45 GHz and 93 GHz regions, respectively. Acousto-optical radio spectrometers with the frequency resolution of 37 kHz were used for the backend. Pointing was checked by observing a nearby SiO maser source, NML-Tau, every 1-2 hours, and the pointing accuracy was estimated to be better than 5″. All the observations were performed with the position-switching mode, in which a typical off position was 10′ away from the source position. In the mapping observations of HC3N and CCS, the spectra were usually observed with a grid spacing of 60″. The spectra were taken with a finer grid spacing of 30″ toward the central part of the cores.
The 19-23 GHz lines were observed with the Effelsberg 100 m radio telescope of Max-Planck-Institut für Radioastronomie in 2000 May. We used cooled HEMT receivers, whose system temperatures were about 30 K. The digital autocorrelators with the frequency resolution of 10 kHz were used for the backend. For pointing and intensity calibrations, we observed 3C123 every 1-2 hours. We adopted a flux density of 3C123 to be 3.12 Jy at 23780 MHz (Ott et al. 1994). Observations were carried out with the frequency switching mode, in which the offset frequency was set to be 0.2 MHz. In the mapping observations of C3S, the grid spacing is taken to be 40″.
3 Results and Discussions
3.1 Mapping Observations of L1495B and L1521B
Figures 1 and 2 show the integrated intensity maps of HC3N, CCS, and C3S toward L1495B and L1521B, respectively. It is clearly found that there exists a compact dense core traced by these lines, which has a single peak and a simple elliptical shape. For L1495B, the peak position of HC3N and CCS is located at ()=(60″, 0″), whereas the C3S peak is at (80″, 40″). This difference may originate from the difference in grid spacing; the grid spacing are 30″ for HC3N and CCS, and 40″ for C3S. For L1521B, the peak position of HC3N, CCS, and C3S is located at (30″, 0″). This position lies close to the northwest peak position of the H13CO+ core MC 22 observed by Onishi et al. (2002). The simple elliptical distribution of CCS in L1521B is also reported by Ohashi (2000), in which they observed the line of CCS in the 33 GHz band with the BIMA array.
The single peak distribution of CCS observed in L1495B and L1521B, as well as L1521E (Hirota et al. 2002), is not a usual feature in starless cores. For L1498 (Kuiper, Langer, & Velusamy 1996), L1544 (Ohashi et al. 1999; Benson & Myers 1989), and several other cores (Ohashi 2000; Lai & Crutcher 2000), the distribution of CCS shows a shell-like structure, while that of NH3 is concentrated at the central position (e.g. Tafalla et al. 2002). Such distributions can be interpreted qualitatively in terms of the chemical evolution; CCS tends to be deficient at the center of chemically evolved cores, whereas NH3 becomes abundant there (Suzuki et al. 1992; Bergin & Langer 1997; Aikawa et al. 2003). In contrast to L1498 and L1544, CCS is not deficient at the center of the core in L1495B, L1521B, and L1521E.
Assuming that the distance to the Taurus Molecular Cloud is 140 pc (Elias 1978), the core radius is derived to be 0.063 pc and 0.044 pc for L1495B and L1521B, respectively, from two dimensional Gaussian fitting of the integrated intensity map of CCS. The core radius of L1521B is comparable to that derived from the H13CO+ map, 0.054 pc (Onishi et al. 2002). These size are comparable to those of typical starless NH3 cores (0.120.06 pc in diameter; Benson & Myers 1989), starless N2H+ cores (0.050.02 in radius; Caselli et al. 2002), and H13CO+ cores in the Taurus Molecular Cloud (0.0480.023 pc in radius; Onishi et al. 2002), while they are 1.5-2 times larger than that of another carbon-chain-producing region L1521E, 0.031 pc (Hirota et al. 2002).
The total mass of a core, , is derived by the following equation;
| (1) |
where and H are the core radius in pc and the peak H2 density in cm-3, respectively. Here we assume that the cores are homogeneous spheres with constant density. Because the density profile is not uniform in starless cores, (e.g. Ward-Thompson et al. 1999; Evans et al. 2001; Tafalla et al. 2002, 2004), the mass presented here would be overestimated. The peak H2 density in L1521B is derived to be 1.9105 cm-3 and (6-7)104 cm-3 from multi-transition observations of C34S (Hirota et al. 1998) and CCS (Suzuki et al. 1992), respectively. If we assume the radius of 0.044 pc and the H2 density of 7104 cm-3, the total mass of L1521B is calculated to be 1.4. If the radius of 0.054 pc and the H2 density of 1.9105 cm-3 are assumed, the total mass is estimated to be 7.2. Thus the mass of L1521B ranges from 1.4 to 7.2, being comparable to that reported by Onishi et al. (2002), 5.9.
The total mass of L1495B is derived to be 4.2, assuming the radius of 0.063 pc and the H2 density of 7104 cm-3. Although the uncertainty in the total mass of L1495B and L1521B is estimated to be a factor of 3, they are comparable to that of L1521E, 2.4 (Hirota et al. 2002), and correspond to the lower end of the mass of starless NH3 cores, 1630 (Benson & Myers 1989). The average value of the mass of starless N2H+ cores found by Caselli et al. (2002) is 3, similar to those found for L1495B and L1521B.
The virial mass of a core, , is derived by the following equation;
| (2) | |||||
| (3) |
where is the observed linewidth in km s-1, is the velocity resolution of the spectrometer in km s-1, is the total linewidth of the molecule of mean mass including both nonthermal and thermal motion in the kinetic temperature of 10 K, is the mean mass of molecules in atomic mass unit, 2.33 amu, and is the mass of the observed molecules in atomic mass unit. The total linewidths derived from the CCS lines are 0.48 km s-1 and 0.54 km s-1 for L1495B and L1521B, respectively, and hence, the virial masses are estimated to be 3.0 and 2.7, respectively. If we adopt the linewidths derived from the H13CO+ lines, the total linewidths are 0.62 km s-1 and 0.69 km s-1 for L1495B and L1521B, respectively, and the virial masses are estimated to be 5.0 and 4.4, respectively.
Although both the total mass and the virial mass contain large uncertainty of typically a factor of 3, L1495B and L1521B are not likely to be unstable against collapse, but rather in virial equilibrium. It is consistent with the fact that evidences of infalling motions (Lee, Myers, & Tafalla 1999) have never been reported for L1521B, suggesting at least L1521B is not in a dynamically collapsing phase. The IRAS point sources are not associated with L1495B and L1521B, and molecular outflows have never been reported for L1495B and L1521B. Hence, star formation activities have not yet started in L1495B and L1521B. These facts suggest that the L1495B and L1521B cores are in the early stage of dynamical evolution. However, the detailed physical properties of L1495B and L1521B should be further investigated with other well-studied high density tracers such as the C18O and H13CO+ lines (Myers et al. 1983; Onishi et al. 2002) and submillimeter continuum emission in order to compare the dynamical evolutionary stages of L1495B and L1521B with those of other dark cloud cores (e.g. Tafalla & Santiago 2004; Tafalla et al. 2002, 2004). In the present observations, we could not find significant velocity gradient across the cores nor significant variation of linewidths within the cores which are observed in several more evolved starless cores (e.g. Caselli et al. 2002; Tafalla et al. 2004), partly because of insufficient spectral resolution of our observations. On the other hand, linewidths of the H13CO+ lines in L1495B and L1521B are comparable to those found in more evolved starless cores such as L1521F (Onishi et al. 2002). Further observations with high spectral resolution would be necessary for detailed understandings of velocity structures of L1495B and L1521B.
3.2 Molecular Abundances of L1495B and L1521B
The top frame of Figure 3 shows the spectra of H13CO+(=1-0) observed toward the reference positions of L1495B and L1521B. The peak brightness temperature of the H13CO+ line is similar to those observed toward other H13CO+ cores (Onishi et al. 2002). Although we did not carry out statistical equilibrium calculations to evaluate the H2 density because of the lack of multi-transition observations, detection of the H13CO+ (=1-0) line is an evidence of dense core with the H2 density of an order of 105 cm-3. In fact, the H2 density derived from the C34S data in L1521B is 1.9105 cm-3 (Hirota et al. 1998).
Although the H2 density is high enough to excite the inversion line of NH3(=1,1), it is found to be faint toward the reference position of L1495B and L1521B, as shown in Figure 4. According to the survey of the NH3 lines by Benson & Myers (1989) and Suzuki et al. (1992), the NH3 line was not detected toward L1495B. For L1521B, the NH3 line was detected with the brightness temperature of 0.48 K (Benson & Myers 1989) and 0.36 K (Suzuki et al. 1992). Owing to our higher sensitivity observations with higher spatial resolution, the observed brightness temperature of the NH3 lines, 0.49 K and 0.94 K for L1495B and L1521B, respectively, are higher by a factor of 2 or more than those reported by Benson & Myers (1989) and Suzuki et al. (1992). Even with this results, the brightness temperature of the NH3 lines toward L1495B and L1521B fall within the range of the criterion of ”moderate” detection by the survey of Benson & Myers (1989), 1.4 K 3. This result indicates that abundances of NH3 are quite low at least in the peak position of dense cores in L1495B and L1521B traced by the HC3N, CCS, and C3S lines. Such characteristics are similar to those in another carbon-chain-producing region L1521E (Hirota et al. 2002).
Figure 3 shows the spectra of carbon-chain molecules observed toward L1495B and L1521B. The observed position is the reference position except for C3S and C4H toward L1495B, which are observed at the C3S peak. In addition to the intense spectra of CCS and HC3N, the longer carbon-chain molecules such as C3S, C4H, and HC5N were also detected toward both L1495B and L1521B, indicating that L1495B and L1521B are rich in carbon-chain-molecules. In order to evaluate abundances of observed molecules, the line parameters for all the observed lines were determined by the Gaussian fit, as summarized in Table Molecular Line Observations of Carbon-Chain-Producing Regions L1495B and L1521B. We ignored the unresolved hyperfine structures of the NH3 and HC3N lines, and hence, their linewidths are broader than the others.
We calculated the column densities of observed molecules by the consistent way employed in Hirota et al. (2002) in order to compare the present results with those for L1521E and TMC-1. Details of our method are described in Hirota et al. (2002). We assumed that the excitation temperatures of 6.5 K for NH3, HC3N, and HC5N, 6.0 K for C4H, and 5.5 K for C3S. For NH3, all the ortho and para levels were assumed to be thermalized at the kinetic temperature of 10 K. The upper limit of the column density of N2H+ is calculated by assuming the excitation temperature of 5.0 K (Benson, Caselli, & Myers 1998) and the FWHM linewidth of 0.5 km s-1. The derived column densities are summarized in Table Molecular Line Observations of Carbon-Chain-Producing Regions L1495B and L1521B along with those of several molecules reported previously.
For L1521B, the column densities of C3S, HC5N, and NH3 are reported by Suzuki et al. (1992) at the same position. The column densities of C3S and NH3 obtained by our observations are factor of 2 larger than those of Suzuki et al. (1992), possibly because we observed the C3S and NH3 lines with a finer beam size and our results are less affected by the beam dilution effect. For the HC5N line, we observed the =16-15 line while Suzuki et al. (1992) observed the =17-16 line with the same telescope and a similar beam size. The column density of HC5N obtained in the present study is 1.21013 cm-2, which well agrees to that reported by Suzuki et al. (1992), 1.171013 cm-2.
For L1495B, two hyperfine components of the =2-1 transition of C4H (=3-2 and 2-1) are detected. The intensity ratio of / is 1.320.54, agrees to the intensity ratio in the optically thin case (Guélin, Friberg, & Mezaoui 1982). Therefore, we calculated column density of C4H using one of the =3-2 and =2-1 data. Assuming the same excitation temperature of 6.0 K as adopted in the analysis of L1521E (Hirota et al. 2002) and L1521B, the total optical depth of the C4H lines are derived to be 0.47 and 0.51 from the =3-2 and =2-1 data, respectively, and the column density of C4H are derived to be 1.51014 cm-2 and 2.11014 cm-2 from the =3-2 and =2-1 data, respectively. Therefore, we adopted the average value derived from the =3-2 and =2-1 data, 1.821014 cm-2 as the final value.
The column densities of the carbon-chain molecules in L1495B and L1521B are significantly higher than those in typical dark cloud cores (Benson & Myers 1983; Fuente et al. 1990; Suzuki et al. 1992), whereas the column densities of NH3 and N2H+ in L1495B and L1521B are lower by a factor of 5-10 (Benson & Myers 1989; Suzuki et al. 1992; Benson et al. 1998; Caselli et al. 2002). The NH3/CCS ratios in carbon-chain-producing regions, ranging from 2.6 (L1521E) to 3.8 (L1495B), are lower by a factor of 10 or more than those in other dark cloud cores (e.g. Figure 7 of Ohishi & Kaifu 1998, Figure 10 of Hirota et al. 2001). The abundances of the carbon-chain-molecules relative to NH3 and N2H+ are systematically higher in L1495B and L1521B than those in typical dark cloud cores.
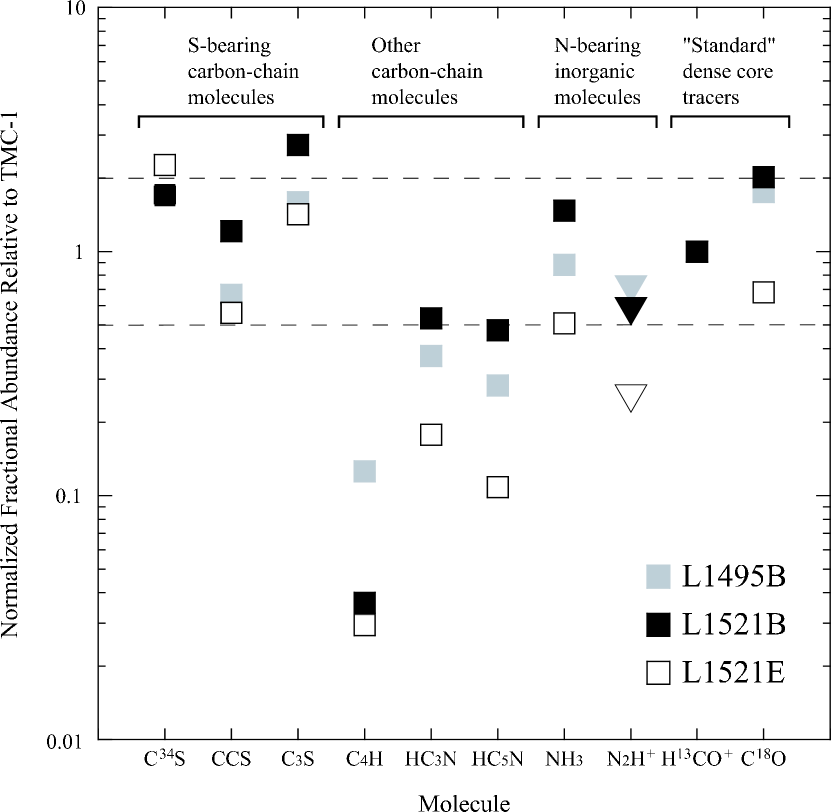
In order to illustrate how the molecular abundances are different among carbon-chain-producing regions, we show the fractional abundances of selected molecules relative to the TMC-1 abundances (”normalized” fractional abundances) in Figure 5. Because the volume of gas traced by CO and its isotopes are not always the same as those of other molecules due to their low critical density, we compared the molecular abundances relative to H13CO+ in this paper, following the discussions of TMC-1 by Pratap et al. (1997) and of L1521E by Hirota et al. (2002). Aikawa et al. (2003) recently reported chemical model calculations describing that column density of HCO+ does not show temporal variation unless the H2 density is less than 105 cm-3, and hence, it is useful as a ”standard” dense core tracer. For example, the normalized fractional abundance of CCS in L1495B relative to that in TMC-1, (CCS), is defined as follows;
| (4) |
According to the systematic abundance variation of molecular species in L1521E (Hirota et al. 2002), we classified 4 groups of molecular species in Figure 5; (1) sulfur-bearing carbon-chain molecules, C34S, CCS, and C3S, which are systematically higher in L1521E than TMC-1, (2) other carbon-chain molecules, C4H, HC3N, and HC5N, which are systematically lower in L1521E than TMC-1, (3) nitrogen-bearing inorganic molecules, NH3 and N2H+, and (4) ”standard” dense core tracers, H13CO+ and C18O.
As observed in L1521E, fractional abundances of sulfur-bearing carbon-chain molecules are comparable to or higher in L1495B, L1521B, and L1521E than in TMC-1, while those of the other carbon-chain molecules are systematically lower by a factor of 2-30 in all the 3 carbon-chain-producing regions than in TMC-1. On the other hand, the abundances of NH3 and C18O in all the 3 carbon-chain-producing regions are almost the same as TMC-1. Although the abundances of N2H+ are derived only with 3 upper limit, they seem to be systematically lower in all 3 carbon-chain-producing regions than in TMC-1. Therefore, chemical compositions of L1495B and L1521B are quite similar to that of L1521E (Hirota et al. 2002).
According to a simple gas-phase pseudo-time dependent chemical model (e.g. Suzuki et al. 1992), CCS and carbon-chain molecules are abundant only in the early evolutionary stage of dark cloud cores. This is because CCS and carbon-chain molecules are efficiently produced when the C+ ions and the C atoms are abundant while they are deficient when the C atoms are locked into CO. In addition, the CCS molecules freeze-out onto grains as the core density increases because sulfur-bearing species are tightly bound in grain mantles (Bergin & Langer 1997). Therefore, we can conclude that L1495B, L1521B, and L1521E are in almost the same chemical evolutionary stage, and would be in the earliest phase of chemical evolution. On the other hand, Ruffle et al. (1997) presented completely different chemical model calculations suggesting that abundances of cyanopolyynes may increase at the late time where molecules freeze-out onto dust grains. However, it is well known both theoretically and observationally that the freeze-out of CO boosts the production rate of NH3 and N2H+ (Bergin & Langer 1997; Aikawa et al. 2003; Tafalla et al. 2002, 2004). This is not consistent with our observational result that the abundances of NH3 and N2H+ in these three cores are lower than in other dark cloud cores. In addition, the freeze-out of CO makes the lifetime of H2D+ longer, and hence, deuterium fractionation ratios such as DCO+/HCO+ ratios are expected to be enhanced through the deuteron transfer reaction from H2D+ followed by the electron recombination reaction (Saito et al. 2002; Aikawa et al. 2003). Again, this is not consistent with the low DCO+/H13CO+ ratios observed in L1495B, L1521B, and L1521E (Hirota et al. 2001). From these considerations, it is likely that freeze-out of CO and other molecules onto dust grain are not efficient in these two cores as observed by Tafalla & Santiago (2004).
It will be interesting to compare typical time scales for dynamical and chemical evolution. The timescale for gas-phase chemical reactions is roughly estimated to be 105 yr for an H2 density of 105 cm-3 and a cosmic ray ionization rate of 10-17 s-1. This timescale is comparable to the free-fall timescale (105 yr) and the timescale of freeze-out of CO molecules onto dust grain (105 yr). The fact that the freeze-out of molecules is not significant in L1495B and L1521B suggests that these two cores are dynamically young. Therefore, we can conclude that L1495B and L1521B are really in the earliest phase of not only chemical evolution but also physical evolution, as in the case of L1521E (Hirota et al. 2002; Tafalla & Santiago 2004). Although it is difficult to infer the ages of L1495B and L1521B quantitatively, they are likely to be less than 105 yr. Detailed comparison with chemical models including dynamical evolution (e.g. Aikawa et al. 2003) would be interesting.
Recently, Lee et al. (2003) found chemically young but physically evolved core (L1689B) and chemically evolved but physically young core (L1512), pointing out that environmental conditions have to be taken into account when modeling the chemistry and physics of molecular cloud cores. In addition, initial condition of dynamical collapse and timescale of dynamical collapse should be considered in the model of dark cloud cores because these differences would affect the chemical abundance of dark cloud cores (e.g. Aikawa et al. 2003). In order to better outline the physical and chemical properties of L1495B and L1521B, submillimeter continuum observations to map the dust distributions and further detailed molecular line observations (e.g. Ward-Thompson et al. 1999; Tafalla et al. 2002, 2004; Tafalla & Santiago 2004) are needed, which would contribute to the complete understanding of chemical and physical evolution of dark cloud cores.
4 Summary
We carried out mapping and survey observations with several molecular lines toward two known carbon-chain-producing regions in the Taurus Molecular Cloud, L1495B and L1521B. Intense spectra of carbon-chain molecules such as CCS, C3S, C4H, HC3N, and HC5N were detected, while the NH3 lines were weak and the N2H+ lines were not detected. Distributions of HC3N, CCS, and C3S lines in L1495B and L1521B show compact elliptical structure with the radius of 0.063 and 0.044 pc, respectively. The maps of the CCS lines has only single peak position and they seem to be different from those of well-studied starless cores, L1498 and L1544, where the distribution of CCS shows a shell-like structure. Since the H13CO+ lines are detected in L1495B and L1521B, the densities of these cores are higher than 105 cm-3, which is high enough to excite the NH3 and N2H+ lines, indicating that the abundances of NH3 and N2H+ relative to carbon-chain molecules are very low, as observed in L1521E. We found that longer carbon-chain molecules such as HC5N and C4H are more abundant in TMC-1 than L1495B and L1521B, while those of sulfur-bearing molecules such as C34S, CCS, and C3S are comparable.
These characteristic features of molecular abundances in L1495B and L1521B are similar to those of L1521E (Hirota et al. 2002). Therefore, L1495B and L1521B are also in the early stage of chemical evolution, and the depletion factor of heavy atoms are possibly lower than in other evolved cores such as L1544 (e.g. Bergin & Langer 1997; Aikawa et al. 2003). The fact that L1495B, L1521B, and L1521E are found to be the cores with the lowest deuterium fractionation ratio of DNC/HNC and DCO+/HCO+ (Hirota et al. 2001; 2002; 2003) also supports this idea. These carbon-chain-producing regions, L1495B, L1521B, and L1521E, would be the best targets for observational studies on initial conditions for dense core formation and star formation.
References
- aik (03) Aikawa, Y., Ohashi, N., & Herbst, E. 2003, ApJ, 593, 906
- bei (86) Beichman, C. A., Myers, P. C., Emerson, J. P., Harris, S., Mathieu, R., Benson, P. J., & Jennings, R. E. 1986, ApJ, 307, 337
- ben (98) Benson, P. J., Caselli, P., & Myers, P. C. 1998, ApJ, 506, 743
- ben (83) Benson, P. J., & Myers, P. C. 1983, ApJ, 270, 589
- ben (89) Benson, P. J., & Myers, P. C. 1989, ApJS, 71, 89
- ber (97) Bergin, E. A. & Langer, W. D. 1997, ApJ, 486, 316
- cas (02) Caselli, P., Benson, P. J., Myers, P. C., & Tafalla, M. 2002, ApJ, 572, 238
- eli (78) Elias, J. H. 1978, ApJ, 224, 857
- Eva (01) Evans, N. J., II, Rawlings, J. M. C., Shirley, Y., & Mundy, L. G. 2001, ApJ, 557, 193
- (10) Fuente, A., Cernicharo, J., Barcia, A., & Gómez-González, J. 1990, A&A, 231, 151
- gue (82) Guélin, M., Friberg, P., & Mezaoui, A. 1982, A&A, 109, 23
- hir (92) Hirahara, Y., et al. 1992, ApJ, 394, 539
- hir (98) Hirota, T., Yamamoto, S., Mikami, H., & Ohishi, M. 1998, ApJ, 503, 717
- hir (01) Hirota, T., Ikeda, M., & Yamamoto, S. 2001, ApJ, 547, 814
- hir (03) Hirota, T., Ikeda, M., & Yamamoto, S. 2003, ApJ, 594, 859
- hir (02) Hirota, T., Ito, T., & Yamamoto, S. 2002, ApJ, 565, 359
- kui (96) Kuiper, T. B. H., Langer, W. D., & Velusamy, T. 1996, ApJ, 468, 761
- lai (00) Lai, S. -P. & Crutcher, R. M. 2000, ApJS, 128, 271
- lee (99) Lee, C. W., Myers, P. C., & Tafalla, M. 1999, ApJ, 526, 788
- lee (03) Lee, J.-E., Evans N. J., II, Shirley, Y. L., and Tatematsu, K. 2003, ApJ, 583, 789
- mye (83) Myers, P. C., Linke, R. A., & Benson, P. J. 1983, ApJ, 264, 517
- oha (99) Ohashi, N., Lee, S. W., Wilner, D. J., & Hayashi, M. 1999, ApJ, 518, L41
- oha (00) Ohashi, N. 2000, in IAU Symp. 197, Astrochemistry: From Molecular Clouds to Planetary Systems, ed. Y. C. Minh & E. F. van Dishoeck (San Francisco: ASP), 61
- ohi (98) Ohishi, M. & Kaifu, N. 1998, in Faraday Discussions 109, Chemistry and Physics of Molecules and Grains in Space, 205
- ola (88) Olano, C. A., Walmsley, C. M., & Wilson, T. L. 1988, A&A, 196, 194
- oni (02) Onishi, T., Mizuno, A., Kawamura, A., Tachihara, K., & Fukui, Y. 2002, ApJ, 575, 950
- ott (94) Ott, M., Witzel, A., Quirrenbach, A., Krichbaum, T. P., Standke, K. J., Schalinski, C. J., & Hummel, C. A. 1994, A&A, 284, 331
- pra (97) Pratap, P., Dickens, J. E., Snell, R. L., Miralles, M. P., Bergin, E. A., Irvine, W. M., & Schloerb, F. P. 1997, ApJ, 486, 862
- ruf (97) Ruffle, D. P., Hartquist, T. W., Taylor, S. D., & Williams, D. A. 1997, MNRAS, 291, 235
- sai (00) Saito, S., Ozeki, H., Ohishi, M., & Yamamoto, S. 2000, ApJ, 535, 227
- sai (02) Saito, S., Aikawa, Y., Herbst, E., Ohishi, M., Hirota, T., Yamamoto, S., & Kaifu, N. 2002, ApJ, 569, 836
- suz (92) Suzuki, H., Yamamoto, S., Ohishi, M., Kaifu, N., Ishikawa, S., Hirahara, Y., & Takano, S. 1992, ApJ, 392, 551
- taf (04) Tafalla, M. & Santiago, J. 2004, A&A, 414, L53
- taf (02) Tafalla, M., Myers, P. C., Caselli, P., Walmsley, C. M., & Comito, C. 2002, ApJ, 569, 815
- (35) Tafalla, M., Myers, P. C., Caselli, P., & Walmsley, C. M. 2004, A&A, 416, 191
- war (99) Ward-Thompson, D., Motte, F., & André, P. 1999, MNRAS, 305, 143


| bbfootnotemark: | (km s-1) | |||||||||
|---|---|---|---|---|---|---|---|---|---|---|
| Source | Transition | (MHz) | aafootnotemark: | (Debye) | Telescope | (K) | (km s-1) | (km s-1) | (K) | Reference |
| L1495Bccfootnotemark: | C4H(=2-1,=-,=2-1) | 19014.720 | 2.00 | 0.9 | MPIfR | 0.37 | 7.74 | 0.42 | 0.04 | |
| C4H(=2-1,=-,=3-2) | 19015.144 | 2.00 | 0.9 | MPIfR | 0.49 | 7.73 | 0.33 | 0.04 | ||
| NH3( = 1,1) | 23694.506ddfootnotemark: | 1.50 | 1.47 | MPIfR | 0.49 | 7.88 | 0.62 | 0.15 | ||
| C3S(=4-3) | 23122.985 | 4.00 | 3.6 | MPIfR | 1.29 | 7.59 | 0.24 | 0.11 | ||
| HC5N(=16-15) | 42602.153 | 16.00 | 4.33 | NRO | 0.36 | 7.65 | 0.47 | 0.04 | ||
| CCS(=-) | 45379.033 | 3.97 | 2.81 | NRO | 2.1 | 7.69 | 0.31 | 0.09 | 1 | |
| HC3N(=5-4) | 45490.316ddfootnotemark: | 5.00 | 3.72 | NRO | 2.7 | 7.70 | 0.67 | 0.08 | ||
| H13CO+(=1-0) | 86754.330 | 1.00 | 4.07 | NRO | 0.88 | 7.75 | 0.46 | 0.10 | 2 | |
| N2H+(=1-0) | 93173.777ddfootnotemark: | 3.40 | 1.00 | NRO | 0.20 | |||||
| L1521B | C4H(=2-1,=-,=3-2) | 19014.720 | 2.00 | 0.9 | MPIfR | 0.37 | 6.44 | 0.21 | 0.10 | |
| C4H(=2-1,=-,=2-1) | 19015.144 | 2.00 | 0.9 | MPIfR | 0.10 | |||||
| NH3( = 1,1) | 23694.506ddfootnotemark: | 1.50 | 1.47 | MPIfR | 0.94 | 6.52 | 0.69 | 0.14 | ||
| C3S(=4-3) | 23122.985 | 4.00 | 3.6 | MPIfR | 1.75 | 6.38 | 0.35 | 0.09 | ||
| HC5N(=16-15) | 42602.153 | 16.00 | 4.33 | NRO | 0.87 | 6.44 | 0.43 | 0.06 | ||
| CCS(=-) | 45379.033 | 3.97 | 2.81 | NRO | 2.8 | 6.2 | 0.40 | 0.1 | 3 | |
| HC3N(=5-4) | 45490.316ddfootnotemark: | 5.00 | 3.72 | NRO | 3.3 | 6.2 | 0.80 | 0.1 | 3 | |
| H13CO+(=1-0) | 86754.330 | 1.00 | 4.07 | NRO | 1.14 | 6.57 | 0.56 | 0.10 | 2 | |
| N2H+(=1-0) | 93173.777ddfootnotemark: | 3.40 | 1.00 | NRO | 0.22 |
References. — 1: Hirota et al. (2001), corrected with the main beam efficiency of 0.7; 2: Hirota et al. (2001), corrected with the main beam efficiency of 0.5; 3: Suzuki et al. (1992), corrected with the main beam efficiency of 0.7
| Molecule | L1495Baafootnotemark: | Reference | L1521B | Reference | L1521E | Reference | TMC-1 | Reference |
|---|---|---|---|---|---|---|---|---|
| C34S | 0.56 | 2 | 1.25 | 1 | 0.73 | 1 | ||
| CCS | 1.44 | 3 | 3.6 | 4 | 2.8 | 1 | 6.6 | 1 |
| C3S | 0.68 | 1.6 | 1.4 | 1 | 1.3 | 1 | ||
| C4H | 18.2 | 7.2 | 9.8 | 1 | 440 | 1 | ||
| HC3N | 2.1 | 4.1 | 4 | 2.3 | 1 | 17.1 | 1 | |
| HC5N | 0.52 | 1.2 | 0.46 | 1 | 5.6 | 1 | ||
| NH3 | 5.5 | 12.6 | 7.3 | 1 | 19 | 1 | ||
| N2H+ | 0.17 | 0.19 | 0.14 | 1 | 0.74 | 1 | ||
| H13CO+ | 0.046 | 3 | 0.063 | 3 | 0.106 | 1 | 0.14 | 1 |
| C18O | 190 | 5 | 300 | 5 | 170 | 1 | 330 | 1 |
References. — 1: Hirota et al. (2002) and references therein; 2: Hirota et al. (1998); 3: Hirota et al. (2001); 4: Suzuki et al. (1992); 5: Myers et al. (1983)