The Infrared Sky
Abstract
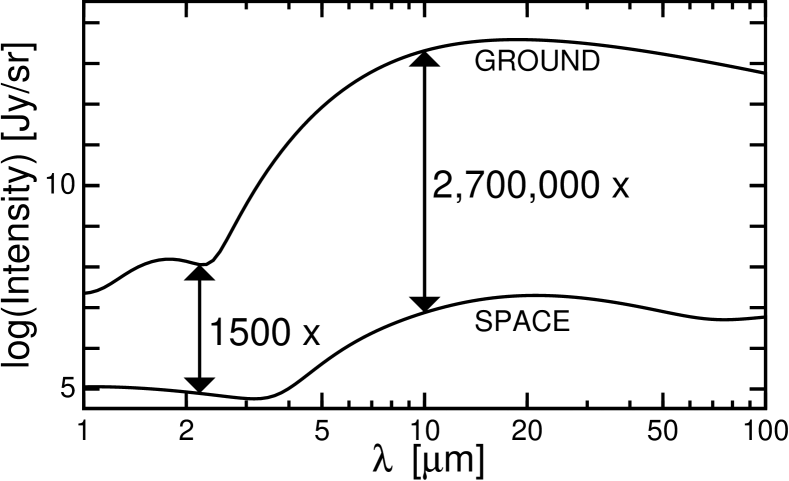
The infrared sky from space is the sum of a cosmic signal from galaxies, quasars, and perhaps more exotic sources; and foregrounds from the Milky Way and from the Solar System. At a distance of 1 AU from the Sun, the foreground from interplanetary dust is very bright between 5 and 100 m, but “very bright” is still several million times fainter than the background produced by ground-based telescopes. In the near infrared 1-2.2 m range the space infrared sky is a thousand times fainter than the OH nightglow from the Earth’s atmosphere. As a result of these advantages, wide-field imaging from space in the infrared can be an incredibly sensitive method to study the Universe.
1 Introduction
The infrared sky on Earth is very bright, leading George Rieke to compare infrared astronomy to observing stars in the daytime with a telescope made out of fluorescent lights. From space the situation is much improved, with the total sky brightness down by three orders of magnitude in the near infrared and more than six orders of magnitude in the thermal infrared. Figure 1 shows the sky brightness on the Earth compared to the sky brightness from space 1 AU from the Sun.
2 The Total Infrared Sky
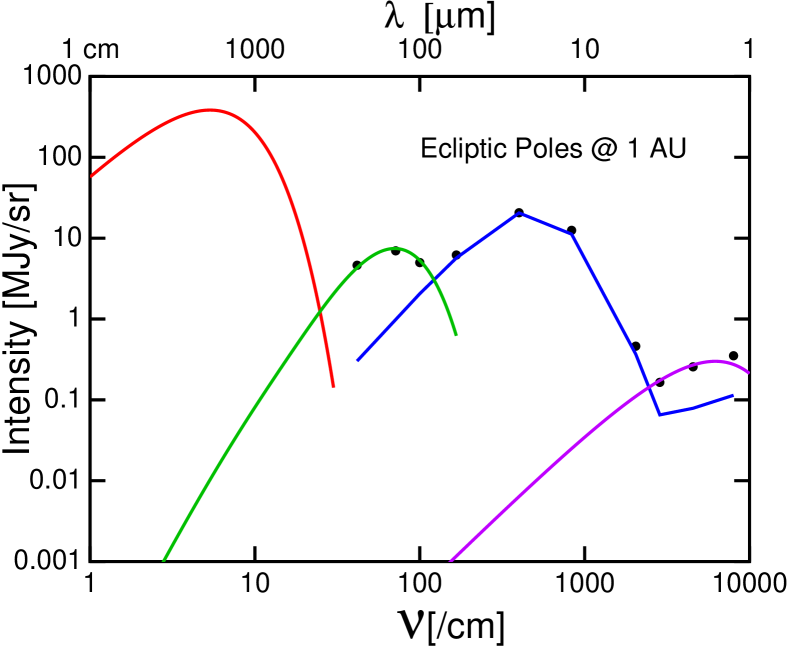
The Diffuse Infrared Background experiment (DIRBE) on the Cosmic Background Explorer made observations of the total intensity of the sky in ten bands from 1.25 to 240 m [1]. The total intensity at the ecliptic poles from DIRBE and FIRAS data is shown in Figure 2. One can clearly see two windows in this foreground emission: one at 200-500 m and another at 3 m. These windows provide an opportunity for extremely sensitive imaging from space. The curves plotted on this graph are the CMB, a 2.725 K blackbody, a scaled version of the FIRAS spectrum of the Milky Way [2],
| (1) |
a model for the interplanetary dust [3], and an estimate for the stellar light in the Milky Way: .
3 Telescope Cooling Requirements
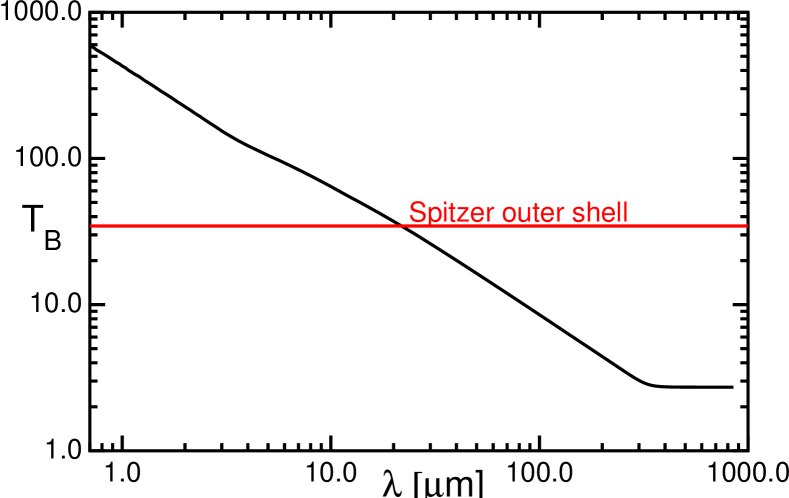
The brightness of the infrared sky defines the maximum temperature a telescope can have without degrading the mission sensitivity. Since optical surfaces normally have rather low emissivities, cooling the optics to the Planck brightness temperature of the infrared sky will lead to minimal degradation of performance. Figure 4 shows this temperature as function of wavelength. Also shown on this plot is the temperature of the outer shell of the Spitzer Space Telescope, which is passively cooled in an environment 1 AU from the Sun but far enough away from the Earth that it is not a significant thermal source. Clearly it is rather easy to use a passively cooled telescope in the 3 m window in the zodiacal foreground.
4 Detector Performance Requirements
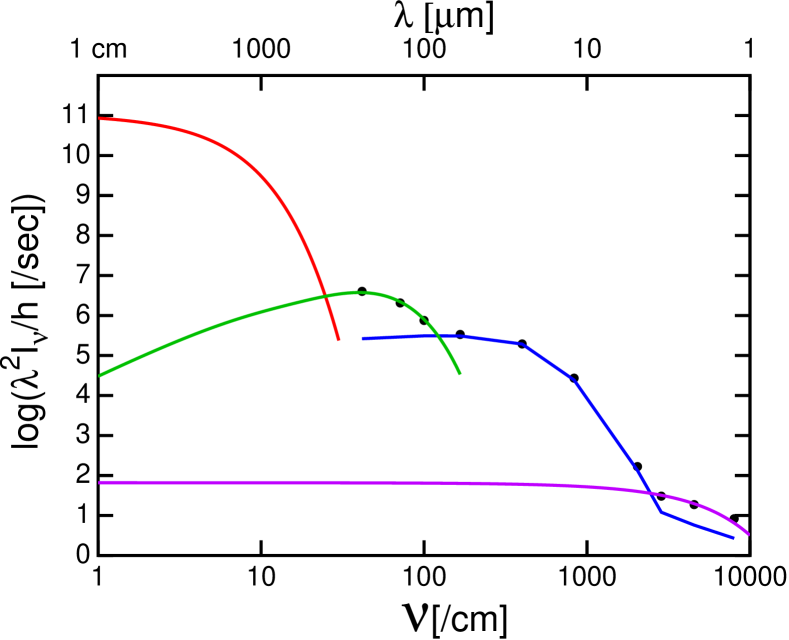
When designing space-based wide-field imaging missions one naturally wants to achieve background-limited sensitivity. Figure 3 show the same data as Figure 2 but in a different representation. Here the y-axis shows the photon rate on a diffraction-limited pixel with 100% transmission and 100% bandwidth. Furthermore one usually oversamples the diffraction-limited point spread function so a pixel in a real experiment will receive only about a few percent of this photon rate. Clearly the dark current requirements for background-limited imaging are well below 1 e/sec in the 3 m window in the zodiacal light, but 10,000 e/sec would be acceptable at 300 m.
A simple order of magnitude estimate shows that the detectors must be much colder than the optics temperature requirement. The photon arrival rate on a unit area in a blackbody is where is . In fact is usually 25-40 for the space-based backgrounds in Figure 4. On the other side of the detector surface one has phonons that can also be detected, and the phonon arrival rate is where is the sound speed and . Here is the minimum energy that can produce a charge carrier in the detector, so clearly has to be less than the observing frequency . Usually corresponds to the cutoff wavelength of the detector but in some cases it can be smaller. Because , one needs to have , and thus the detectors usually need to be 2-3 times colder than the optics. Even so, there is no problem running passively cooled optics and HgCdTe detectors at full natural background-limited sensitivity in the 3 m window through the zodiacal light.
5 JDEM Requirements
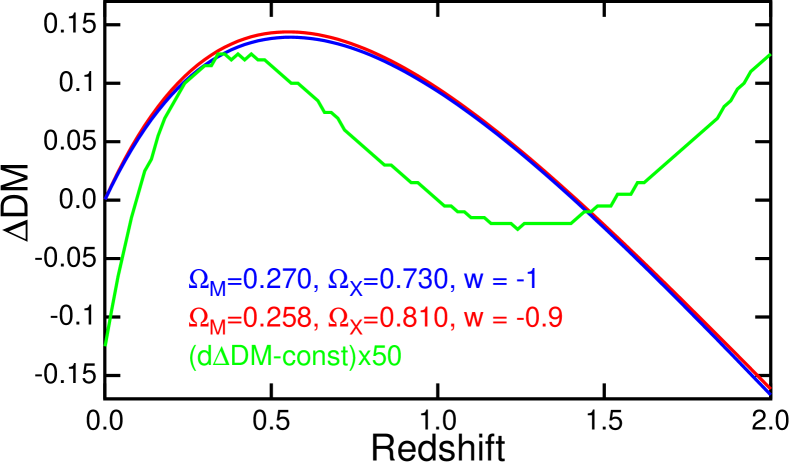
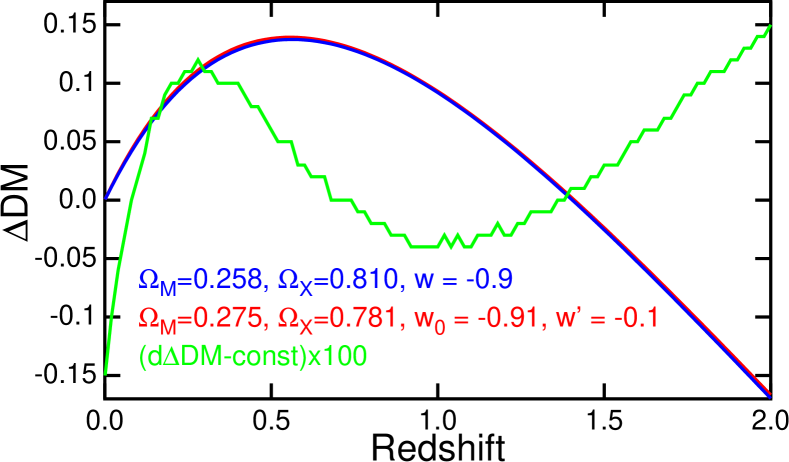
The Joint Dark Energy Mission (JDEM) is supposed to provide data about the dark energy. One convenient but not physically motivated parametrization of the dark energy is in terms of a time varying ratio between the pressure and the density, with where is the scale factor of the Universe [4]. When there should be a dynamical coupling between the dark energy and matter, leading to an inhomogeneous dark energy density, and this is neglected in the simple , model. But the luminosity distance can easily be computed in the , model allowing for quick parameter sensitivity studies. It turns out that the luminosity distance vs. redshift data for supernovae only constrain two directions in the 4 parameter space spanned by , , and . Figure 5 and Figure 6 show that the other two directions are essentially unconstrained by observations of supernova brightness in the redshift range .
All of the calculations that claim that supernova data can determine and have made some poorly justified assumptions. For example, the assumption that the Universe is flat () is often made. But the flatness of the Universe is clearly something that needs to be determined from the data. Often the assumption of a flat Universe is justified on the basis of simplicity, but simplicity also implies that . Or the CMB is cited in justifying the assumption of a flat Universe. But the CMB data does not say the Universe is flat! The CMB data are perfectly happy with a closed , model. Only when combined with the supernova data, and the assumption that , do the CMB data imply a flat Universe. To then turn this around and try to find is clearly circular reasoning.
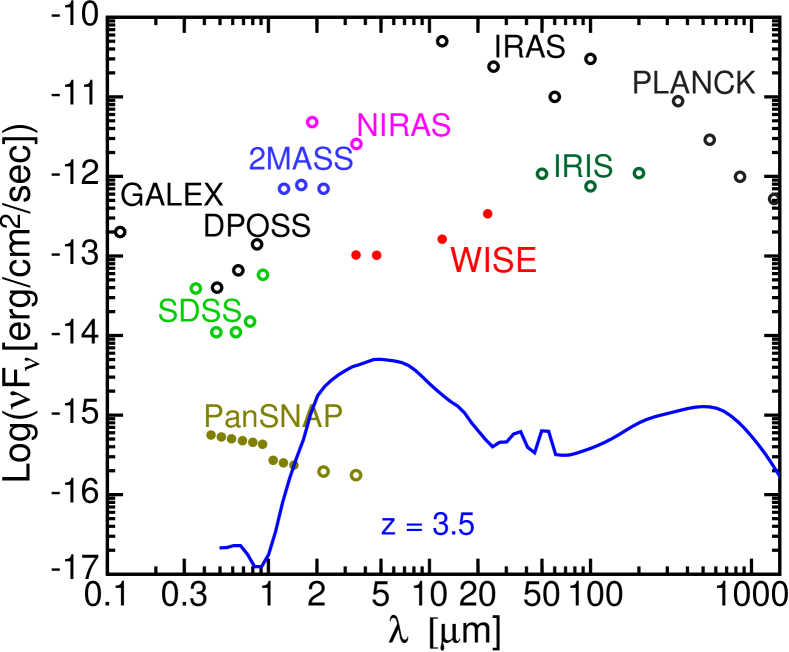
Where then can the additional constraints on , , and be found? The CMB data, in particular the location of the acoustic peaks, provide one independent constraint. And weak lensing surveys offer another constraint by measuring the growth of perturbations as a function of redshift. But weak lensing observations require a very high density of background sources, and thus a high sensitivity to typical galaxies. Typical stars in typical galaxies are much redder than supernovae, and galaxies are redshifted as well, leading to a requirement for longer wavelength observations. Figure 7 shows how the sensitivity of a proposed panoramic survey by SNAP to background galaxies could be increased by a factor of 20 by extending the wavelength coverage out to 3.5 m. Note that I recalculated the plotted sensitivities for all the SNAP bands and generally agree with published estimates [4].
This sensitivity at 3.5 m is two magnitudes fainter than the faintest reported number counts from Spitzer [5]. Since the Spitzer counts exceed per square degree, the counts from a panoramic SNAP survey would be about per square degree if the wavelength coverage of SNAP is extended to 3.5 m.
But this sensitivity at 3.5 m will require rethinking the implementation of JDEM. The Hubble Space Telescope was designed in the 1980’s, without planning for sensitive infrared instruments, and as a result has heated mirrors made out of ULE glass. ULE is not ultra-low expansion except in a narrow range of temperature near room temperature. The recently released Hubble Ultra-Deep Field shows the unfortunate consequences of this decades old decision: even though the NICMOS exposure time per position is only a few percent of the ACS exposure, the NICMOS image clearly goes to higher redshift. And NICMOS cannot even use its 2.2 m capability because of the heated mirrors.
The James Webb Space Telescope [6] will use passively cooled optics and actively cooled detectors to operate in the m range with high sensitivity. The Wide-field Infrared Survey Explorer (WISE) will survey the entire sky with sensitivities better than the requirements shown on Figure 7, and thus provide a sky survey suitable for planning JWST observations.
WISE [8] will have 4 bands at 3.5, 4.7, 12 & 23 m and will be able to detect old, cold brown dwarfs in the Solar neighborhood as well as Ultraluminous Infrared Galaxies at redshifts up to . WISE will be in a nearly polar Sun-synchronous low Earth orbit like IRAS and COBE and will scan a circle perpendicular to the Earth-Sun line once per orbit while looking away from the Earth. After 6 months the precession of the orbit will have swept this scan circle across the entire sky.
WISE will take exposures every 11 seconds with pixel arrays in each of its 4 bands. The 40 cm diameter WISE telescope will scan at a constant rate while an internal scan mirror freezes an image of the sky on the arrays. This scan method is very similar to the method employed by the 2MASS survey.
The current catalogs of stars close to the Sun are surprisingly incomplete. In fact, the third closest star to the Sun was discovered in 2003 with a proper motion of per year [9]! When brown dwarfs are included, it is likely that only one-third of the stars within 5 pc have been identified. Most of the missing objects will be old low mass brown dwarfs with luminosities considerably smaller than the of 2MASS 1415-09 [10]. WISE will be able to detect brown dwarfs down to at the distance of Proxima Cen, and there could be two such objects within the 10 pc3 closer to the Sun than Proxima Cen.
At much greater distances our knowledge of active galactic nuclei, QSOs and ultra-luminous starburst galaxies is also incomplete because these objects are often obscured by tremendous amounts of dust. WISE should be able to detect about galaxies at 23 m and 5-6% of these will have redshifts .
All of these objects that can be found by WISE will be of great interest for followup observations using the JWST. A 2 meter diameter, passively cooled, wide field telescope working in the near infrared would fill a valuable niche between the wide but shallow survey of WISE and the ultra-sensitive but narrow field capability of JWST.
6 Conclusion
The Joint Dark Energy Mission goals require many different kinds of data, not just supernova brightness vs. redshift. A high sensitivity to faint redshifted galaxies will be essential, and in the space environment 1 AU from the Sun the highest sensitivity is obtained at 3 m [7]. Thus JDEM should cover the wavelength range m, and this can easily be achieved using passively cooled optics and detectors.
References
- [1] M. Hauser et al., The COBE Diffuse Infrared Background Experiment Search for the Cosmic Infrared Background. I. Limits and Detections, ApJ, 508 (1998), 25.
- [2] E. L. Wright et al., Preliminary Spectral Observations of the Galaxy with a Beam by the Cosmic Background Explorer (COBE), ApJ, 381 (1991), 200.
- [3] E. L. Wright, Angular Power Spectra of the COBE DIRBE Maps, ApJ, 496 (1996), 1.
- [4] G. Aldering et al., Supernova Acceleration Probe: A Satellite Experiment to Study the Nature of the Dark Energy, PASP, TBD, TBD (astro-ph/0405232).
- [5] G. Fazio et al,, Number Counts at m from the Spitzer Space Telescope, ApJS, TBD, TBD (astro-ph/0405595).
- [6] J. Gardner etal., Science with the James Webb Space Telescope, BAAS, 203rd meeting, paper 124.01
- [7] E. L. Wright, On Using a Space Telescope to Detect Faint Galaxies, PASP, 91 (1985), 451.
- [8] V. Duval, W. Irace, A. Mainzer & E. Wright, The Wide-Field Infrared Survey Explorer (WISE), SPIE, TBD, TBD. E. Wright, P. Eisenhardt & the WISE Science Team, paper 11.03 at the 204th meeting of the AAS.
- [9] B. Teegarden, S. Pravdo, M. Hicks, K. Lawrence, S. Shaklan, K. Covey, O. Fraser, S. Hawley, T. McGlynn % I. Reid, Discovery of a New Nearby Star, ApJL, 589 (2003), L51.
- [10] F. Vrba et al., Preliminary Parallaxes of 40 L and T Dwarfs from the US Naval Observatory Infrared Astrometry Program, AJ, 127 (2004), 2948.