A Search for Dense Molecular Gas in High Redshift Infrared-Luminous Galaxies
Abstract
We present a search for HCN emission from four high redshift far infrared (IR) luminous galaxies. Current data and models suggest that these high IR luminous galaxies represent a major starburst phase in the formation of spheroidal galaxies, although many of the sources also host luminous active galactic nuclei (AGN), such that a contribution to the dust heating by the AGN cannot be precluded. HCN emission is a star formation indicator, tracing dense molecular hydrogen gas within star-forming molecular clouds (n(H2) cm-3). HCN luminosity is linearly correlated with IR luminosity for low redshift galaxies, unlike CO emission which can also trace gas at much lower density. We report a marginal detection of HCN (1-0) emission from the QSO J1409+5628, with a velocity integrated line luminosity of K km s-1 pc2, while we obtain 3 upper limits to the HCN luminosity of the QSO J0751+2716 of K km s-1 pc2, K km s-1 pc2 for the starburst galaxy J1401+0252, and K km s-1 pc2 for the QSO J1148+5251. We compare the HCN data on these sources, plus three other high- IR luminous galaxies, to observations of lower redshift star-forming galaxies. The values of the HCN/far-IR luminosity ratios (or limits) for all the high sources are within the scatter of the relationship between HCN and far-IR emission for low star-forming galaxies. These observations are consistent with dust heating by a massive starburst in these systems, with two important caveats. First, about half the measurements are strictly upper limits to the HCN luminosities. And second, the IR spectral energy distributions for most of the high sources are well constrained only on the Rayleigh-Jeans side of the thermal dust peak. We also present a spatially resolved 42 GHz continuum image of the gravitational lens J0751+2716.
1 Introduction
Blind surveys, and targeted observations of known sources (quasi-stellar objects and radio galaxies), with mJy sensitivity at submillimeter (submm) wavelengths have revealed a population of IR luminous galaxies at high redshift, with luminosities L⊙, placing them in the category of Ultraluminous Infrared Galaxies (ULIRGs; see reviews by Blain et al. 2003; Sanders & Mirabel 1996). Current models suggest that this population may represent the formation of large spheroidal galaxies at (Blain et al. 2003). If star formation dominates the dust heating in the high- systems, then the implied star formation rates (up to M⊙ year-1) are such that a significant fraction of the stars in a spheroidal galaxy could be formed in 108 years. However, in many cases a contribution to the IR luminosity from dust heated by an AGN cannot be precluded (Andreani et al. 2003).
An important observation in this regard has been the detection of giant reservoirs of molecular gas via CO emission lines, with gas masses M⊙, providing the requisite material for star formation (Carilli et al. 2004a). However, CO can be excited at relatively low densities – with a critical density for excitation of only cm-3 for the lower transitions, where is the angular momentum quantum number. Hence it is a good tracer of the total molecular gas content of galaxies, but it is a relatively poor tracer of the denser gas directly involved in massive star formation. This fact is accentuated by the non-linear relation between IR luminosity and CO luminosity in star-forming galaxies, with IR luminosity increasing as CO luminosity roughly to the power 1.7 (Gao & Solomon 2004a,b). The non-linear increase in IR luminosity with increasing CO luminosity has been interpreted as an increase in the star formation efficiency, defined as the ratio of star formation rate to total gas mass, with increasing star formation rate (Solomon et al. 1992; Gao & Solomon 2004b).
Local (z ) ULIRGs show strong HCN emission (Solomon, Downes, & Radford 1992; Gao & Solomon 2004a). HCN emission traces much denser gas (critical density for excitation of the lower order transitions ; Evans 1999) than CO emission due to a higher dipole moment. In the Milky Way, very strong HCN emission is found in molecular cloud cores, the sites of star formation, and not in the more massive but less dense cloud envelopes (Helfer & Blitz 1997). Strong HCN emission is therefore an indicator of active star formation. This fact has been demonstrated for external galaxies by the tight, linear correlation between IR and HCN luminosity for star-forming galaxies over a wide range of IR luminosity (109 to 1012 L⊙; Gao & Solomon 2004a,b). For the most luminous infrared galaxies the HCN line luminosities range from 1/4 to 1/10 that of the CO luminosity, as compared with ordinary spiral galaxies where the ratio is typically 1/25 to 1/40. The fact that the ratio of IR luminosity to HCN luminosity is the same in ULIRGs as in lower luminosity galaxies suggests that ULIRGs, like the lower luminosity galaxies, are primarily powered by star formation, and that the HCN luminosity is a good measure of the mass of actively star-forming cloud cores (Gao & Solomon 2004b). In essence, the star formation which is responsible for the IR emission has a rate that is linearly proportional to the mass of dense (ie. HCN-emitting) molecular gas, but not to the total molecular gas, as traced by CO.
The potential of HCN observations as a star formation diagnostic at high redshift was demonstrated recently with the detection of HCN (1-0) emission from the Cloverleaf quasar at (H1413+117) using the Very Large Array (VLA) (Solomon et al. 2003). These observations have proven instrumental in the physical interpretation of the starburst-AGN connection in this system (section 5). More recently, HCN (1-0) emission has been detected from IRAS F10214+4724 using the Green Bank Telescope (Vanden Bout, Solomon, & Maddalena 2004), which may also be an AGN-starburst system. The starburst-AGN connection has taken on new importance with the discovery of the black hole mass – bulge mass relation, suggesting a “causal connection between the formation and evolution of the black hole and the bulge” (Gebhardt et al. 2000).
In this paper we present a search for HCN emission from four high redshift galaxies using the VLA. The sensitivity of these observations is such that we could detect the sources at the level seen for low galaxies, given their IR luminosities. We combine these results with three sources from the literature, and discuss the relationship between HCN and IR luminosity for high ULIRGs, and possible consequences for star formation. We assume a standard concordance cosmology throughout, with H km s-1 Mpc-1, , and .
2 Sources
The four sources were selected for high IR luminosity ( L⊙), strong CO emission, and therefore a precise redshift determination which allows for study of HCN lines with the VLA, with the obvious requirement that the HCN lines redshift into one of the VLA receiver bands. Three were originally discovered as optical or radio quasars, while the fourth is a submm-selected galaxy, with no evidence for an AGN. In the analsys below we also include three recent high redshift HCN detections from the literature: IRAS 10214+4724 at (Solomon & Vanden Bout 2004), BR 1202+0725 at (Isaak et al. 2004), and H1413+117 (the ’cloverleaf’) at (Solomon et al. 2003). All three of the sources are characterized by strong thermal IR emission, and show evidence for an AGN in their optical spectra.
A key point in our analysis is the derivation of the far-IR luminosities. Most of the values quoted herein (Table 2) were recently computed by Beelen et al. (2004, in prep) using single temperature grey body models fit to all the current photometric measurements. For most of the sources the observational data are limited to the Rayleigh-Jeans side of the spectral energy distribution (SED), with only marginal sampling of the thermal dust peak (Benford et al. 1999, Priddey & McMahon 2001, Beelen et al. 2004, in prep). Hence, the dust temperatures are poorly constrained. The mean source SED of high- sources in the Beelen et al. analysis has and a dust emissivity index of , characteristic of ULIRGs at low redshift (Sanders & Mirabel 1996). However, for most of the sources the poor sampling of the dust emission peak implies that we cannot rule out a lower mass, but higher temperature dust component ( K) which would dominate in the (rest-frame) mid-IR ( to 40m), perhaps heated by an AGN. This hot mid-IR component could dominate the total IR emission (ie. integrated from 1 to 1000m), but contribute only a fraction of () to the far-IR luminosity ( to 120 m). For this analysis we have derived the luminosity by integrating over a modified black body fitted to the rest-frame far-IR SEDs of each object, and we set a value when not enough photometric data points are available to fit both and T. The one notable exception from the literature is the Cloverleaf quasar (H1413+117), for which the IR SED is well sampled in frequency (Weiss et al. 2003). We discuss this issue in more detail in section 5.
MG 0751+2716: This is a strongly lensed (magnification factor 17), radio-loud QSO at with complex structure in the image plane on a scale of 1′′ (Lehar et al 1997; Barvainis et al. 2002). It is a IR luminous galaxy, with an (apparent) IR luminosity of L⊙, and shows strong CO emission, with a velocity integrated CO (4-3) flux of 6.0 Jy km s-1 (Barvainis et al. 2002). The radio source shows a falling spectrum, with a flux density at 15 GHz of 48 mJy and a spectral index between 8 and 15 GHz of (Lehar et al. 1997).
J1148+5251: The source SDSS J1148+5251 is the most distant QSO known, at (Fan et al. 2003). Thermal emission from warm dust was detected from J1148+5251 at (sub)mm wavelengths (Bertoldi et al. 2003b; Robson et al. 2004; Beelen et al. 2004, in prep), with an implied rest frame IR luminosity of L⊙. Multiple transitions of CO emission have been detected from this galaxy, with a velocity integrated CO (6-5) flux of 0.73 Jy km s-1 (Bertoldi et al. 2003b; Walter et al. 2003). Non-thermal radio continuum emission has also been detected at 1.4 GHz from 1148+5251, with a flux density of Jy, consistent with the radio-IR correlation for star-forming galaxies (Carilli et al. 2004b). There is no evidence for strong gravitational lensing (i.e., multiple imaging) of this source in high resolution optical and radio images (Carilli et al. 2004b).
SMM 1401+0252: SMM 1401+0252 at was detected in the submm survey of cluster fields of Ivison et al. (2001), with an apparent IR luminosity of L⊙, and multiple CO transitions have been detected from this galaxy (Frayer et al. 1999; Downes & Solomon 2003). The source is gravitationally lensed by a foreground cluster, and perhaps by a galaxy along the line of sight. Swinbank et al. (2004) estimate a magnification factor for the CO of 5, and Downes & Solomon (2003) derive a limit to the CO source size . Optical spectra are consistent with a star-forming galaxy, showing no evidence for an AGN (Ivison et al. 2000). The source is detected at 1.4 GHz with a flux density consistent with the radio-IR correlation for star-forming galaxies (Ivison et al. 2001).
J1409+5628: This optically selected QSO at is the most luminous IR source in the sample of to 3 QSOs of Omont et al. (2003), with . It also shows strong CO emission, with a velocity integrated CO (3-2) flux of 2.3 Jy km s-1 (Beelen et al. 2004; Hainline et al. 2004). VLA observations show an unresolved 1 mJy source at 1.4 GHz with a spectral index between 1.4 and 5 GHz of , consistent with the radio-IR correlation for star-forming galaxies (Petric et al. 2004). High resolution imaging with the VLBA shows a resolved radio source with an intrinsic brightness temperature (at 8 GHz) of 105 K, again consistent with a star-forming galaxy (Beelen et al. 2004). There is no evidence for strong gravitational lensing of J1409+5628.
3 Observations
Three of the sources were observed in the C configuration of the VLA (maximum baseline length 3 km), while J1148+5251 was observed in the D configuration (maximum baseline 1 km). The observational parameters are given in Table 1. Each observing day entailed between 6 and 8 hours on-source time. Amplitude calibration was performed using 3C286, while fast switching phase calibration was employed on timescales of 3 minutes, as well as dynamic scheduling to ensure good weather. On all days the phase stability was excellent.
For two of the sources the HCN (1-0) transition was observed in the 22 GHz band of the VLA using spectral line mode with two polarizations, 7 spectral channels per polarization, and 6.25 MHz per channel (= 78 km s-1). Based on the CO redshifts, the expected line centers for J1409+5628 and SMM 1401+0252 are 24.7354 and 24.8617 GHz, respectively. Due to VLA tuning restrictions with a 50 MHz bandbass, we centered the observations at the closest allowed frequencies of 24.7351 and 24.8649 GHz. For J1409+5628 each day also included one hour in standard continuum mode at 22 GHz to obtain a sensitive limit on the continuum emission.
For MG 0751+2716 we observed the HCN (2-1) transition in the 43 GHz band using continuum mode with two IFs of two polarizations and 50 MHz bandwidth each ( km s-1). The continuum mode was selected due to severe spectral restrictions in the VLA correlator when observing with a 50 MHz bandwidth. The mode chosen optimizes sensitivity to a line of width km s-1, but sacrifices spectral resolution. Based on the CO redshift, the expected line center is 42.208 GHz, but again, due to VLA tuning restrictions we centered the line IF at the closest allowed frequency of 42.215 GHz. The off-line IF was sequentially tuned MHz above and below the line frequency to obtain a high quality image of the continumm source.
For the highest redshift source, J1148+5251, we used two IFs to observe simultaneously the HCN (2-1) transition at 23.8929 GHz and the HCO+ (2-1) transition at 24.0430 GHz. Each IF had two polarizations and seven spectral channels with a channel width of 3.125 MHz (= 39 km s-1). HCO+ is also a dense gas indicator, with a critical density for excitation similar to HCN (Evans 1999).
4 Results
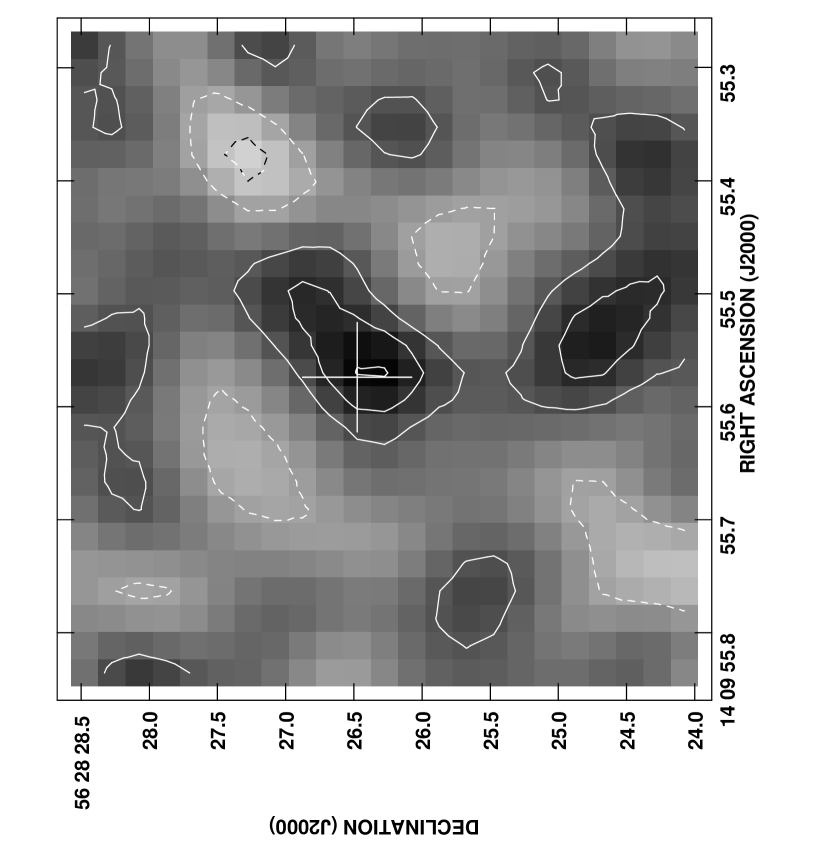
J1409+5628: This source is marginally detected in the radio continuum at 22.5 GHz with SJy. The implied spectral index between 1.4 and 22.5 GHz is , consistent with the spectral index measured between 1.4 and 5 GHz (Petric et al. 2004). The CLEAN components from the continuum image were subtracted from the line data, and the resulting HCN (1-0) spectrum is shown in Figure 1. Zero velocity corresponds to the CO heliocentric redshift. The spectrum shows a possible detection of HCN emission in at least two channels. The contour image of the average of these two channels is shown in Figure 2. Gaussian fitting to the line profile results in a peak of Jy, a FWHM = km s-1, and a central velocity of km s-1 relative to the CO redshift. Overall, we feel this is a marginal detection of HCN emission from J1409+5628, and given possible uncertainties in the continuum subtraction, and the relatively low signal-to-noise ratio per channel, we do not consider the low FWHM (for comparison, the FWHM of the CO (3-2) line = 311 km s-1; Beelen et al. 2004), or the velocity offset, relative to the CO line to be significant. We calculate the HCN velocity integrated line luminosity in K km s-1 pc2 using equation 1 from Solomon, Radford, & Downes (1992), and using the nominal values from the Gaussian fitting to the line profile. The HCN line luminosity is listed in column 5 of Table 2.
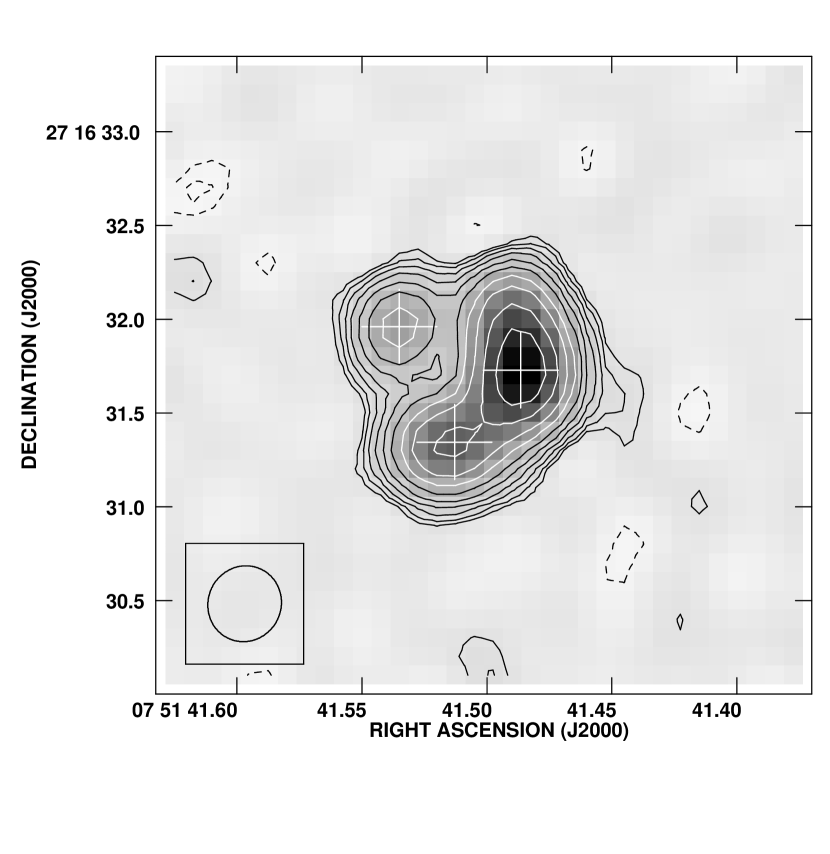
MG 0751+2716: The radio continuum image of MG 0751+2716 is shown in Figure 3. The continuum image shows the multiple structure expected for this complex lensed source (Lehar et al. 1997), with a total flux density of 13.2 mJy, consistent with a spectral index of –1.2 extending from 8 GHz to 42 GHz. The line image (after continuum subtraction) shows no emission with an rms level of 0.1 mJy. We have also convolved the image to 2′′ resolution to search for extended emission (recall that the source has structure due to gravitational lensing on a scale of ), and no emission is seen to an rms level of 0.3 mJy. We calculate an upper limit to the HCN line luminosity (Table 2) assuming an upper limit of 0.3 mJy for a channel width of 350 km s-1.
SMM 1401+0252: No emission is seen from this source with an rms per channel of 44 Jy. Averaging over all channels sets a 3 limit to the continuum emission of 50 Jy. The CO line FWHM is 200 km s-1. Averaging over the three central channels of the HCN spectrum (= 234 km s-1) leads to a 3 limit of 76 Jy, with an implied HCN line luminosity as given in Table 2.
J1148+5251: No HCN or HCO+ line emission is detected from J1148+5251, with an rms per 39 km s-1 channel of 70 Jy. Summing over the band (273 km s-1) gives a 3 limit to the integrated HCN or HCO+ line emission of 90 Jy, or a limit to the line luminosity as given in Table 2. Summing both the HCN and HCO+ data gives a 3 upper limit to the continuum emission at 24 GHz of 70 Jy.
Two continuum sources are detected in the field of J1148+5251, located about 1′ northeast and southwest of the QSO, with flux densities of 4.9 and 4.1 mJy at 24 GHz. These sources have been detected previously at 1.4 GHz, and have been discussed at length in Carilli et al. (2004b), with the SW source corresponding to the core of a radio galaxy at , and the NE source having a point source optical counterpart of unknown redshift.
5 Discussion
We summarize the HCN results for these four high redshift IR luminous galaxies in Table 2, along with results for three other high redshift sources from the literature (Solomon et al. 2003; Isaak et al. 2004; Solomon & Vanden Bout 2004). We assume constant brightness temperature when extrapolating from higher order transitions to the 1–0 transition, ie. is independent of transition. Multiple transition CO emission line studies of a few high sources, including BR 1202+0725 in Table 2, show that this is a reasonable assumption, at least up CO(4–3) (Carilli et al. 2002). Whether this is also true for the HCN(2–1) to HCN(1–0) transitions remains to be verified. Column 7 gives the gravitational lens magnification factor used to correct to intrinsic luminosity.
Figure 4 shows the relationship between far-IR luminosity and HCN line luminosity for the seven sources in Table 2, plus the local galaxy samples () of Gao & Solomon (2004a) and Solomon, Downes, & Radford (1992). For the Gao & Salomon (2004a) sample, we re-derived the far-IR luminosities of the sources using the flux densities listed in the revised IRAS bright galaxy catalog and again integrating over a modified black body fitted to the rest-frame far-infrared SEDs of each object. The solid line shows the relationship between the far-IR and HCN luminosity of the Gao & Solomon (2004a) and Solomon, Downes, & Radford (1992) samples: . The fact that the power-law index is close to unity () implies a nearly linear relationship between FIR and HCN luminosity for the low galaxy sample. Overall, the high sources fall within the scatter of the low source relationship, although four of the cases are strictly HCN upper limits. Thus far, the data are consistent with the hypothesis that the same dust heating mechanism operates in both low and high sources, and in the case of the low sources this mechanism has been shown to be star formation (Gao & Solomon 2004b).
As an example, consider J1409+5628. A rough estimate of the dense gas mass can be derived from the relation , where M⊙ (K km s-1 pc2)-1 assuming the gas is warm (K; Gao & Solomon 2004b), leading to a dense gas mass of M⊙. Beelen et al. (2004) estimate a (total) star formation rate for the J1409+5628 galaxy of M⊙ year-1 from the far-IR and radio continuum luminosities. Hence, the dense gas depletion timescale is of order years. The implication is that the starburst in J1409+5628 is relatively short-lived, unless the dense gas can be re-supplied on timescales years.
However, we should emphasize that all the high sources (including the upper limits) in Figure 4 fall on the low side of the relation set by the low samples in terms of their HCN luminosity. This trend may imply some contribution to dust heating by another source, such as an AGN, or a possible breakdown in the low relationship between HCN and IR luminosities at the highest luminosities (or at high redshift). Clearly a larger sample of high IR luminous galaxies with sensitive HCN observations are required to test these possibilities.
For the high sources, the one case in Table 2 for which the rest frame IR SED is well sampled across the dust peak is the Cloverleaf quasar (H1413+117 in Table 2; Weiss et al. 2003). Weiss et al. (2003) find the IR emission can be decomposed into a warm component (115 K) that dominates the mid-IR emission, and a cooler component (50 K) that dominates the far-IR emission. The cool component also dominates the dust mass. In their study of the HCN emission from the Cloverleaf, Solomon et al. (2003) show that the HCN/IR ratio for the cool component follows the low star-forming galaxy relation, and from this they propose that 22 of the total IR luminosity (corresponding to the cooler component) results from dust heated by star formation, while the hotter component is dust heated by the AGN. In Figure 4 we have only included the cool component in the IR luminosity for the Cloverleaf. It is possible that some of the other sources in Table 2, in particular those harboring known AGN, have similar hot dust components. Future sensitive observations at higher frequencies ( GHz and above) are required to test this hypothesis.
The observations presented herein highlight the difficulty in detecting thermal molecular transitions other than CO from high redshift IR luminous galaxies with current instruments. The improved spectral capabilities of the Expanded Very Large Array, and the wider total redshift range covered by the receivers111http://www.aoc.nrao.edu/evla/, will help in terms of detecting low order transitions redshifted to centimeter wavelengths, although the nominal line sensitivity of the array at these frequencies will improve by at most a factor two relative to the current system at 20 to 50 GHz. The Atacama Large Millimeter Array (ALMA)222http://www.alma.nrao.edu/, will improve the sensitivity in the millimeter regime by more than an order of magnitude relative to current instruments. However, ALMA will be restricted to studying the higher order transitions (3-2 and higher for ) of the most common tracers such as HCN and HCO+. These transitions may be sub-thermally excited, as is seen for HCN(J=4-3) in the Cloverleaf (Guelin, et al. 2004, in prep; Solomon et al. 2003), due to the very high critical densities for excitation of the higher levels (; Evans 1999).
References
- (1) Andreani, P., Cristiani, S., Grazian, A., LaFranca, F., Goldschmidt, P. 2003, A& A, 401, 389
- (2) Barvainis, R., Alloin, D., & Bremer, M. 2002; A&A, 385, 399
- (3) Beelen, A., Cox, P., Pety, J. et al. 2004, A& A, 423, 441
- (4) Benford, D., Cox, P., Omont, A., Phillips, T.G., McMahon, R.G. 1999, ApJ, 518, L65
- (5) Bertoldi, F., Carilli, C. L., Cox, P. et al. 2003a, A& A, 406, L55
- (6) Bertoldi, F., Cox, P., Neri, R. et al. 2003b, A& A, 409, L47
- (7) Blain, A., Smail, I., Ivison, R., Kneib, J.-P., Frayer, D. 2002, Phys. Reports, 369, 111
- (8) Carilli, C. L. et al. 2004a, in Multiwavelength AGN Surveys, eds. R. Mujica & R. Maiolino (World Scientific, River Edge NJ), in press (astroph/0402573)
- (9) Carilli, C.L., Walter, F., Bertoldi, F., et al. 2004b, AJ, in press (astroph/0406279)
- (10) Carilli, C.L., Kohno, K, Kawabe, R. et al. 2002, AJ, 123, 1838
- (11) Downes, D. & Solomon, P. M. 2003, ApJ, 582, 37
- (12) Downes, D. & Solomon, P. 1998, ApJ, 507, 615
- (13) Evans, N. 1999, ARAA, 37, 311
- (14) Fan, X., Strauss, M. A., Schneider, D. P., et al. 2003,AJ, 125, 1649
- (15) Frayer, D. et al. 1999, ApJ, 514, L13
- (16) Gao, Y. & Solomon, P. M. 2004a, ApJS, 152, 63
- (17) Gao, Y. & Solomon, P. M. 2004b, ApJ, 606, 271
- (18) Gao, Y. & Solomon, P. M. 1999, ApJ, 512, L99
- (19) Gebhardt, K., Kormendy, J., Ho, L. et al, 2000, ApJ, 539, L13
- (20) Hainline, L., Scoville, N., Yun, M.S., Hawkins, D., Frayer, D., Isaak, K. 2004, ApJ, 609, 61
- (21) Helfer, T. & Blitz L., 1997, ApJ 478, 233
- (22) Isaak, K., Chandler, C., & Carilli, C. 2004, MNRAS, 348, 1035
- (23) Ivison, R., Smail, I., Frayer, D., Kneib, J.-P., Blain , A. 2001, ApJ, 561, L45
- (24) Ivison, R., Smail, I., Barger, A., et al. 2000, MNRAS, 315, 209
- (25) Lehar, J., Burke, B., Conner, S. et al. 1997, AJ, 114, 48
- (26) Omont, A. Beelen, A., Bertoldi, F. et al. 2003, A&A, 398, 857
- (27) Petric, A., Carilli, C., Bertoldi, F. et al. 2004, AJ, 126, 15
- (28) Priddey, R.S. & McMahon, R.G. 2001, MNRAS, 324, L17
- (29) Robson, I., Priddey, R., Isaak, K., McMahon, R. 2004, MNRAS, 351, L29
- (30) Sanders, D.B., & Mirabel I.F. 1996, ARAA, 34, 749
- (31) Solomon, P.M. & Vanden Bout, P. 2004, ApJ, submitted
- (32) Solomon, P.M., Vanden Bout, P., Carilli, C., Guelin, M. 2003, Nature, 426, 636
- (33) Solomon, P.M., Downes, D., Radford, S.J. 1992, ApJ, 387, L55
- (34) Solomon, P.M., Radford, S.J., Downes, D. 1992, Nature, 356, 318
- (35) Swinbank, A.M., Smail, I., Chapman, S., Blain, A., Ivison, R., & Keel, W. 2004, ApJ in press
- (36) Walter, F., Bertoldi, F., Carilli, C.L., et al. 2003, Nature, 424, 406
- (37) Weiss, A., Henkel, C., Downes, D., Walter, F. 2003, A& A, 409, L41
- (38) Vanden Bout, P., Solomon, P., Maddalena, R. 2004, ApJ, submitted
| Source | Date | Transition | Rest Freq. | Obs. Freq. | FWHM | rms | Chan. Width | Bandwidth |
|---|---|---|---|---|---|---|---|---|
| GHz | GHz | arcsec | Jy | km s-1 | MHz | |||
| MG 0751+2716 | April 16, 18, 2004 | HCN(2–1) | 177.261 | 42.215 | 0.6 | 100 | 350 | 3x50 |
| J1148+5251 | June 21, 26, 2004 | HCN(2–1) | 177.261 | 23.892 | 3.5 | 60 | 39 | 25 |
| J1148+5251 | June 21, 26, 2004 | HCO+(2–1) | 178.375 | 24.043 | 3.5 | 60 | 39 | 25 |
| SMM 1401+0252 | March 21, 26, 2004 | HCN(1–0) | 88.632 | 24.865 | 1.0 | 44 | 78 | 50 |
| J1409+5628 | April 16, 18, 28, 2004 | HCN(1–0) | 88.632 | 24.735 | 1.1 | 40 | 78 | 50 |
| Source | Type | Magf | References: CO; HCN | ||||
|---|---|---|---|---|---|---|---|
| L⊙ | K km s-1 pc2 | ||||||
| MG 0751+2716 | QSO | 3.200 | 17 | Barvainis et al. 2002; This paper | |||
| IRAS F10214+4724 | AGN | 2.286 | 13 | Solomon et al. 1992; Solomon & Vanden Bout 2004 | |||
| J1148+5251 | QSO | 6.419 | 1 | Walter et al. 2003; This paper | |||
| BR 1202+0725 | QSO | 4.693 | 1 | Carilli et al. 2002; Isaak et al. 2004 | |||
| SMM 1401+0252 | Gal | 2.565 | 5 | Ivison et al. 2001; This paper | |||
| J1409+5628 | QSO | 2.583 | 1 | Beelen et al. 2004; This paper | |||
| H1413+117 | QSO | 2.558 | 11 | Weiss et al. 2004; Solomon et al. 2003 | |||
Note. — aThe redshift derived from the CO emission.
bThe intrinsic far-IR luminosities derived as discussed in section 2.
cAll the line and continuum luminosities in this Table have been corrected for gravitational magnification (column 7).
d The velocity integrated HCN (1-0) line luminosity (or 3 upper limits).
eThe velocity integrated CO (1-0) line luminosity (or 3 upper limits).
fThe gravitational lens magnification factor.