The Serendipitous Extragalactic X-Ray Source
Identification
(SEXSI) Program: II. Optical Imaging
Abstract
The Serendipitous Extragalactic X-ray Source Identification (SEXSI) Program is designed to expand significantly the sample of identified extragalactic hard X-ray sources at intermediate fluxes, . SEXSI, which includes sources derived from more than 2 deg2 of Chandra images, provides the largest hard X-ray-selected sample yet studied, offering an essential complement to the Chandra Deep Fields (total area deg2). In this paper we describe -band optical imaging of the SEXSI fields from the Palomar, MDM, and Keck observatories. We have identified counterparts, or derived flux limits for nearly 1000 hard X-ray sources. Using the optical images, we derive accurate source positions. We investigate correlations between optical and X-ray flux, and optical flux and X-ray hardness ratio. We also study the density of optical sources surrounding X-ray counterparts, as well as the properties of optically-faint, hard X-ray sources.
1 Introduction
With the successful launch in 1999 of the Chandra X-Ray Observatory (Weisskopf et al., 1996) came the opportunity to explore the X-ray universe with greater angular resolution and sensitivity in the 2 – 10 keV energy range than ever before. One of the primary goals of the mission is to perform surveys of the extragalactic sky at these higher energies.
The longest Chandra pointings thus far are the Chandra Deep Field - North (Alexander et al., 2003) and -South (Giacconi et al., 2002), with 2 Ms and 1 Ms exposure times, respectively. These fields have explored faint sources, with many objects reaching below the luminosity range of active galactic nuclei (AGN) to include “normal” galaxies. Though the Deep Fields are pushing to lower fluxes than previously attainable, they cover only a small area ( deg2 each), and do not have good statistics for the flux range in which the dominant contribution to the 2 – 10 keV X-ray background arises. To get such statistics, a larger area of the sky must be covered by combining multiple Chandra pointings.
The Chandra archive provides the opportunity to explore multiple, mid-depth ( ks) exposures. In Harrison et al. (2003, Paper I) we presented the Serendipitous Extragalactic X-ray Source Identification (SEXSI) program design, our X-ray analysis techniques and a catalog of over one thousand 2 – 10 keV sources, as well as some initial X-ray results and comparisons with previous work. With data from 27 archival Chandra fields, SEXSI is designed to focus on a large-area ( deg2) sample of X-ray sources in the intermediate flux range (). Our goal is to determine spectroscopically the redshift distributions and nature of hard (2 – 10 keV) X-ray source populations from which the bulk of the X-ray background arises. The campaign of single-color photometry presented here attempts a minimum depth for every field of , consistent with identifying counterparts for which classifiable spectra can be obtained with a 10-m telescope in a hour integration. This strategy maximizes the number of hard sources identified spectroscopically in our fields for our fixed observing campaign.
Other programs are also aiming to understand the X-ray source population at medium depth with degree-scale Chandra and XMM-Newton surveys. Examples of such surveys include HELLAS2XMM (e.g., Baldi et al., 2002; Brusa et al., 2003) and the Chandra Multiwavelength Project (ChaMP; e.g., Kim et al., 2003; Green et al., 2004). Brandt et al. (2004) presents a comprehensive list of the many ongoing X-ray background surveys.
The SEXSI program is unique among the Chandra Serendipitous surveys in concentrating on obtaining a uniform spectroscopic survey restricted to the hard source population. The ChaMP, in contrast, is a comprehensive program of imaging and spectroscopy to follow-up both soft and hard sources in a large number of publicly-accessible extragalactic Chandra pointings. The SEXSI spectroscopic catalog will therefore contain a larger fraction of obscured AGN than ChaMP. Eight of the fields are common to both surveys, and for one of these ChaMP has published some spectroscopic followup (Green et al., 2004). Even for the common fields, SEXSI plans deeper spectroscopy and should identify a greater number of hard X-ray sources. Between the large number of distinct fields and the different focus for ground-based followup, the SEXSI survey provides an essential complement to current surveys of the sources responsible for the X-ray background.
In this paper, we present optical -band imaging of the SEXSI Chandra fields, as well as the methodology used to derive X-ray source identifications and a catalog of -band counterpart magnitudes. In addition, we explore relationships between the X-ray flux, hardness ratio, and -band magnitude. A third paper in this series (Eckart et al., in preparation; Paper III) will include our optical spectroscopic results, with redshifts and classifications for of these objects, and a discussion of the luminosity distribution, redshift distribution, and composition of the sample.
2 Optical Imaging and Reduction
We have imaged the SEXSI fields using the Palomar 60-inch (P60) and 200-inch (P200) telescopes, the MDM 2.4-meter (MDM-2.4) and 1.3-meter (MDM-1.3) telescopes, and the Keck I telescope. Much of the early optical imaging for this program was done with small field-of-view, single-CCD array cameras. For example, the P60 CCD13 camera has a 12.6′12.6′ field of view. This requires several pointings to map a typical Chandra field, making multi-color imaging very time consuming. Since Spring 2000, both the P200 and MDM-2.4 have had large-format () CCD cameras available, allowing us to cover nearly all of a Chandra field in a single pointing. The P200 Large Format Camera (LFC; Simcoe et al., 2000) uses the Sloan digital sky survey (SDSS) filter set (, , , and ; Fukugita et al., 1996), while, for our MDM-2.4 8K camera (Crotts, 2001) imaging, we used Johnson-Cousins filters (, , , and ). In each filter band, our goal has been to obtain images with a limiting Vega magnitude of , the practical limit for obtaining counterpart spectra at the Keck telescope in reasonable integration times. Because the large-format cameras were not available for the first 1.5 years of the SEXSI project, some fields are imaged only in band (due to observing time constraints), while the fields observed later in the program generally have multicolor data. For the purposes of this paper, we use only the -band data. Table 1 summarizes the characteristics of the telescopes and imaging instruments used in this program.
We reduced the optical images using standard techniques, relying upon IRAF tasks for the preliminary steps. Median-combined bias frames, taken the same night as the science data, were subtracted from the images. For flatfielding, we used either dome flats or sky flats generated by combining all the images from a night, including twilight flats, with min/max rejection to remove stars. We used standard techniques to mask out cosmic rays and bad pixels prior to combining data.
For astrometric calibration of most of the data, we used the DOPHOT software package to locate all nonsaturated, point-like objects in individual exposures. Comparing with the USNO-A2.0 catalog (Monet, 1998), we then used the object-matching program starmatch (by Doug Reynolds) to both align the images before stacking and to obtain an astrometric solution for the final, combined image. The standard deviations of the astrometric solutions are generally in each axis.
We reduced images using the same methodology for both the LFC data from the P200 telescope and the 8K data from the MDM-2.4 telescope, although slightly different suites of software were required. We relied upon the MSCRED package within IRAF, designed for reduction of large-format, multi-array optical data from the Kitt Peak/Cerra Tololo MOSAIC cameras, following the informative reduction pipeline outlined by B. Jannuzi111See http://www.noao.edu/noao/noaodeep/Reduction0pt/frames.html.. For the LFC images this necessitated first changing the data into the requisite format using the LFCRED package created by M. Hunt222See http://wopr.caltech.edu/mph/lfcred..
2.1 Photometric calibration
We relied on a variety of methods to provide photometric calibration of the data, depending upon the conditions under which data for a SEXSI field were taken. Throughout, unless otherwise noted, we refer our magnitudes to the Vega-based system. If conditions were photometric, we determined magnitude zeropoints from Landolt (1992) fields observed the same night, at an airmass close to that of the field in question. In cases where a non-photometric image overlaps a photometric image from another night, we determined the zeropoint magnitude by matching the photometry of overlapping regions.
In cases where we obtained no photometric images of a field, we relied on shallow sky surveys to provide magnitude zeropoints. Where available, we used photometry from the SDSS first data release (Abazajian et al., 2003), converting from AB magnitudes to Vega magnitudes with
| (1) |
Alternatively, we used the USNO-B1.0 catalog (Monet et al., 2003) to establish the zeropoint. Typical photometric calibration errors for this technique were 0.2 mag.
For the purposes of this paper, we make the assumption that the SDSS and Johnson-Cousins filters are similar. Convolving the respective filter transmission curves with the Vanden Berk et al. (2001) composite SDSS quasar spectrum redshifted from to , we find that this assumption provides a mag systematic uncertainty in our photometry. Performing the same exercise on the Kinney et al. (1996) composite galaxy templates, we find systematic offsets mag for , with larger systematic offsets at higher redshifts. For example, the S0 composite template at has a 0.39 mag difference between the and Vega magnitudes due to the 4000 Å break redshifting out of the filter. Though imprecise, our assumption that the and filters are similar is adequate to establish the faint source limit of each image, and to plan spectroscopic observing runs.
2.2 Source extraction and limiting magnitudes
For extraction of sources from our combined, calibrated optical images, we used the SExtractor code of Bertin & Arnouts (1996) to generate catalogs for both the full optical images and for the smaller, central portions of each image. Because they avoid the CCD edges where the increased noise leads to spurious sources, these latter catalogs are used to derive photometric depths. Quoted magnitudes refer to the SExtractor MAGBEST, which usually reports photometry within elliptical apertures (Kron, 1980), but reverts to a corrected isophotal magnitude if a source is strongly contaminated by nearby sources.
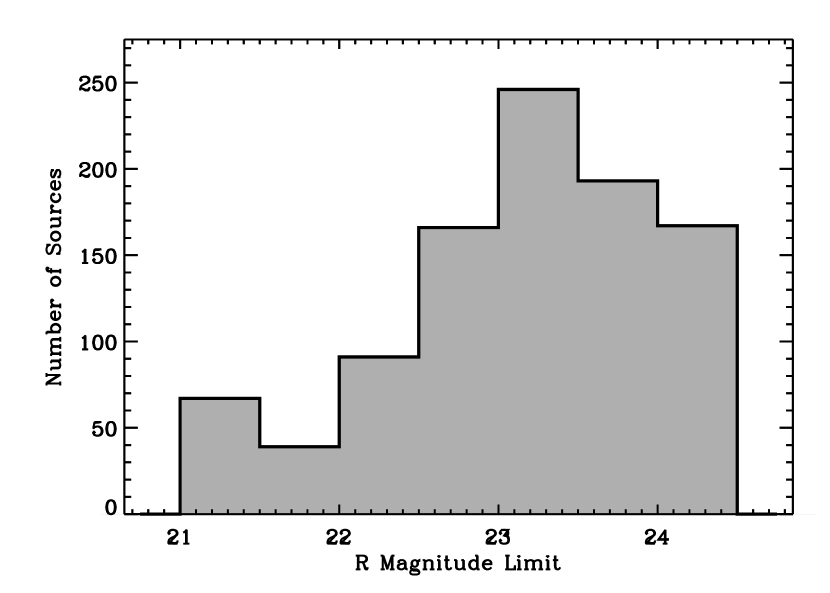
To determine limiting magnitudes for each image, we made histograms of the -band source density in 0.5 magnitude bins. Figure 1 shows an example histogram from SEXSI field Q2345. For each SEXSI field image, we compare the measured number counts to that derived by Capak et al. (2004) from deep Subaru imaging of the Hubble Deep Field-North:
| (2) |
where has units of number degree-2 0.5 mag-1. For -band magnitudes in the range , Capak et al. (2004) finds and . Converting our -band photometry into the AB system with Equation 1, we plot our measured number counts for each image with the published, deep-field fit (see Figure 1). In order to derive a crude depth for our images, we compare our number counts in each 0.5 mag bin to Equation 2 (at bin center). Limiting magnitudes are defined by the inter-bin flux where our number counts go from greater than 80% to less than 80% of the Capak et al. (2004) value: this provides an completeness depth for each image. By the nature of our algorithm, then, these limits are good to mag.
Table 2 summarizes the -band optical imaging we have obtained for the SEXSI fields. The average X-ray to optical offsets, and , are discussed in § 3 below. We derived -band Galactic extinction for the central position of each X-ray image using the NED Galactic extinction calculator333See http://ned.ipac.caltech.edu/forms/calculator.html.. Checking the variance of the NED extinction values across the Chandra field of view, we find that the typical error on the extinction is mag. Three of our fields, however, have significantly higher extinctions than the other fields, and thus have an uncertainty of mag in their extinction values for individual sources. These fields are flagged in Table 2.
Approximately half of the SEXSI fields were observed with a single, uniform depth image; the other half rely on imaging from multiple cameras and telescopes over several observing runs. Of the fifteen fields with a single optical image, six reach -band depths , and ten reach -band depths . The shallowest field, CL 0442+0202, only reaches , while the deepest field, CL 0848+4454, reaches . Of the twelve fields with imaging from multiple pointings, eight have sections reaching depths of at least . A histogram of imaging depth for each source is shown in Figure 2.
3 Optical Counterparts to X-Ray Sources
We match X-ray and optical sources in several steps. The procedure is slightly different depending on whether there is one optical image or multiple optical images per Chandra field.
For fields with a single optical image, we first identify the closest optical source within 4′′ of each Chandra source position. Excluding sources displaced by more than 1.5 from the mean offset, we use these identifications to calculate a first estimate of the average offset between the Chandra and USNO astrometry. For the following iterations, the search radius used to identify optical counterparts depends upon the off-axis angle (OAA) of the X-ray source: we use the larger of 1.5′′ and PSF/3, where PSF is the full-width, half-maximum of the Chandra point spread function at each OAA. Again, we exclude sources displaced by more than 1.5 from the mean as we iteratively correct the X-ray source positions. We continue iterating until the corrections to the offsets are less than the corresponding standard deviation. Two to three iterations are typically required, with the biggest shift applied after the initial matching. As shown in Table 2, the typical standard deviation on this astrometric correction is 0.3′′, comparable to the accuracy of the optical astrometry.
For fields with multiple optical images we modify this algorithm slightly. Some images cover an area with few (or one) X-ray sources, which, if we were to follow the procedure described above, could lead to incorrect offsets and matches. Instead, for a given Chandra field, we first take each optical image and find the closest match within a 4′′ radius of all Chandra source positions that fall within the image. We record these astrometric differences. For X-ray sources falling on multiple optical images, we use the data from the image with the deepest limiting magnitude. As before, we use this list of multi-image astrometric differences to calculate an average Chandra to USNO offset, again eliminating sources greater than 1.5 from the mean offset. This astrometric correction is then applied to all Chandra positions for the SEXSI field considered. A second pass at optical identifications is then made with the OAA-dependent matching radius, using the larger of 1.5′′ and PSF/3. Of the 998 SEXSI sources with optical coverage, 655 used a 1.5′′ search radius, while 343 used the PSF/3 search radius.
We expect few false matches due to an optical source randomly overlapping the matching search area. The number of false matches per field depends upon both the number of X-ray sources detected in the Chandra field, and the depth of the optical image. We tested several fields from Table 2 for false matches by finding the total area covered by the 1.5′′ radius search circles and multiplying that area by the optical source density. We find that for medium-depth X-ray and optical images, the number of false sources detected per field is generally less than one. For example, we predict 0.6 false matches for Q2345, 0.7 false matches for CL 0442+0202, and 1.3 false matches for 1156+295, where these numbers are for the 1.5′′ search radius sources only. For the 34% of the sources with larger OAAs and thus larger search areas we expect a larger fraction of false matches, though still fewer than 3 per field for most fields. For example, we predict 1.3 false matches from the ′′ match radius sources in Q2345, 1.4 false matches in CL 0442+0202, and 2.4 false matches in 1156+295. For several of the fields, including the three example fields just mentioned, we shifted all X-ray source positions by 1′, producing a “fake” X-ray catalog, and ran the matching routine again with the average X-ray-to-optical offset forced to zero. This process, repeated with several different shifts of the X-ray source positions, gives a check on the number of false detections predicted above. For all of the fields tested the number of false detections are consistent with the values we calculate. Our spectroscopic results are also consistent with this matching scheme and will be discussed further in Paper III.
Once matching is complete, we produce first-draft optical postage stamp cutouts for our entire hard X-ray catalog (see Figure 3). Each stamp is centered on the astrometrically-corrected X-ray source position, and the size of the Chandra PSF-dependent search radius is shown by the (centered) solid circle. A dashed circle, located at the un-corrected Chandra position, illustrates the need for this offset correction. Arrows point to identified optical counterparts, while the absence of an arrow signals a non-detection. If the magnitude found by SExtractor is fainter than the limiting optical image, we annotate the photometry with an asterisk. As in Paper I, a “CL” flag is added if a source is potentially within 1 Mpc of a target cluster center.
Next we visually inspect postage stamps for each X-ray source, flagging sources with potentially inaccurate photometry as required. These flags, detailed in § 4, identify sources which either (1) have multiple optical identifications within the PSF-dependent search area, or (2) are, or are near, a saturated source in our optical image. A final matching iteration is then done, excluding the newly flagged sources. We produce new optical catalogs and postage stamp cutouts, omitting stamps for the handful of saturated sources where counterpart magnitudes are drawn from the literature and the 65 SEXSI sources that either lack optical coverage in our data or have an unknown limiting magnitude due to nearby bright-source contamination (optical flag = 6, see § 4). An example of six postage stamp cutouts is included as Figure 3; the entire catalog of postage stamps is provided in the online version of the manuscript.
For the 262 sources with , 160 (61%) have identified counterparts, while for the 434 sources with , 291 (67%) have identified counterparts, and for the 167 sources with , 124 (74%) have identified counterparts. Our total sample of 947 sources with unambiguous photometry (no contamination) identifies 603 counterparts (64%).
4 The Catalog
In Table 3 we present the catalog of 1034 hard-band SEXSI sources – the table is published in its entirety in the electronic version of the Astrophysical Journal. Columns 1 – 7 present X-ray source information for easy reference, while the optical photometric data are presented in columns 8 – 15. Complete X-ray source information is presented in Paper I, Table 4. The X-ray source positions in Table 3 are corrected for mean optical to X-ray offsets. Note that since the source names (column 1), identical to the source names in Paper I, are derived from the hard-band X-ray images, the refined positions of columns 2 – 3 will not exactly match those of column 1 (though mean offsets are typically less than 1′′). Column 4 lists the off-axis angle (OAA, i.e., the angular distance, in arcmin, of the source position from the telescope aim point). The 2 – 10 keV flux (in units of ) and detection SNR are shown in columns 5 – 6, while column 7 gives the hardness ratio, , where and are the counts cm-2 in the 2 – 10 keV and 0.5 – 2 keV bands, respectively. Here, as distinct from Paper I, we record the hardness ratio derived from the net soft X-ray counts recorded at the hard-band source position when there was not a significant soft-band source detected (in Paper I these cases are reported as ). In addition, for a subset of these cases, when the soft-band counts recorded at the hard-band source position were less than twice the soft-band background counts, the is considered a lower-limit, flagged as such in the catalog, and set to , where soft-band background counts.
Column 8 contains an optical flag code essential to interpretation of the optical data: 0 = no optical coverage, 1 = a solid optical ID, 2 = no optical counterpart (the magnitude listed is then a lower limit), 3 = saturated in the SEXSI optical image (-band magnitude taken from the Guide Star Catalog II (McLean et al., 2000) or a secondary source in VIZIER database), 4 = a solid ID but -band magnitude affected by nearby bright source, 5 = more than one optical source in X-ray error circle (the source with the smallest positional offset is recorded in the table), and 6 = lower limit (no optical counterpart) but area contaminated by nearby bright source so limiting magnitude is unknown. Column 9 is the -band magnitude of the optical counterpart, with its error shown in column 10. Column 11 gives the limiting magnitude for the image from which the optical counterpart, or a lower limit thereto, was derived. Column 12 lists in arcsec, where is the astrometrically-corrected X-ray source RA (from column 2) and is the optical counterpart RA; column 13 is the corresponding value for declination. Column 14, (), is the X-ray to optical position difference, also in arcsec. Following Hornschemeier et al. (2001) and Stern et al. (2002a), the logarithmic X-ray-to-optical flux ratio (column 15) is given by the relation
| (3) |
derived from the Kron-Cousins -band filter transmission function.
Column 16 presents the SExtractor CLASS_STAR parameter (Bertin & Arnouts, 1996) for basic star-galaxy separation, with values ranging from 0.0 for significantly extended sources to 1.0 for sources consistent with perfectly stellar PSFs. The stellarity value of the 8 bright sources with optflag = 3 (from the literature) is set to 1.00. We present the stellarity data with the caveat that the values should only be used for broad separation, for example, of sources near 0 verses 1, but not for detailed quantitative analysis.
Note that for all of the optical counterpart data columns, special attention must be paid to the optical flag. For example, if the code is a 2 (optical counterpart is not detected), column 9 describes a lower limit, columns 10, 12 – 14, and 16 have no data, and the X-ray-to-optical flux ratio in column 15 is a lower limit.
5 Discussion
We now discuss the results of the optical identifications of the hard X-ray source counterparts and how the counterpart properties relate to the X-ray properties. Throughout this section, only sources with a solid optical counterpart or upper limit thereto are plotted and analyzed; we exclude sources with -band magnitudes or limits contaminated by a nearby bright source and sources with more than one optical source within the identification radius. This provides a sample of 947 hard X-ray sources with unambiguous counterpart photometry, of which 603 are identifications and 344 have limits to the counterpart optical magnitude.
Figure 4 presents the -band magnitudes, or limits thereto, plotted as a function of 2 – 10 keV X-ray flux. Dashed lines show constant X-ray-to-optical flux ratios. The bulk of the SEXSI sources have and are fainter than . Shallow, wide-area X-ray surveys, such as the ASCA hard X-ray survey reported by Akiyama et al. (2000), find that the majority of extremely bright X-ray sources () are AGN and have . Many of the SEXSI sources are likely fainter and/or more distant analogs.
As has been found in other surveys (e.g., Hornschemeier et al., 2001; Stern et al., 2002a), SEXSI detects a population of sources overluminous in the X-ray for their optical magnitudes. This population is found over the entire X-ray flux range sampled. Two explanations have been commonly discussed to explain large values of : (i) extremely high-redshift AGNs that might have bright X-ray fluxes but faint -band fluxes due to absorption from the Lyman transitions of hydrogen along our line of sight, or (ii) heavy obscuration by material in the host galaxy. The latter interpretation for the majority of sources is supported by near-IR studies, which find a large fraction to be very red early-type galaxies at (Mignoli et al., 2004). In addition, a number of Type II quasars, which would have similar properties, have been identified in the deepest Chandra surveys (e.g., Norman et al., 2002; Stern et al., 2002b; Dawson et al., 2003).
By virtue of the large area surveyed, SEXSI contains numerous sources with at moderate X-ray fluxes, . Many of these sources have , well within the reach of 8- to 10-meter class telescopes for spectroscopic follow-up. These are brighter examples of the new X-ray overluminous population. Deep Survey versions of these sources are typically extremely faint — as an example, Koekemoer et al. (2004) report on seven “extreme X-ray / optical” (EXO) sources in the 2 Msec Chandra Deep Field-North (CDF-N) which, despite having extremely robust detections in the Chandra data ( counts), remain undetected () in the Great Observatories Origins Deep Survey imaging of the CDF-N (Giavalisco et al., 2004). Fiore et al. (2003) report on the spectra of 13 sources with from the HELLAS2XMM survey. They find 8 narrow-lined sources, with erg s-1. Our survey contains 109 such sources with of which 64 have an optical limiting magnitude and have spectral data. These high sources provide a useful catalog for future infrared surveys.
We also find a number of sources with very bright () optical counterparts. The bulk of these sources (7 out of 8) are identified as stars in the literature.
Figure 5 presents a histogram of the number of sources in SEXSI and in the CDF-N (Alexander et al., 2003; Barger et al., 2003) as a function of hard X-ray flux and split by -band magnitude at . This magnitude was chosen to separate our sources approximately in half. The small number of sources from images with were not included in this plot or in Figures 6, 7, and 8. The majority of the SEXSI sources have , a flux level that lies between the ASCA and BeppoSAX sensitivity limits and the Chandra Deep Survey capability. This important flux range corresponds to the regime in which the relation changes slope and from which the bulk of the 2 – 10 keV X-ray background arises (Cowie et al., 2002; Harrison et al., 2003). Compared to the Deep Surveys, SEXSI has nearly an order of magnitude more sources at this X-ray depth, approximately half of which have , making them easy spectroscopic targets for 8- to 10-meter class telescopes.
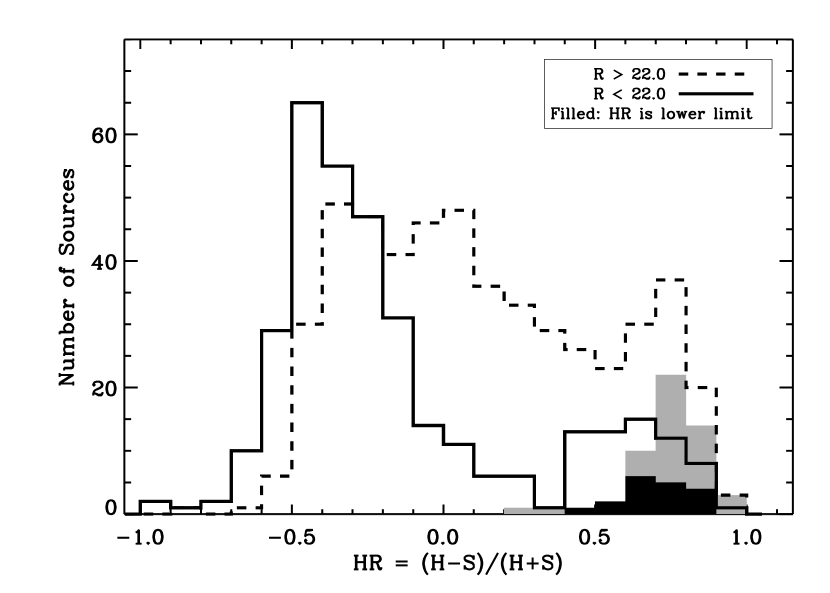
Figure 6 shows the hardness ratio histogram of the SEXSI sources, again split at . The optically-brighter sources are peaked at a low hardness ratio, while the fainter sources have a much harder, and broader, distribution, showing that the optically-fainter portion of the sample has a higher fraction of sources with a flat X-ray spectral slope. The large peak of the sources is near , which corresponds to a power-law photon index () between 1.8 and 1.9, a typical value for unobscured broad-line AGN. This suggests that the majority of the optically-brighter sources are broad-lined AGN. Spectroscopic followup (Paper III) will be able to specifically address this hypothesis. The harder and broader distribution of the sources indicates that obscuration at the source is likely involved. Alexander et al. (2001) shows a similar trend in the 1 Ms CDF-N data.
Figure 7, which displays the mean hardness ratio as a function of hard-band flux separately for bright and faint counterpart magnitudes, again emphasizes that distinct populations are contributing to the overall source counts. The mean values for this figure are calculated using source s regardless of if they are flagged as lower limits. Setting all such flagged sources to the upper extreme, , shifts the points only slightly, if at all. For reference, the of a spectrum with varying intrinsic absorbing column density and redshift is presented in the adjacent panel. This shows that modest-redshift, heavily-obscured sources produce the highest s. For sources fainter than , the mean hardness ratio is essentially constant at over two orders of magnitude in X-ray flux. For those sources with brighter magnitudes, however, there is a significant decline in mean hardness ratio, from at to at . In a simple-minded two-component model with median hardness ratios of and for the two source classes, the faint sources are dominated by the hard population with perhaps an admixture of 10% soft sources at all flux levels, while for the brighter sources, the ratio of hard to soft sources changes from 20:80 at to 80:20 at . This is qualitatively consistent with the relations derived in Paper I, where we showed that hard sources follow a constant power-law over three orders of magnitude in hard-band flux, while softer sources show a distinct break at . In this picture, the soft sources are the standard, largely unobscured AGN at all redshifts, while the harder component represents the lower mean-redshift, lower-luminosity populations revealed in the Deep Surveys (e.g., Tozzi et al., 2001; Barger et al., 2002).
Figure 8 shows the hardness ratio as a function of X-ray to optical flux ratio for the SEXSI sample, again with the of a spectrum with varying intrinsic absorbing column density as a function of redshift presented in the adjacent panel. The main plot shows a trend toward larger hardness ratios as increases. This is in general consistent with the notion that the increasing results from larger absorbing columns which attenuate the -band flux much more severely than the hard X-ray flux (e.g., Mainieri et al., 2002). It is interesting, however, that the most extreme sources with are not all hard, but exhibit a wide range of s, implying that obscuration may not be the sole explanation for the dim optical counterparts. Fiore et al. (2003) find that for non-broad-lined sources (e.g., sources with optical spectra showing narrow AGN emission lines or early-type galaxy absorption lines) there is a linear correlation between and . This relationship implies that some of the high sources with low s are high luminosity, high redshift, narrow-lined AGN.
We also explored the optical source densities in the vicinity of the X-ray sources. For each optical counterpart, we counted the number of sources in the surrounding region and compared the source density to the overall field density to calculate overdensities. We employed 20′′, 30′′, 40′′, and 60′′ radius circles around each optical counterpart and counted sources with -magnitude of and for each of the sources. We found no significant overdensities around the X-ray sources.
6 Summary
We present -band imaging of % of the 2 – 10 keV X-ray sources in the SEXSI survey. We describe our optical data reduction and the X-ray to optical source matching algorithms employed, and present a catalog of -band counterpart photometry and astrometry. While the power of the SEXSI sample is fully realized only with the addition of our collection of optical counterpart spectra, the photometric identification of the sources is an important step that provides clues to the composition of the source population. We find that by splitting the sources at and analyzing each group’s X-ray properties, we begin to see the emergence of what appear to be physically distinct populations. For example we find that the hardness ratio distribution of the optically brighter sources is sharply peaked near , typical of unobscured AGN, while the fainter, sources have a much broader and harder spectral distribution. The findings of this paper suggest that the analysis of optical spectral data from counterparts fainter than (attainable with 10-meter-class telescopes), will be an essential part of exploring the X-ray background composition.
References
- Abazajian et al. (2003) Abazajian, K. et al. 2003, AJ, 126, 2081
- Akiyama et al. (2000) Akiyama, M. et al. 2000, ApJ, 532, 700
- Alexander et al. (2001) Alexander, D. M. et al. 2001, AJ, 122, 2156
- Alexander et al. (2003) —. 2003, AJ, 126, 539
- Baldi et al. (2002) Baldi, A., Molendi, S., Comastri, A., Fiore, F., Matt, G., and Vignali, C. 2002, ApJ, 564, 190
- Barger et al. (2003) Barger, A. et al. 2003, AJ, 126, 632
- Barger et al. (2002) Barger, A. J., Cowie, L. L., Brandt, W. N., Capak, P., Garmire, G. P., Hornschemeier, A. E., Steffen, A. T., and Wehner, E. H. 2002, AJ, 124, 1839
- Bertin & Arnouts (1996) Bertin, E. and Arnouts, S. 1996, A&A, 117, 393
- Brandt et al. (2004) Brandt, W. N., Alexander, D. M., Bauer, F. E., and Vignali, C. 2004, astro-ph/0403646
- Brusa et al. (2003) Brusa, M. et al. 2003, A&A, 409, 65
- Capak et al. (2004) Capak, P. et al. 2004, AJ, in press
- Cowie et al. (2002) Cowie, L. L., Garmire, G. P., Bautz, M. W., Barger, A. J., Brandt, W. N., and Hornschemeier, A. E. 2002, ApJL, 566, L5
- Crotts (2001) Crotts, A. P. S. 2001, BAAS, 33, 792
- Dawson et al. (2003) Dawson, S., McCrady, N., Stern, D., Eckart, M. E., Spinrad, H., Liu, M. C., and Graham, J. R. 2003, AJ, 125, 1236
- Fiore et al. (2003) Fiore, F. et al. 2003, A&A, 409, 79
- Fukugita et al. (1996) Fukugita, M., Ichikawa, T., Gunn, J. E., Doi, M., Shimasaku, K., and Schneider, D. P. 1996, AJ, 111, 1748
- Giacconi et al. (2002) Giacconi, R. et al. 2002, ApJS, 139, 369
- Giavalisco et al. (2004) Giavalisco, M. et al. 2004, ApJL, 600, L93
- Green et al. (2004) Green, P. J. et al. 2004, ApJS, 150, 43
- Harrison et al. (2003) Harrison, F. A., Eckart, M. E., Mao, P. H., Helfand, D. J., and Stern, D. 2003, ApJ, 596, 944
- Hornschemeier et al. (2001) Hornschemeier, A. E. et al. 2001, ApJ, 554, 742
- Kells et al. (1998) Kells, W., Dressler, A., Sivaramakrishnan, A., Carr, D., Koch, E., Epps, H., Hilyard, D., and Pardeilhan, G. 1998, PASP, 110, 1487
- Kim et al. (2003) Kim, D. et al. 2003, astro-ph/0308492
- Kinney et al. (1996) Kinney, A. L., Calzetti, D., Bohlin, R. C., McQuade, K., Storchi-Bergman , T., and Henrique, R. 1996, ApJ, 467, 38
- Koekemoer et al. (2004) Koekemoer, A. M. et al. 2004, ApJL, 600, L123
- Kron (1980) Kron, R. G. 1980, ApJ, 43, 305
- Landolt (1992) Landolt, A. U. 1992, AJ, 104, 340
- Mainieri et al. (2002) Mainieri, V., Bergeron, J., Hasinger, G., Lehmann, I., Rosati, P., Schmidt, M., Szokoly, G., and Della Ceca, R. 2002, A&A, 393, 425
- McLean et al. (2000) McLean, B. J., Greene, G. R., Lattanzi, M. G., and Pirenne, B. 2000, in ASP Conf. Ser. 216: ADASS IX, 145
- Mignoli et al. (2004) Mignoli, M. et al. 2004, astro-ph/0401298
- Monet (1998) Monet, D. G. 1998, BAAS, 30, 1427
- Monet et al. (2003) Monet, D. G. et al. 2003, AJ, 125, 984
- Norman et al. (2002) Norman, C. et al. 2002, ApJ, 571, 218
- Oke et al. (1995) Oke, J. B. et al. 1995, PASP, 107, 375
- Simcoe et al. (2000) Simcoe, R. A., Metzger, M. R., Small, T. A., and Araya, G. 2000, BAAS, 32, 758
- Stern et al. (2002a) Stern, D. et al. 2002a, AJ, 123, 2223
- Stern et al. (2002b) —. 2002b, ApJ, 568, 71
- Tozzi et al. (2001) Tozzi, P. et al. 2001, ApJ, 562, 42
- Vanden Berk et al. (2001) Vanden Berk, D. E. et al. 2001, AJ, 122, 549
- Weisskopf et al. (1996) Weisskopf, M. C., O’dell, S. L., and van Speybroeck, L. P. 1996, in Proc. SPIE Vol. 2805, p. 2-7, Multilayer and Grazing Incidence X-Ray/EUV Optics III, Richard B. Hoover; Arthur B. Walker; Eds., 2
| Plate Scale | ||||
|---|---|---|---|---|
| Camera | Telescope | [′′/pix] | FOV | Reference |
| 8K | MDM 2.4m | 0.18 | Crotts (2001) | |
| CCD13 | Palomar 60” | 0.37 | ||
| Cosmic | Palomar 200” | 0.29 | Kells et al. (1998) | |
| Echelle | MDM 1.3m | 0.50 | ||
| Echelle | MDM 2.4m | 0.28 | ||
| LFC | Palomar 200” | 0.18 | Simcoe et al. (2000) | |
| LRIS | Keck I | 0.22 | Oke et al. (1995) | |
| Templeton | MDM 1.3m | 0.50 |
| X-ray | Optical Images | ||||||||
|---|---|---|---|---|---|---|---|---|---|
| Exp. | extinctionaaError on Galactic -band extinction is , with exceptions noted. This error is generally an order of magnitude smaller than the error on the zeropoint magnitude. | RA | DEC | Camera | limitbbImage -band limits are Galactic extinction-subtracted and correct to within 0.5 mag. | Seeing | |||
| Target | [ks] | [′′] | [′′] | [ Mag] | (J2000) | (J2000) | [Mag] | [′′] | |
| NGC 891 | 51 | -0.9 0.3 | 0.6 0.2 | 0.17 | 02 22 40 | +42 26 16 | 8K | 24.3 | 1.6 |
| AWM 7 | 48 | 0.5 0.3 | 0.2 0.1 | 0.30 | 02 54 45 | +41 40 10 | 8K | 24.2ccLimiting magnitude estimated from visual inspection; the nearby cluster sources skew the -band number counts distribution and gave an unreasonable limiting magnitude from our automated algorithm. | 1.7 |
| XRF 011130 | 30 | 0.4 0.2 | -0.5 0.2 | 0.26 | 03 05 28 | +03 48 52 | LFC | 23.2ddZeropoint derived using USNO-B1.0 catalog. No SDSS coverage available. | 1.2 |
| NGC 1569 | 97 | -0.3 0.2 | 0.6 0.3 | 2.00eeError on Galactic -band extinction is . | 04 29 08 | +64 45 42 | Echelle (1.3) | 21.5 | 1.7 |
| 04 29 42 | +64 42 35 | LRIS | 21.5 | 0.9 | |||||
| 04 29 53 | +64 39 47 | CCD13 | 21.0 | 1.4 | |||||
| 04 30 36 | +64 51 06 | LRIS | 23.0 | 1.2 | |||||
| 04 31 15 | +64 51 06 | LRIS | 22.5 | 0.9 | |||||
| 3C 123 | 47 | -0.1 0.1 | 0.0 0.0 | 2.61eeError on Galactic -band extinction is . | 04 36 52 | +29 40 08 | 8K | 21.9 | 1.4 |
| CL 0442+0202ffIn Paper I, Table 2, CL 0442+0202 was erroneously referred to as “CL 0442+2200”. | 44 | -0.2 0.2 | -1.2 0.3 | 0.41 | 04 42 17 | +02 03 35 | LFC | 21.1ddZeropoint derived using USNO-B1.0 catalog. No SDSS coverage available. | 1.2 |
| CL 0848+4454 | 186 | -0.3 0.1 | -1.2 0.1 | 0.08 | 04 48 49 | +44 54 09 | LFC | 24.4ddZeropoint derived using USNO-B1.0 catalog. No SDSS coverage available. | 1.1 |
| RX J0910 | 171 | -0.3 0.1 | -2.3 0.2 | 0.05 | 09 10 33 | +54 19 38 | 8K | 24.0 | 1.6 |
| 1156+295 | 49 | -0.5 0.2 | -1.1 0.3 | 0.05 | 11 59 32 | +29 16 19 | 8K | 24.5 | 1.5 |
| NGC 4244 | 49 | -0.2 0.2 | 0.0 0.1 | 0.06 | 12 16 46 | +37 51 46 | CCD13 | 22.9ddZeropoint derived using USNO-B1.0 catalog. No SDSS coverage available. | 1.8 |
| 12 17 34 | +37 46 54 | Echelle (1.3) | 23.4ddZeropoint derived using USNO-B1.0 catalog. No SDSS coverage available. | 1.8 | |||||
| 12 17 54 | +37 55 15 | CCD13 | 23.4ddZeropoint derived using USNO-B1.0 catalog. No SDSS coverage available. | 1.5 | |||||
| NGC 4631 | 59 | 0.4 0.3 | -0.3 0.2 | 0.05 | 12 41 29 | +32 36 46 | CCD13 | 23.0ddZeropoint derived using USNO-B1.0 catalog. No SDSS coverage available. | 1.6 |
| 12 41 39 | +32 30 44 | CCD13 | 23.0ddZeropoint derived using USNO-B1.0 catalog. No SDSS coverage available. | 2.5 | |||||
| 12 42 03 | +32 40 53 | Echelle (2.4) | 23.0ddZeropoint derived using USNO-B1.0 catalog. No SDSS coverage available. | 1.2 | |||||
| 12 42 21 | +32 37 09 | CCD13 | 23.0ddZeropoint derived using USNO-B1.0 catalog. No SDSS coverage available. | 1.7 | |||||
| 12 42 59 | +32 32 49 | Templeton | 23.0ddZeropoint derived using USNO-B1.0 catalog. No SDSS coverage available. | 1.4 | |||||
| HCG 62 | 49 | 0.1 0.1 | -0.1 0.1 | 0.13 | 12 53 04 | 09 14 20 | Echelle (2.4) | 22.4ddZeropoint derived using USNO-B1.0 catalog. No SDSS coverage available. | 1.2 |
| 12 53 06 | 09 05 48 | Echelle (2.4) | 23.4ddZeropoint derived using USNO-B1.0 catalog. No SDSS coverage available. | 1.0 | |||||
| 12 53 04 | 09 14 20 | CCD13 | 22.4ddZeropoint derived using USNO-B1.0 catalog. No SDSS coverage available. | 1.6 | |||||
| RX J1317 | 111 | -1.6 0.2 | -1.6 0.2 | 0.03 | 13 17 13 | +29 11 32 | LFC | 23.5ddZeropoint derived using USNO-B1.0 catalog. No SDSS coverage available. | 1.5 |
| BD 1338 | 38 | -1.3 0.2 | -1.1 0.1 | 0.04 | 13 37 44 | +29 25 24 | CCD13 | 22.5 | 1.3 |
| 13 37 53 | +29 29 44 | CCD13 | 22.5 | 1.7 | |||||
| 13 38 15 | +29 36 51 | CCD13 | 22.5 | 2.0 | |||||
| 13 38 26 | +29 24 53 | CCD13 | 22.5 | 1.5 | |||||
| RX J1350 | 58 | 0.7 0.3 | -2.5 0.5 | 0.03 | 13 50 39 | +60 04 11 | LFC | 22.5ggZeropoint derived using SDSS 1st data release. | 0.9 |
| 3C 295 | 23 | 0.2 0.2 | -0.3 0.3 | 0.05 | 14 11 01 | +52 21 18 | CCD13 | 22.5ddZeropoint derived using USNO-B1.0 catalog. No SDSS coverage available. | 2.2 |
| 14 11 24 | +52 13 36 | CCD13 | 21.5ddZeropoint derived using USNO-B1.0 catalog. No SDSS coverage available. | 2.8 | |||||
| 14 11 46 | +52 05 42 | CCD13 | 22.0ddZeropoint derived using USNO-B1.0 catalog. No SDSS coverage available. | 2.3 | |||||
| GRB 010222 | 18 | -0.6 0.2 | 0.1 0.1 | 0.06 | 14 51 59 | +43 08 54 | CCD13 | 21.9 | 2.1 |
| 14 52 13 | +43 01 06 | CCD13 | 22.9 | 1.4 | |||||
| 14 52 43 | +42 55 12 | CCD13 | 22.4 | 1.6 | |||||
| 14 52 59 | +43 06 07 | CCD13 | 22.9 | 1.3 | |||||
| QSO 1508 | 89 | -0.6 0.2 | -0.2 0.1 | 0.03 | 15 09 50 | +57 04 16 | LFC | 24.0ggZeropoint derived using SDSS 1st data release. | 1.2 |
| MKW 3S | 57 | -0.8 0.1 | 0.1 0.1 | 0.09 | 15 21 30 | +07 47 43 | CCD13 | 23.4 | 1.2 |
| 15 21 37 | +07 39 08 | CCD13 | 22.9 | 1.1 | |||||
| 15 22 12 | +07 48 36 | CCD13 | 22.9 | 1.3 | |||||
| 15 22 13 | +07 47 21 | CCD13 | 22.9 | 1.6 | |||||
| MS 1621 | 30 | -1.2 0.1 | 0.3 0.2 | 0.09 | 16 23 06 | +26 36 33 | CCD13 | 22.4 | 2.3 |
| 16 23 13 | +26 30 22 | Cosmic | 24.4 | 1.4 | |||||
| 16 23 26 | +26 38 28 | Cosmic | 23.9 | 1.6 | |||||
| 16 23 42 | +26 43 49 | CCD13 | 22.9 | 2.3 | |||||
| 16 24 03 | +26 35 32 | Cosmic | 23.9 | 1.2 | |||||
| GRB 000926 | 32 | -0.7 0.2 | -0.6 0.3 | 0.08 | 17 03 19 | +51 47 58 | 8K | 22.9 | 1.2 |
| RX J1716 | 52 | -0.5 0.1 | 1.2 0.1 | 0.09 | 17 15 36 | +67 19 45 | CCD13 | 22.4 | 1.7 |
| 17 15 55 | +67 05 59 | Cosmic | 24.4 | 1.3 | |||||
| 17 16 39 | +67 13 27 | Cosmic | 23.9 | 1.4 | |||||
| 17 17 11 | +67 01 40 | Cosmic | 24.4 | 1.2 | |||||
| 17 17 42 | +67 12 36 | CCD13 | 22.9 | 1.3 | |||||
| 17 17 56 | +67 09 08 | Cosmic | 23.9 | 1.6 | |||||
| 17 18 04 | +67 12 01 | CCD13 | 22.4 | 2.2 | |||||
| NGC 6543 | 46 | -0.5 0.2 | -0.2 0.1 | 0.12 | 17 57 44 | +66 44 40 | CCD13 | 22.9 | 1.3 |
| 17 58 31 | +66 34 02 | CCD13 | 22.9 | 1.4 | |||||
| 18 00 25 | +66 30 52 | CCD13 | 22.9 | 1.2 | |||||
| XRF 011030 | 47 | -0.2 0.2 | -0.4 0.2 | 1.09eeError on Galactic -band extinction is . | 20 44 02 | +77 21 06 | LFC | 21.4ddZeropoint derived using USNO-B1.0 catalog. No SDSS coverage available. | 2.2 |
| MS 2053 | 44 | -1.1 0.1 | 0.4 0.1 | 0.22 | 20 55 48 | 04 31 10 | CCD13 | 22.8 | 1.7 |
| 20 55 59 | 04 35 47 | Cosmic | 23.8 | 1.4 | |||||
| 20 56 09 | 04 44 01 | Cosmic | 23.8 | 1.4 | |||||
| 20 56 30 | 04 38 17 | LRIS | 23.8 | 1.0 | |||||
| 20 56 33 | 04 30 53 | CCD13 | 22.3 | 2.1 | |||||
| 20 56 42 | 04 41 28 | Cosmic | 23.8 | 1.2 | |||||
| RX J2247 | 49 | -0.8 0.1 | 1.0 0.1 | 0.15 | 22 47 21 | +03 39 25 | 8K | 23.4 | 1.7 |
| Q2345 | 74 | 0.0 0.1 | -0.3 0.2 | 0.07 | 23 48 25 | +01 01 12 | 8K | 23.4ddZeropoint derived using USNO-B1.0 catalog. No SDSS coverage available. | 1.5 |
| X-ray Data | Optical Counterpart Data | ||||||||||||||
|---|---|---|---|---|---|---|---|---|---|---|---|---|---|---|---|
| CXOSEXSI_ | 2 – 10 keV | ||||||||||||||
| (J2000) | (J2000) | OAA | Flux | SNR | Flag | r | Stel. | ||||||||
| (1) | (2)aaX-ray positions are corrected for average X-ray to optical offset (to correct Chandra astrometry). | (3)aaX-ray positions are corrected for average X-ray to optical offset (to correct Chandra astrometry). | (4) | (5) | (6) | (7)bbNote that the s presented here for sources with soft-band counts that did not meet our detection criteria are calculated differently than they were in Paper I. Please see §4 for detail. | (8)ccSee §4 for details of the flag code. Briefly: 0 = no optical coverage, 1 = solid optical ID, 2 = upper limit, 3 = saturated in SEXSI optical image; -band magnitude taken from the Guide Star Catalog II (McLean et al., 2000), 4 = solid ID but -band magnitude affected by nearby bright source, 5 = more than one optical source consistent with the X-ray source position, 6 = upper limit (no optical counterpart) but area contaminated by nearby bright source so limiting magnitude is unknown. | (9) | (10) | (11) | (12) | (13) | (14) | (15) | (16) |
| J022142.6+422654 | 02 21 42.75 | +42 26 53.5 | 9.49 | 23.10 | 2.83 | -0.33 | 1 | 18.73 | 0.16 | 24.3 | 1.0 | 1.8 | 2.1 | -0.64 | 0.66 |
| J022143.6+421631 | 02 21 43.72 | +42 16 31.0 | 8.33 | 74.80 | 8.81 | -0.28 | 6 | … | … | … | … | … | … | … | … |
| J022151.6+422319 | 02 21 51.76 | +42 23 18.7 | 6.17 | 6.55 | 2.06 | -0.16 | 2 | 24.3 | … | 24.3 | … | … | … | 1.04 | … |
| J022204.9+422338 | 02 22 05.08 | +42 23 37.7 | 4.24 | 8.73 | 2.74 | 0.84dd is lower limit. | 1 | 20.37 | 0.16 | 24.3 | -0.2 | 0.5 | 0.5 | -0.41 | 0.02 |
| J022205.1+422213 | 02 22 05.21 | +42 22 12.7 | 3.45 | 6.82 | 2.38 | 0.07 | 2 | 24.3 | … | 24.3 | … | … | … | 1.07 | … |
| J022207.1+422918 | 02 22 07.19 | +42 29 18.2 | 8.93 | 18.90 | 3.84 | -0.33 | 1 | 21.56 | 0.16 | 24.3 | 2.3 | -0.8 | 2.4 | 0.40 | 0.96 |
| J022210.0+422956 | 02 22 10.08 | +42 29 55.7 | 9.38 | 17.30 | 3.52 | -0.62 | 1 | 18.88 | 0.16 | 24.3 | 0.2 | -0.6 | 0.6 | -0.71 | 0.03 |
| J022210.8+422016 | 02 22 10.93 | +42 20 16.1 | 2.17 | 3.63 | 1.53 | -0.46 | 1 | 21.57 | 0.17 | 24.3 | 0.6 | -0.4 | 0.8 | -0.31 | 0.95 |
| J022211.7+421910 | 02 22 11.79 | +42 19 10.1 | 2.55 | 6.87 | 2.36 | 0.14 | 6 | … | … | … | … | … | … | … | … |
| J022215.0+422341 | 02 22 15.12 | +42 23 41.0 | 3.15 | 15.40 | 3.88 | -0.41 | 1 | 22.52 | 0.18 | 24.3 | 0.1 | 0.0 | 0.1 | 0.70 | 0.64 |
| J022215.1+422045 | 02 22 15.19 | +42 20 44.5 | 1.32 | 42.90 | 7.49 | -0.42 | 1 | 17.33 | 0.16 | 24.3 | -0.3 | 0.1 | 0.3 | -0.94 | 0.03 |
| J022215.5+421842 | 02 22 15.63 | +42 18 41.7 | 2.46 | 6.79 | 2.34 | 0.28 | 1 | 20.33 | 0.16 | 24.3 | -0.4 | 0.1 | 0.4 | -0.54 | 0.03 |
| J022219.3+422052 | 02 22 19.40 | +42 20 51.6 | 0.54 | 6.38 | 2.31 | 0.37 | 1 | 23.82 | 0.22 | 24.3 | -0.9 | 0.6 | 1.1 | 0.83 | 0.38 |
| J022224.3+422138 | 02 22 24.45 | +42 21 38.4 | 0.91 | 64.60 | 8.92 | -0.44 | 1 | 17.41 | 0.16 | 24.3 | 0.0 | 0.0 | 0.0 | -0.73 | 0.98 |
| J022225.2+422451 | 02 22 25.33 | +42 24 50.9 | 4.07 | 128.00 | 12.99 | -0.34 | 1 | 19.31 | 0.16 | 24.3 | 0.1 | 0.2 | 0.2 | 0.33 | 0.98 |
| J022226.5+422154 | 02 22 26.63 | +42 21 54.4 | 1.35 | 6.48 | 2.32 | -0.35 | 2 | 24.3 | … | 24.3 | … | … | … | 1.04 | … |
| J022232.5+423015 | 02 22 32.61 | +42 30 14.6 | 9.61 | 53.60 | 6.50 | 0.12 | 1 | 20.88 | 0.16 | 24.3 | 0.4 | 0.4 | 0.5 | 0.58 | 0.77 |
| J022236.3+421730 | 02 22 36.45 | +42 17 30.2 | 4.23 | 12.00 | 3.30 | 0.01 | 1 | 22.38 | 0.18 | 24.3 | 0.3 | -0.9 | 1.0 | 0.53 | 0.42 |
| J022236.7+422858 | 02 22 36.88 | +42 28 57.7 | 8.57 | 12.90 | 3.00 | -0.68 | 1 | 22.05 | 0.17 | 24.3 | -1.5 | 2.1 | 2.6 | 0.43 | 0.81 |
| J022259.1+422434 | 02 22 59.18 | +42 24 33.6 | 7.77 | 32.50 | 5.43 | 0.49 | 2 | 24.3 | … | 24.3 | … | … | … | 1.74 | … |
| J022334.0+422212 | 02 23 34.13 | +42 22 11.6 | 13.34 | 37.50 | 4.47 | 0.15 | 2 | 24.3 | … | 24.3 | … | … | … | 1.81 | … |
Note. — Table 3 is published in its entirety in the electronic version of the Astrophysical Journal. A portion is shown here for guidance regarding its form and content.