Magnetospheres and Disk Accretion in Herbig Ae/Be Stars
Abstract
We present evidence of magnetically-mediated disk accretion in Herbig Ae/Be stars. Magnetospheric accretion models of Balmer and sodium profiles calculated with appropriate stellar and rotational parameters are in qualitative agreement with the observed profiles of the Herbig Ae star UX Ori, and yield a mass accretion rate of . If more recent indications of an extremely large rotation rate for this object are correct, the magnetic field geometry must deviate from that of a standard dipole in order to produce line emission consistent with observed flux levels. Models of the associated accretion shock qualitatively explain the observed distribution of excess fluxes in the Balmer discontinuity for a large ensemble of Herbig Ae/Be stars, and imply typically small mass accretion rates, . In order for accretion to proceed onto the star, significant amounts of gas must exist inside the dust destruction radius, which is potentially problematic for recently advocated scenarios of “puffed” inner dust wall geometries. However, our models of the inner gas disk show that for the typical accretion rates we have derived, the gas should be generally optically thin, thus allowing direct stellar irradiation of the inner dust edge of the disk.
1 Introduction
The class of Herbig Ae/Be () stars was identified by Herbig (1960) in an attempt to find the analogues of T Tauri stars among objects of higher mass. This identification has been supported by many studies over the last several years. Observations of mm-wave emission suggest the presence of circumstellar disks similar to those of the low-mass classical T Tauri stars (CTTSs) (Mannings, Koerner, & Sargent 1997; Mannings & Sargent 1997; Testi et al. 2000). Dusty disk models can in principle explain the infrared excess emission of many stars (Hillenbrand et al. 1992; Chiang et al. 2000; Natta et al. 2001; Dullemond, Dominik, & Natta 2001, DDN01). In addition, imaging observations in scattered light (e.g., Grady et al. 1999) also provide evidence for flattened or disk-like large scale dusty structures around a few stars.
These studies naturally raise the question: are stars accreting from their disks? And if so, are the accretion rates high enough to modify stellar evolution, or to imply substantial migration of potential planet-forming material? The first attempt to derive accretion rates was made by Hillenbrand et al. (1992; HSVK92), who attempted to fit the observed infrared excess emission using steady accretion disk models and estimated much higher mass accretion rates () than typical of CTTSs. However, HSVK92 also needed to invoke an inner disk hole, of order AU in radius, to explain the decline in near-infrared excess emission shortward of m. Hartmann, Kenyon, & Calvet (1993; HKC) argued that the accretion could not stop indefinitely at this inner radius, and showed that accretion at the rates inferred by HSVK92 would render any inner disk optically thick, eliminating the decline in infrared excess at short wavelengths.
Natta et al. (2001) and DDN01 revisited this problem, this time developing models which explain the infrared excess emission of stars as the result of heating by irradiation from the central star, rather than local accretion energy release. These authors again assumed an inner disk hole to explain the decrease in near-infrared disk emission at short wavelengths, of size AU. The inner edge of the disk receives radiation from the star at near-normal incidence, and therefore becomes much hotter at a given radius than would be a geometrically thin, optically thick disk, irradiated obliquely. The increased heating thus causes the disk material at the inner edge to “puff up”. DDN01 suggested that this expanded inner disk edge can quantitatively explain the magnitude of the near-infrared emission in spectral energy distributions (SEDs), without any accretion energy release. The location of the inner disk edge and its emission in this model is roughly consistent with recent interferometric observations (Millan-Gabet, Schloerb, & Traub 2001), which indicate near-infrared H and K band emission at radial distances well beyond that predicted by standard geometrically thin, optically thick, irradiated disks.
While this model is attractive, the possibility of accreting material interior to the dust destruction radius must be addressed. All the low-mass T Tauri stars with near-infrared excesses exhibit accretion onto the central star, and it would be surprising if HAe/Be disks with similar properties were completely inert. Indeed, heating of the inner disk edge by stellar radiation alone is likely to raise temperatures to the point that the fractional ionization is high enough that the magnetorotational instability (MRI) thought to drive disk accretion can operate (e.g., Balbus & Hawley 1998; Gammie 1996). In CTTSs, stellar magnetospheres truncate the inner disk, but as pointed out by HKC, the inner disk edge in the DDN01 model lies at such large radii that magnetospheric truncation is implausible, and in any event falls well outside of the corotation radius (where the disk Keplerian angular velocity matches the stellar angular velocity), which would therefore prevent accretion (e.g., Shu et al. 1994). Beyond this, there is direct evidence for ballistic infall in some stars (§2; Sorelli, Grinin, & Natta 1996; Natta, Grinin, & Tambovtseva 2000), which implies that material must extend well inward of the dust destruction radius. DDN01 argue that their model will hold even if accretion proceeds through the dust destruction radius, as long as the accreting gas is optically thin, but this assumption places severe constraints on accretion parameters (HKC). Are accretion rates low enough that the inner accretion disk is optically thin? Or is there some other explanation of the near-infrared SED?
In this paper we investigate accretion in systems and its implications for inner disk structure. We begin by analyzing a specific object of special interest, UX Ori, in terms of a magnetospheric accretion model similar to that developed by Muzerolle et al. (1998, 2001). Next, we consider possible diagnostics of accretion from optical-ultraviolet continuum emission; these diagnostics limit accretion to rates much lower than those typically assumed by HSVK92. Finally, we investigate the inner disk structure in these systems. We show that for low accretion rates, the inner disk is likely to be optically thin, as assumed by the Natta et al. (2001) and DDN01 models; for somewhat higher accretion rates, the innermost disk may be optically thick but geometrically thin, allowing the direct irradiation of most of the “dust edge” of the disk. In this way we attempt to construct a more complete picture of systems.
2 Accretion rates
An important constraint on the optical depth in an accretion disk is the mass accretion rate ; higher generally leads to greater optical depths in the disk (HKC). In this section we consider constraints on from line profiles and UV/optical veiling, in the context of magnetospheric accretion. While early-type stars are thought to have much weaker magnetic fields due to dynamo activity than their cooler pre-main sequence counterparts, some main sequence A stars do exhibit ordered magnetic fields of strengths kG (Mestel 1975; Borra, Landstreet, & Mestel 1982), which would be sufficient to truncate inner disks at a few stellar radii (though not at the inner disk radii AU required by the DDN01 models; Hartmann 1999).
Moreover, magnetospheric accretion models are ideal for explaining high-velocity redshifted absorption in some stars (Sorelli et al. 1996, and references therein). An alternate explanation of the ubiquitous redshifted absorption features seen in a number of stars is infall of cometary bodies (e.g., Grinin et al. 1994, G94; Sorelli et al. 1996; Grady et al. 1999). In this scenario, star-grazing planetesimals will evaporate, and, given a favorable viewing angle, redshifted absorption of neutral sodium and other atoms with low ionization potentials can result. This hypothesis provides a potential link to the older Pic objects with debris disks. However, a separate source, such as a wind or accretion flow is required to explain the line emission observed in stars such as UX Ori. Moreover, the infall signatures, while variable, are not episodic as in Pic (e.g., Lagrange, Backman, & Artymowicz 2000, and references therein). Most significantly, Natta et al. (2000) found that the infalling gas is not strongly depleted in hydrogen, contrary to expectation if the source were evaporating comets (note that no circumstellar hydrogen absorption or emission has been observed in Pic; Lagrange, Backman, & Artymowicz 2000).
Below we consider magnetospheric accretion in more detail by modeling line profiles of one well-studied object, UX Ori. This star is particularly interesting for its large-amplitude optical variability, probably due to time-variable extinction by dust clouds (Grinin et al. 1994; Natta & Whitney 2000).
2.1 Line profiles
UX Ori was observed with the echelle spectrograph on the 4m telescope at KPNO on September 17, 1999. The spectrum has a resolution of , and a wavelength coverage of 4300 - 9200 Å, containing many features of interest such as the Balmer lines, He I, Na D, and the Ca II infrared triplet. The data were reduced using the standard IRAF echelle packages. In order to provide pure emission profiles, the spectrum of standard HD 1280 (spectral type A2, km s-1) was subtracted from the object spectrum, effectively removing photospheric absorption features (including the Balmer absorption wings). Figure 1 shows the continuum-normalized profiles of nine atomic lines. The observed line profiles for UX Ori exhibit characteristics similar to those seen before (G94; Natta et al. 2000; Grinin et al. 2001). Few lines are in emission, but many exhibit redshifted absorption at supersonic velocities as high as several hundred km s-1 (e.g., Balmer, Na D, Ca II), indicating mass infall onto the star.
We constructed magnetospheric accretion models for comparison with the observed profiles of UX Ori. The radiative transfer models are described in detail in Muzerolle et al. (2001). In summary, we assume a dipolar magnetic field geometry; gas accreting from a circumstellar disk falls ballistically along the field lines to the stellar surface. The density of the infalling gas is set by the geometry, velocity, and parameterized accretion rate. The inner and outer radius of the flow are free parameters (though the outer radius must be less than the disk corotation radius). Finally, we use a solid-body treatment for the rotation of the magnetosphere, including curvature of the field lines in the direction of rotation (Muzerolle et al. 2001).
Model line profiles were calculated in the same manner as for the T Tauri comparisons with rotation, using the same gas temperature constraints found in Muzerolle et al. (2001) (i.e., in the range 6000-12,000 K, varying inversely with the density). Corresponding to the observed properties of UX Ori, an A2 star, the model stellar parameters were changed to and . We investigated two different values for the stellar rotation velocity, 70 and 140 km s-1, following measurements from Böhm & Catala (1995) and Grinin et al. (2001), respectively, and given the expected edge-on orientation of the system. A more recent determination found km s-1 (Mora et al. 2002); the reason for these hugely discrepant values is unclear. We discuss the effects of rotation and its implications on the size of the accretion flow below.
Figure 2 shows a small sample of UX Ori model profiles, demonstrating the general effects of the accretion rate and inclination angle on the Balmer line profile shape and flux. Higher accretion rates produce broader emission wings from opacity broadening, as well as broader absorption from the increasing continuum opacity, which puts a limit on the peak flux such that the largest line fluxes occur at an intermediate accretion rate of . Larger inclination angles result in more significant line asymmetries, including the appearance of broad, low-velocity redshifted absorption produced by the occultation of the hot star by the cooler outer parts of the magnetosphere. This particular feature, along with the stronger blue emission peak, is almost always seen in H profiles of UX Ori and similar objects, and can only be explained by infalling material.
The constraints our models can ultimately place on the accretion rate are limited by uncertain constraints on other model parameters, especially the gas temperature. For example, in some cases the same emission levels can be reproduced by increasing the temperature and decreasing the density (i.e., ), or vice-versa, beyond the T Tauri temperature constraints. However, we find that cannot reproduce the observations at any temperature: at K, the gas continuum optical depth becomes significant, resulting in broad line absorption at H, while at lower temperatures, the H emission is much weaker than observed. On the other hand, values of much lower than also cannot reproduce the observed H emission, especially in the wings. In that case, simply increasing the gas temperature above that of the adopted constraints cannot result in much more line flux since the gas is already almost completely ionized. Ultimately, we believe a model-derived mass accretion rate estimate should be accurate to within about a factor of 5.
As already mentioned, another difficulty is the stellar rotation velocity, and the resulting limit on the size of the accretion flow. We find that the higher values of are problematic for the magnetospheric accretion model in that they result in very small corotation radii (2.1 and 1.6 , respectively, for km s-1), and, hence, extremely small accretion flows since accretion cannot take place outside of corotation. For such small magnetospheric radii, there is not enough emission volume to match the observed H emission with any other combination of parameters; an example is shown in Figure 3. We obtain the best match to the observations using a larger magnetospheric radius, 3 , roughly equivalent to the corotation radius for km s-1. We note that the actual geometry of any magnetic fields that may be present in Herbig Ae stars is completely unknown. A “pinched” or nonaxisymmetric geometry that deviates from a standard dipole may allow for a model with a higher rotation velocity that has a larger emission volume and can reproduce the observations (Fig. 4 shows one possibility). Calculating the radiative transfer for such a complicated geometry, however, is beyond the scope of this paper.
Figure 5 shows the observed and best model match profiles of H, H, and Na D for UX Ori. The magnetospheric infall models qualitatively match the observed line profiles in all three cases. The model accretion rate, , is consistent with the upper limit we derive from the lack of hot continuum excess (see next section). The inclination angle for these models is , in agreement with a nearly edge-on orientation of the system inferred from strong extinction events (e.g., G94). There is a central, slightly blueshifted absorption component in the Balmer lines that is not fit. This feature could be due to absorption from an accretion-driven wind exterior to the emission region (as seen in most CTTSs), which should be oriented roughly perpendicular to the accretion disk, resulting in small blueshifted absorption velocities given the edge-on orientation of the disk. The central absorption in the sodium lines is the interstellar component; there may also be some residual contamination from imperfectly subtracted night sky lines. The discrepancy in the level and velocity of the redshifted absorption components probably reflects deviations from the idealized flow geometry, as well as uncertainties in the gas temperature distribution. In any case, we feel the general agreement is reasonable, especially given the variable nature of the lines – note the similarity of these models to the multi-epoch spectra of UX Ori in G94. Similar H and Na D profiles have also been observed in spectra of BF Ori (de Winter et al. 1999), a Herbig Ae star which exhibits photometric variability similar to that of UX Ori. Finally, we also note that our accretion rate estimate is comparable to that derived by Tambovtseva et al. (2001) for a model in which the infalling material lies essentially in the equatorial plane.
As noted above, UX Ori is seen to to dim by up to several magnitudes in the optical (Herbst et al. 1983, 1994; Bibo & Thé 1990), accompanied by increased polarization (G94), which is interpreted as the result of an extinction event. During one such minimum, G94 obtained an optical spectrum. The H profile exhibited a larger emission equivalent width (though with a lower total flux), with no absorption components, and a single emission peak blueshifted by nearly 50 . Meanwhile, the redshifted absorption in the Na D lines almost completely disappeared. These authors hypothesized that an optically thick dust cloud obscured most of the star during the minimum, while at the same time covering up much of the line emitting region, causing the change in profile shapes. Grinin & Tambovtseva (1995) calculated H profiles in rough agreement with the observations using a model of the circumstellar obscuration, and assuming gas in the inner disk with a velocity distribution similar to our magnetospheric accretion models.
We attempted to simulate this obscuration with our models, to compare with both H and Na D. We included an opaque, nonemitting ”screen” extending above and below the disk to a height of about 2.7 , leaving just a small portion of the star and the magnetosphere unocculted. Such an occultation could be the result of density inhomogeneities or a warp in the disk or inner dust wall, enhanced by the nearly edge-on orientation of the system. The resulting profiles, shown in Figure 6, are in good agreement with the observations at photometric minimum. H has a much larger equivalent width, and shows a single peak blueshifted by about 50-100 . The redshifted absorption in the sodium lines has completely disappeared. This behavior is easily explained as a result of the geometry of the accretion flow. The part of the flow moving away from the observer covers much of the star at the inclination angle used here (); the projection of this gas against the hot star results in redshifted absorption. The simulated obscuration occults most of this region, and the only part of the flow still observed is that moving towards the observer from behind the star. Thus, H shows a strong, blueshifted emission peak, and sodium does not show redshifted absorption (the emission measure of sodium is not high enough to produce any emission in this case). The similarity of the profiles in Figure 6 to those shown in Figures 4 and 5 of G94 lend further support for magnetospheric accretion taking place in UX Ori.
2.2 Magnetospheric accretion shock
In the magnetospheric accretion model, material striking the stellar surface merges into the star through an accretion shock, from which most of the accretion luminosity is released. Models for the continuum emission from the accretion shock in CTTSs have been calculated by Calvet & Gullbring (1998, CG98). In these models, the gas in a plane-parallel accretion column, carrying energy flux , impacts the stellar surface and shocks to a temperature K, where and are the stellar mass and radius. The shock releases soft X-ray radiation which is absorbed by the accretion stream above and the stellar photosphere below the shock, producing optical and UV emission as it thermalizes. Approximately 3/4 of the emerging total column luminosity is emitted by the heated atmosphere below the shock, while the rest arises in the pre-shock region (CG98).
CG98 and Gullbring et al. (2000) show that the excess continuum flux that veils the photospheric lines of T Tauri stars in the visible, and produces fluxes orders of magnitude above photospheric fluxes in the UV, can be explained in terms of the emission of accretion columns carrying energy fluxes of the order of , with a small surface coverage of accretion columns, 1%, where is the filling factor. The high mass accretion rate stars, which show almost featureless spectra, could be explained with higher surface coverage, 10%.
If stars undergo magnetospheric accretion, then an accretion shock must be formed at the stellar surface. Here, we calculate accretion shock models for stellar parameters appropriate to early A accreting stars, and with energy fluxes similar to those characterizing the lower mass accreting stars, following similar procedures to those in CG98. The total flux emerging from the star is
| (1) |
where is the flux from the undisturbed photosphere and is the flux from the accretion columns, which in turn is the sum of the fluxes from the heated photosphere, , and the preshock region, . The parameter is the surface filling factor of accretion columns, estimated by the condition that the total luminosity carried by the accretion columns, , is a fraction of the accretion luminosity. This fraction is determined by the disk truncation radius, , through , with , and (CG98). In the calculations shown below, we take , consistent with the magnetospheric infall models (section 2).
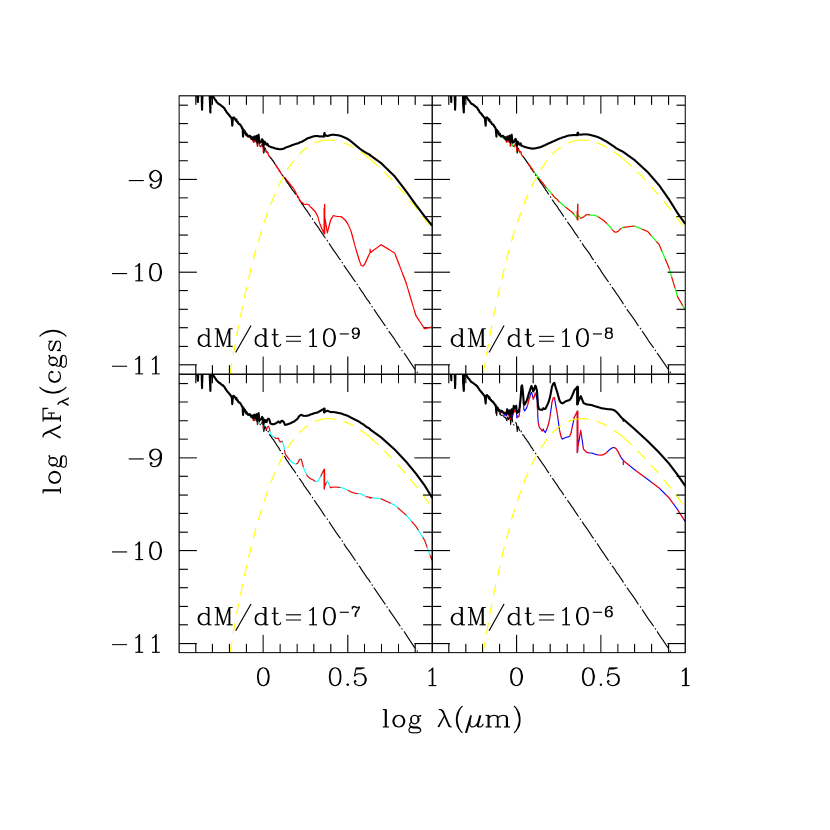
Figure 7 shows the effect of the accretion shock on the spectrum of an underlying photosphere for an A2 star, with mass and radius and . Each row of panels corresponds to a different column energy flux, with increasing from at the top to at the bottom. Each column corresponds to a different mass accretion rate onto the star, from at the left, to at the right. For a given mass accretion rate and energy flux, the accretion columns must have surface filling factors indicated in each panel in Figure 7. Since , for a given accretion luminosity, a lower energy flux results in a larger surface coverage. Since cannot be , high mass accretion rates cannot be achieved with low columns alone.
The contribution to the flux from the different zones in the accretion column, namely, the heated photosphere and the preshock region, are indicated in Figure 7, which also shows the emission from the undisturbed photosphere. The photospheric fluxes are taken from the stellar population library of Bruzual and Charlot (1993), while the fluxes from the heated photospheres are calculated here, assuming LTE and opacity sources as in CG98. This calculation does not include the hydrogen lines, which in a real spectrum pile up at the longward edge of the Balmer discontinuity, resulting in an effective shift of the wavelength of the jump, not present in the pure-continuum spectra of the heated photosphere.
The main contribution to the flux in the visible and near-UV in Figure 7 comes from the optically thick heated photosphere below the shock. The radiative flux emerging per unit area from this region is , where is the reflected irradiating flux from the shock regions above the optically thick photosphere, and the intrinsic stellar flux, entering the photosphere from below (CG98). In turn, and ; thus, if the energy fluxes carried by the accretion columns in stars are similar to those in CTTSs, , then the accretion energy input in the heated photosphere is comparable to or smaller than the intrinsic stellar flux.
The similarity between the two fluxes entering the heated photosphere from above and below means that the effective temperature of the heated photosphere, , is only slightly higher than that of the undisturbed photosphere, as shown in Figure 7. Since decreases as increases for a fixed mass accretion rate, the contribution to the emergent flux from the heated photosphere, (cf. eq.(1)), decreases as increases. Note that even if the emission from the heated photosphere and the undisturbed photosphere are separated by some kind of “deveiling” procedure, the emission from the heated photosphere does not give a direct measurement of the accretion energy, except for very high values of . This situation contrasts sharply from that in the cooler CTTSs, for which , and accretion dominates the column emission.
However, there is a difference between the emission from the heated photosphere region and that from the undisturbed photosphere. The temperature gradient in regions with in the heated photosphere is shallower than that in the undisturbed photosphere, because of the extra heating from the shock above it. As a consequence, absorption features formed in the heated photosphere will become weaker, and even disappear for high values of , in which the heated photosphere is nearly isothermal. So, for high objects, with large , the absorption lines will become increasingly veiled. The weakening of absorption features can be seen in Figure 7 comparing the Balmer jump (in absorption) in the heated photosphere for increasing values of . The Balmer jump becomes weaker, and disappears for . As a result, the Balmer jump in the total emergent fluxes is increasingly filled in as increases and the mass accretion rate, i.e. , increases.
This property suggests that the strength of the Balmer jump may provide a measure of the mass accretion rate in HAe/Be stars. Unfortunately, this is the least well-measured property of these stars. Garrison (1978, G78) carried out narrow (40 Å) band photometry from 3400 to 8300 Å for a sample of HAe/Be stars, and noted that the Balmer discontinuity was smaller than in main sequence stars of the same spectral type. G78 defined a measurement of the strength of the Balmer discontinuity, , as the difference in the magnitudes at both sides of the discontinuity, and a measurement of the excess emission, , as the difference of for a given star to that of a standard of the same spectral type. Figure 8 shows the distribution of values of for stars with in Garrison’s sample. We plot two histograms: one for the total sample of 16 stars 111We have excluded Z CMa, which is an FU Orionis object (Hartmann & Kenyon 1996).; the other for the subsample of 12 stars with spectral types B5 - A5. The two distributions are essentially the same. Figure 8 also shows the predicted excess in the Balmer discontinuity for shock models with mass accretion rates between and , and energy fluxes to . We have calculated from the ratio of fluxes at 4000Å and at 3640Å, to make it consistent with Garrison’s measurements. The Balmer jump excesses indicate low mass accretion rates for most of the stars in the sample. As stressed by G78, is a reddening independent indicator, a property specially important for the “UX Ori” stars, affected by obscuration events in which it is difficult to disentangle absorbed and scattered light (cf. Natta & Whitney 2000).
A few of the stars in Figure 8 have Balmer jump excesses consistent with high mass accretion rates, . For these stars, G78 finds excess fluxes relative to the photosphere beyond Å. Our models predict excesses at long wavelengths, due to the optically thin emission of the pre-shock region, but the excesses are small. For instance, a model with has 0.1 mag excess in and 0.15 mag excess in . Such small excesses would be difficult to disentangle from observational errors and uncertainties due to spectral type mismatches, as well as excess emission from the disk.
As discussed, spectra of HAe/Be stars with high mass accretion rates should have weaker, or “veiled”, absorption lines than standard stars of the same spectral type. The abnormally weak features would be formed in the upper layers of the heated photosphere, and each line could be affected differently, depending on its exact height of formation. This is different from the case of low mass stars, where a “veiling continuum” affects all photospheric lines in a given wavelength interval, and can be easily extracted by subtraction of a standard spectrum from the target. For large in HAe/Be stars, one would expect a large scattering in the values of the spectral types determined using different absorption features. Valenti, Johns-Krull, & Linsky (2000), in a study of the IUE short wavelength spectra of a sample of 74 HAe/Be stars, find that 70% of the sample have spectral features in the ultraviolet consistent with those determined from optical spectra. In the case of UX Ori, discussed in section 2, the optical spectrum of UX Ori shows that only H is in emission, and there is no veiling in the absorption lines; analysis of the spectra as in Hernandez et al. (2002) yields a spectral type of A2 1 subclass, using as indicators the Ca II K line, Fe II lines, Ca I lines, and H. On the other hand, Grady et al. (1995) find that the 1560Å photoionization edge in their IUE minimum light spectrum of UX Ori is consistent with spectral types A1-A2. The consistency of spectral type indicators from the optical to the ultraviolet stresses the lack of veiling in the absorption lines and indicates that the mass accretion rate is .
In addition to continuum, the accretion column is expected to have and emission spectrum of highly ionized metals (for instance, Si IV 1394, Si IV 1403, C IV 1549, C III 1909). These lines are observed in HAe/Be stars with spectral types later than A2, for which the weak photospheric emission below 1600 Å does not obliterate the lines (Valenti et al. 2000); their strengths seem to be comparable to those of CTTSs. For hotter stars, these lines may appear in absorption, and even have a wind component observed at high resolution (Praderie et al. 1986; Bohm et al. 1996; Bouret et al. 1997; Grady et al. 1999). The wind may also be responsible for spectral features that appear deeper than expected from their spectral types in some regions of low resolution ultraviolet spectra (mostly corresponding to blends of Fe II lines, Valenti et al. 2000). In particular, we note that free-free emission from the wind may be responsible for the continuum excess between 6500 Å and m in the stars with large Balmer jump excesses (Garrison 1978). Neither present shock models (see Fig. 7) nor wall emission (see below, section 3) can explain this excess. Appropiate modeling of the wind region is required to test this hypothesis further, and yield measurements of mass loss rates, thus providing lower limits to the mass accretion rates.
3 Accretion disk models
Having determined that disks are accreting in stars, we now examine the structure of the inner disks in order to address another question posed in the introduction, namely, whether or not they are optically thin, so that (1) they do not produce a large flux excess over the photosphere at near infrared wavelengths, and (2) they allow stellar radiation to reach the inner wall postulated by Natta et al (2001), Tuthill, Monnier & Danchi (2001) and DDN01 to explain the near-IR photometric excess and interferometric measurements. To illustrate the issues involved, we have calculated pure gaseous models for the inner disk regions of a typical system, with assumptions as those of D’Alessio et al. (1999, 2001).
Optically-thin dust cannot be present interior to the dust destruction radius, , due to the radiation field of the central object. In principle dust could exist if it were “shielded” from the stellar radiation by gas opacity, but in such a case the “irradiation surface”, defined as the surface at which the optical depth to the star (at characteristic frequencies) is , has to be determined by the gas opacity. Thus any dust present at would have to be below this surface. We have simplified the already complex treatment of this gaseous layer (see below) by assuming that dust is not present anywhere interior to the irradiation surface.
If the sublimation temperature for silicates is taken as 1500 K and the dust wall receives radiation frontally, as proposed by Natta et al. (2001) and DDN01, then the wall would be at a radius AU for the effective temperature and radius of a typical Ae star (see DDN01). The inner gaseous disk then corresponds to the region between the magnetospheric radius AU and 0.5 AU. We calculate pure gaseous irradiated accretion disk models for this region, using the typical stellar parameters.
The vertical temperature structure is calculated using the formulation described by Calvet et al. (1991, 1992), modified to include viscous dissipation, which is quantified using the prescription (Shakura & Sunyaev 1972). The stellar radiation field is treated as a parallel beam impinging on the disk surface at an angle cos relative to the normal. A fraction of the energy in the incident beam is scattered, maintaining the same frequency range as the stellar radiation field. The other fraction of the incident energy is absorbed by disk material, and we assume it is re-emitted at a frequency range characteristic of the local temperature. In the Calvet et al. (1991, 1992) formulation, the interaction between the direct and scattered stellar and disk radiation fields and the material is described by mean opacities, which we calculate self-consistently from monochromatic opacities using relevant sources for the conditions of the inner gaseous disk.
For an star, approximately half of the stellar radiation is emitted at wavelengths shorter than 0.45 m, in the UV. In this range, we considered absorption due to H2 (B-X, C+-X and C--X, Abgrall et al. 1993) and CO (fourth positive system, Kurucz 1976) transitions, calculated with LTE molecular abundances. We found that the opacity due to the superposition of the rotational lines of CO and H2 is so large for that most of the stellar UV radiation is absorbed in the uppermost layers of the disk. A fraction of this UV radiation (with 0.11 m) will photodissociate H2 and CO (see for instance van Zadelhoff et al. 2003). Another fraction will be absorbed in CO and H2 lines below the photodissociated layer. To calculate the structure of the gaseous inner disk, we make the crude approximation that the incident stellar radiation with does not penetrate and heat the disk below a geometrically thin upper layer. In other words, we assume that all this radiation is absorbed and/or scattered by photodissociated molecules, or scattered in high-opacity lines that become saturated at the uppermost layers of the disk atmosphere.
The remaining stellar radiation at is mostly absorbed by TiO. We have incorporated the opacities of the , , , , , , and systems (Jörgensen 1994). We also included the opacity due to CN and CH (Kurucz 1995), although it turned out to be unimportant in the disk temperature range ( K). At the characteristic disk wavelengths, the most important opacity sources are red and infrared bands of H2O (Auman 1967), pure-rotational bands of H2O and OH (Tsuji 1966), and transitions of the electronic ground state of CO (Kirby-Docken & Liu 1978). We assume LTE and calculate the populations of TiO, H2O, CO2, C2, N2, O2, CH, CN, CO, NH, NO, OH, H2, H, H-, H0 using the method described by Mihalas (1967). The scattering of stellar radiation is mostly due to Rayleigh scattering of H2, with smaller contributions from Rayleigh scattering of H, He (Dalgarno 1962) and electronic scattering.
Even with all these opacity sources, there is a lack of absorption in the wavelength range between . In this interval, radiation interacts with the gas only through Rayleigh scattering. Since scattering processes do not contribute to the disk heating, we make the additional approximation that only half of the incident stellar flux (mostly with or in the gaps between lines) contributes to the heating of the interior of the disk.
The temperature as a function of the Rosseland mean optical depth , the mean scattering coefficient, and the ratio between the opacity to the stellar radiation and the Rosseland mean opacity, , are calculated at each height and radius using equation (14) from Calvet et al. (1991), with a simultaneous solution of the hydrostatic equilibrium equation in the vertical direction. In order to evaluate the mean scattering coefficient and (both assumed to be constant through the disk atmosphere), we computed the opacities at the upper temperature and at a constant pressure dyn/cm2, assuming both to be representative values for the disk upper atmosphere. Given the proximity of the gaseous inner disk zone to the central star (), the curvature of the irradiation surface is not an important factor in the calculation of the stellar irradiation. So, we take the irradiation flux and incident angle as those of a flat disk,
| (2) |
with
| (3) |
the cosine of the angle between the incoming stellar beam and the normal to the disk. The factor is introduced to account for our assumption that only half of the stellar radiation heats the regions of the disk below the uppermost layer (i.e., only half of the stellar radiation has m).
With these assumptions and procedures, we calculate gaseous disk models for mass accretion rates, and , assuming a constant viscosity parameter . The resultant temperature structures of these models are shown in Figure 9. As shown by the dotted lines in Figure 9, the optically thin upper atmosphere has a temperature around 2000 K, for all values of . This is the equilibrium temperature corresponding to radiative heating by stellar radiation with and radiative cooling, for a constant pressure of dyn/cm2. This nearly constant temperature is due to the fact that in this temperature range for the assumed constant pressure, the cooling increases with temperature much faster than the heating, producing a thermostatic effect. Although the upper layer temperature is similar to or lower than the condensation limit for silicates, there cannot be dust in these (optically thin) regions because a dust grain would be heated by the stellar radiation to a temperature above its sublimation limit. As we have already mentioned, dust could exist at deeper layers if it were shielded by upper, optically thick gaseous layers; however, here we assume that the inner disk is free of dust at every height.
The Rosseland mean optical depth of the gaseous inner disk increases with . For , the disk is optically thin, and the midplane temperature is similar to or lower than the upper atmospheric temperature, as shown in Figure 9. At higher mass accretion rates, the innermost parts of the disk become increasingly optically thick. The radius inside which the disk is optically thick to its own radiation increases with , reaching 0.25 AU for . As a result, the midplane temperature increases with as shown in Figure 9. For , it becomes higher than K in the innermost regions, corresponding to the thermally unstable regime where hydrogen is partially ionized and the dominant opacity source is (Bell & Lin 1994).
Next, we calculate the height of the surface above the midplane, where the mean optical depth to stellar radiation is unity, . In our previous modeling efforts with dusty disks, we have used the Planck mean optical depth to estimate ; in the present case, the Planck mean optical depth to the stellar radiation (using the incidence angle for a perfectly flat disk) is larger than , even for a low mass accretion rate like . However, the Planck mean opacity is not representative of the mean opacity for these cool gaseous disks; since the absorption of radiation is mostly due to a myriad of molecular rotational lines, stellar radiation is transported through the disk in the opacity gaps between lines. Thus, we have used a harmonic mean similar to the Rosseland mean, which gives a better representation of the actual transport of radiation. Figure 10 shows the height of the surface for models in Figure 9, calculated with the harmonic mean opacity to the stellar radiation. We find that for , the harmonic mean optical depth to the stellar radiation is less than 1 for AU. At AU, 0.008, 0.02, 0.03 AU for , respectively. This corresponds to 1, 2.6, 3.3, where is the scale height evaluated at the midplane temperature of each of these disk models (cf. Figure 9).
At the dust condensation radius, the dust becomes the most important opacity source. For comparison with the gaseous disk, we estimate the height where the radial optical depth to the stellar radiation is one, behind the dusty wall. We assume that the gaseous inner disk does not absorb stellar radiation in the path between the star and the wall significantly (confirmed below). To calculate the optical depth to the stellar radiation in a disk annulus of radial thickness , we assume that the annulus is isothermal with a temperature 1500 K. Thus, the density can be approximated by a Gaussian , where the midplane density is , the surface density is , the scale height is , the sound speed is , and is the Keplerian angular velocity. The optical depth to the stellar radiation is
| (4) |
where is the radial distance from the star to a point in the disk, such that , and is the total mean dust opacity to the stellar radiation. Assuming that , , and are constant from to , the integral can be approximated by
| (5) |
The mean density can be estimated as an average of the densities at and at , where , i.e.,
| (6) |
With , and estimating by assuming that the dusty wall contains grains with a maximum size , the heights where are 3.8, 4.3, 4.8 and 5.3, corresponding to , respectively. These values are roughly consistent with the value found by DDN01, , assuming an arbitrary power law surface density for the disk.
The temperature of the dust wall is about 2 to 3 times higher than the temperature of the gas disk at the same radius (cf. Figure 9). Thus, 10, 4, 3 for , as indicated in Figure 10. The fraction of the surface of the dust wall that receives direct stellar radiation is 1, 0.9, 0.8, 0.7 for , and the portion of the wall in contact with the optically thick (to the stellar radiation) gaseous disk is small. Thus, at least for , allowance for the stellar flux that cannot reach the wall because of absorption in the gaseous inner disk represents only a small correction to the Natta et al. (2001) and DDN01 treatments.
The flux from the inner gaseous disk, in the most optimistic case of a pole-on orientation, is shown in Figure 11. We also include the contribution from the wall, which we have estimated with a blackbody of temperature 1500 K and an emitting area covering a solid angle 250 times the stellar solid angle (as expected for a vertical wall with height AU, seen almost edge-on but without occultation of the emitting region). This blackbody contribution roughly matches typical HAe spectra (see HSVK92). The disk emission depends on ; in particular, the total emergent flux from the gaseous inner region in the -band, relative to the star, is for . The inner gaseous zones of disks with are optically thick, and emit a large continuum excess in the near-IR, in agreement with Hartmann et al. (1993). For , the contribution to the total flux from the inner gaseous disk is negligible. The inner disk emits rotational-vibrational CO bands around 2.3 for ; however, these CO emission bands are obliterated by the continuum emerging from the outer disk and the wall, in agreement with observed near-IR spectra of Herbig Ae/Be stars (unpublished IRTF SpeX data; Ishii et al. 2003).
4 Discussion
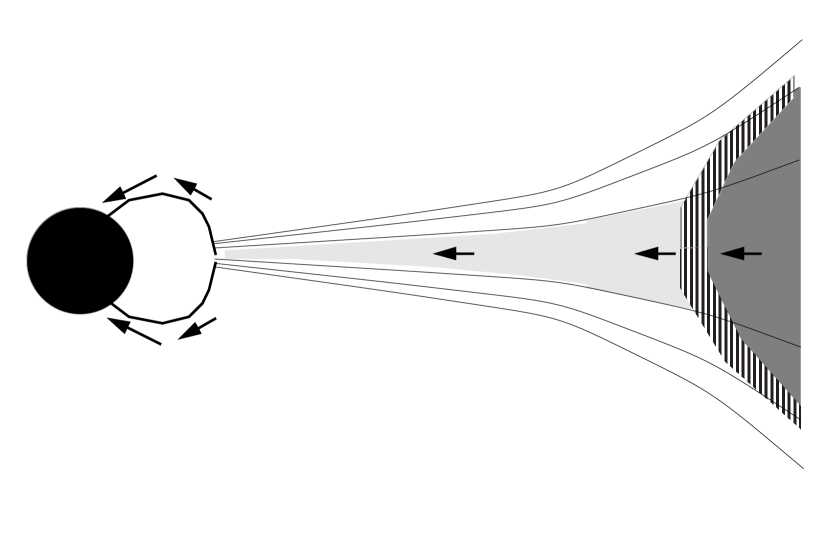
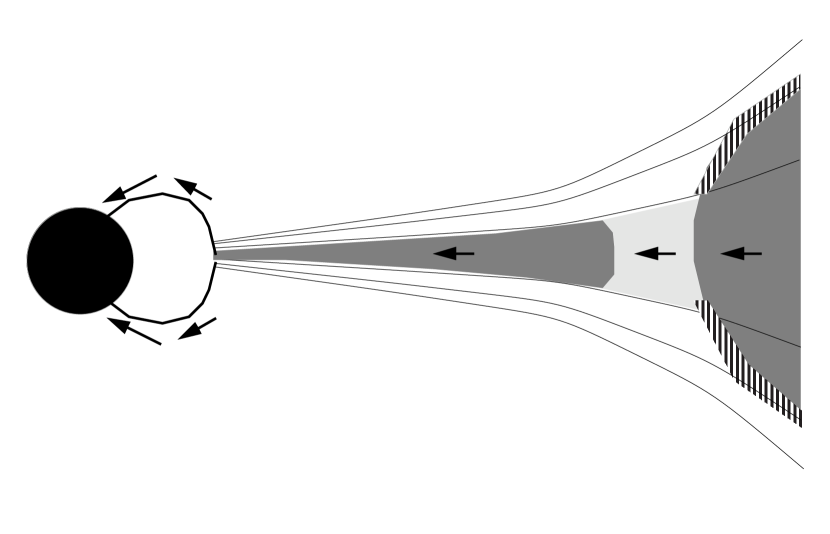
We have shown that the magnetospheric accretion model can account for the overall line profiles of UX Ori and, by extension, similar systems. This requires substantial amounts of accreting gas which lie well within the radius at which dust is destroyed. Although we presume that the accreting gas departs from a disk structure within a few stellar radii of the photosphere, accounting for the large radial velocities observed, the co-rotation radius within which such magnetospheric accretion can occur is well interior to the dust destruction radius. Therefore, there must be a gaseous accretion disk between the dust opacity-dominated outer disk, responsible for most of the infrared excess emission, and the star (see Fig. 12). We have shown that for plausible parameters, this inner accretion disk can be optically thin. Even at somewhat higher accretion rates, an optically-thick inner disk can be geometrically thin, and thus not block most of the incident stellar radiation from reaching the outer dust disk This is consistent with the basic picture of Natta et al. (2000) and DDN01, in which there is a disk “wall” where dust sublimates.
Our model, in which an accreting gas disk extends interior to the dust destruction radius, may help address or reduce stability problems. As pointed out by DDN01, the rapid increase in scale height of their model implies an inward radial gas pressure force at the dust destruction radius. DDN01 suggest that this might be countered by having the inner regions rotating faster than Keplerian, but this seems unlikely. The problem is alleviated to some extent in our model, in which there is an inner gas disk; the scale height variation is less than the photospheric surface variation.
Our claim of magnetospheric accretion in UX Ori-type Herbig Ae/Be stars leads to the question of where the requisite magnetic activity originates. This is still far from clear, as the motivation for theoretical investigation has been lacking. Strong magnetic fields on the order of several kG have been measured in the lower-mass T Tauri stars (e.g. Johns-Krull, Valenti, & Koresko 1999). However, similar measurements for HAe/Be stars may prove exceedingly difficult, due to the significant rotational broadening of photospheric absorption lines. Given the parameters of our best line profile model, and using the relations given in Königl (1991), we estimate a possible magnetic field strength of 200 G (roughly half that if the small magnetospheric size is used) for UX Ori. We point out that at a younger age, further back along their radiative tracks, HAe stars once had cooler photospheres, and likely sustained convective dynamos (for example, intermediate-mass T Tauri stars such as T Tau and SU Aur, which have clear accretion signatures, may eventually become what we would classify as Herbig Ae stars). Thus, their current magnetic activity may be a relic of this earlier time. Detailed studies of the timescales of magnetic decay in such objects are needed in order to investigate this hypothesis further.
This work was supported in part by NASA grant NAG5-9670. The authors acknowledge useful discussions and assistance from Vladimir Escalante, Javier Ballesteros, Antonella Natta, and Kees Dullemond. PD acknowledges grants from DGAPA and CONACyT.
References
- (1)
- (2) Balbus, S.A. & Hawley, J.F. 1998, Rev. Mod. Phys., 70, 1
- (3)
- (4) Bibo, E. A. & Thé, P. S. 1990, A&A, 236, 155
- (5)
- (6) Böhm, T. et al. 1996, A&AS, 120, 431
- (7)
- (8) Böhm, T. & Catala, C. 1995, A&A, 301, 155
- (9)
- (10) Borra, E.G., Landstreet, J.D., & Mestel, L. 1982, ARA&A, 20, 191
- (11)
- (12) Bouret, J.-C., Catala, C., & Simon, T. 1997, A&A, 328, 606
- (13)
- (14) Bruzual A., G. & Charlot, S. 1993, ApJ, 367, 126
- (15)
- (16) Calvet, N. 1997, in Herbig-Haro Flows and the Birth of Low-Mass Stars, IAU Symposium 182, eds. B. Reipurth & C. Bertout, p. 417
- (17)
- (18) Calvet, N. & Gullbring, E. 1998, ApJ, 509, 802
- (19)
- (20) Calvet, N., Magris, G. C., Patino, A., & D’Alessio, P. 1992, Rev. Mexicana Astron. Astrofis., 24, 27
- (21)
- (22) Calvet, N., Patino, A., Magris, G. C., & D’Alessio, P. 1991, ApJ, 380, 617
- (23)
- (24) Chiang, E. I., Joung, M. K., Creech-Eakman, M. J., Qi, C., Kessler, J. E., Blake, G. A., & van Dishoeck, E. F. 2001, ApJ, 547, 1077
- (25)
- (26) D’Alessio, P., Calvet, N., & Hartmann, L. 2001, ApJ, 553, 321
- (27)
- (28) D’Alessio, P., Calvet, N., Hartmann, L., Lizano, S., & Cantó, J. 1999, ApJ, 527, 893
- (29)
- (30) de Winter, D., Grady, C. A., van den Ancker, M. E., Pérez, M. R. & Eiroa, C. 1999, A&A, 343, 137
- (31)
- (32) Dullemond, C. P., Dominik, C., & Natta, A. 2001, ApJ, 560, 957
- (33)
- (34) Edwards, S., et al. 1993, AJ, 106, 372
- (35)
- (36) Gammie, C. F. 1996, ApJ, 457, 355
- (37)
- (38) Garrison, L. M. 1978, ApJ, 224, 535
- (39)
- (40) Grady, C. A., Pérez, M. R., Bjorkman, K. S., & Massa, D. 1999, ApJ, 511, 925
- (41)
- (42) Grady, C. A., Perez, M. R., The, P. S., Grinin, V. P., de Winter, D., Johnson, S. B., & Talavera, A. 1995, A&A, 302, 472
- (43)
- (44) Grady, C. A., Woodgate, B., Bruhweiler, F. C., Boggess, A., Plait, P., Lindler, D. J., Clampin, M., & Kalas, P. 1999, ApJ, 523, L151.
- (45)
- (46) Grinin, V. P., Kozlova, O. V., Natta, A., Ilyin, I., Tuominen, I., Rostopchina, A. N., & Shakhovskoy, D. N. 2001, A&A, 379, 482
- (47)
- (48) Grinin, V. P. & Tambovtseva, L. V. 1995, A&A, 293, 396
- (49)
- (50) Grinin, V. P., The, P. S., de Winter, D., Giampapa, M., Rostopchina, A. N., Tambovtseva, L. V., & van den Ancker, M. E. 1994, A&A, 292, 165 (G94)
- (51)
- (52) Gullbring, E., Calvet, N., Muzerolle, J., & Hartmann, L. 2000, ApJ, 544, 927
- (53)
- (54) Hamann, F. & Persson, S. E. 1992, ApJS, 82, 285
- (55)
- (56) Hartmann, L. 1999, NewA, 43, 1
- (57)
- (58) Hartmann, L., Hewett, R., & Calvet, N. 1994, ApJ, 426, 669
- (59)
- (60) Hartmann, L. & Kenyon, S. J. 1996, ARA&A, 34, 207
- (61)
- (62) Hartmann, L., Kenyon, S. J., & Calvet, N. 1993, ApJ, 407, 219
- (63)
- (64) Herbst, W., Holtzman, J. A. & Klasky, R. S., 1983, AJ, 88, 1648
- (65)
- (66) Hillenbrand, L. A., Strom, S. E., Vrba, F. J., & Keene, J. 1992, ApJ, 397, 613
- (67)
- (68) Hollenbach, D. J., Yorke, H. W., & Johnstone, D. 2000, in Protostars and Planets IV, eds. V. Mannings, A.P. Boss, & S.S. Russell (Tucson: University of Arizona Press), 401
- (69)
- (70) Hutchinson, M. G., Albinson, J. S., Barrett, P., Davies, J. K., Evans, A., Goldsmith, M. J., & Maddison, R. C. 1994, A&A, 285, 883
- (71)
- (72) Ishii, M., Tamura, M., Nagata, T., Sato, S., Yao, Y., Jiang, Z., & Yanagisawa, K. 2003, American Astronomical Society Meeting, 202
- (73)
- (74) Johns-Krull, C. M., Valenti, J. A., & Koresko, C. 1999, ApJ, 516, 900
- (75)
- (76) Königl, A. 1991, ApJ, 370, L39
- (77)
- (78) Kurucz, R. L. 1995, ASP Conf. Ser. 78: Astrophysical Applications of Powerful New Databases, 205
- (79)
- (80) Lagrange, A., Backman, D., & Artymowicz, P. 2000, in Protostars & Planets IV, eds. V. Mannings, A. P. Boss, & S. R. Russell (Tucson: University of Arizona Press), 639
- (81)
- (82) Landstreet, J. D. 1992, A&A Rev., 4, 35
- (83)
- (84) Mannings, V. & Sargent, A. I. 1997, ApJ, 490, 792
- (85) Mannings, V., Koerner, D. W., & Sargent, A. I. 1997, Nature, 388, 555
- (86)
- (87) Mestel, L. 1975, in IAU Colloquium 32, Physics of Ap Stars, eds. W.W. Weiss, H. Jenkner & H.J¿ Wood (Vienna; Universitatssternwarte Wien), 1
- (88)
- (89) Millan-Gabet, R., Schloerb, F. P., & Traub, W. A. 2001, ApJ, 546, 358.
- (90)
- (91) Mora, A, Natta, A., Eiroa, C., et al. 2002, A&A 393, 259
- (92)
- (93) Muzerolle, Calvet, N., & Hartmann, L. 1998, ApJ, 492, 743
- (94)
- (95) - 2001, ApJ, 550, 944
- (96)
- (97) Muzerolle, Hartmann, L., & Calvet, N. 1998a, AJ, 116, 455
- (98)
- (99) - 1999b, AJ, 116, 2695
- (100)
- (101) Natta, A., Grinin, V. P. & Tambovtseva, L. V. 2000, ApJ, 542, 421
- (102)
- (103) Natta, A., Prusti, T., Neri, R., Thi, W. F., Grinin, V. P., & Mannings, V. 1999, A&A, 350, 541
- (104)
- (105) Natta, A., Prusti, T., Neri, R., Wooden, D., Grinin, V. P., & Mannings, V. 2001, A&A, 371, 186
- (106)
- (107) Natta, A. & Whitney, B. A. 2000, A&A, 364, 633.
- (108)
- (109) Praderie, F., Catala, C., Simon, T., & Boesgaard, A. M. 1986, ApJ, 303, 311
- (110)
- (111) Sitko, M. L., Halbedel, E. M., Lawrence, G. F., Smith, J. A., & Yanow, K. 1994, ApJ, 432, 753
- (112)
- (113) Sorelli, C., Grinin, V. P., & Natta, A. 1996, A&A, 309, 155
- (114)
- (115) Tambovtseva, L. V., Grinin, V. P., Rodgers, B., & Kozlova, O. V. 2001, Astronomy Reports, 45, 442
- (116)
- (117) Testi, L., Natta, A., Shepherd, D. S., & Wilner, D. J. 2001, ApJ, 554, 1087
- (118)
- (119) Thi, W. F. et al. 2001, ApJ, 561, 1074
- (120)
- (121) Tuthill, P. G., Monnier, J. D., & Danchi, W. C. 2001, Nature, 409, 1012
- (122)
- (123) Valenti, J. A., Johns-Krull, C. M., & Linsky, J. L. 2000, ApJS, 129, 399
- (124)
- (125) van Zadelhoff, G-J., Aikawa, Y., Hogerheijde, M.R., van Dishoeeck, E.F. 2003, A&A, 397, 789
- (126)