The Fundamental Plane Evolution of Active Galactic Nucleus Host Galaxies
Abstract
We measured the stellar velocity dispersions of 15 active galactic nucleus (AGN) host galaxies at redshifts as high as . Combining these with published velocity dispersion measurements from the literature, we study the Fundamental Plane of AGN host galaxies and its evolution. BL Lac hosts and radio galaxies seem to lie on the same Fundamental Plane as normal early-type galaxies. The evolution of the mass-to-light ratio of AGN host galaxies shows a similar trend to that observed in normal early-type galaxies, consistent with single-burst passive evolution models with formation redshifts . The lack of a significant difference between normal and AGN host galaxies in the Fundamental plane supports the “Grand Unification” picture wherein AGNs are a transient phase in the evolution of normal galaxies. The black hole masses of BL Lac objects and radio galaxies, derived using the mass – dispersion relation, are similar. The black hole mass is independent of BL Lac type. The local black hole mass – host galaxy luminosity relation of our sub-sample at is similar to that of local normal and radio galaxies, but is less well defined at higher redshift due to the luminosity evolution of the host galaxies.
1 Introduction
Active galactic nuclei (AGNs) and inactive galaxies seem to be closely connected. Virtually all local massive galaxies have central black holes (Kormendy & Gebhardt 2001), suggesting AGNs are a transient phase in the evolution of normal galaxies (Cavaliere & Padovani 1989). This “Grand Unification” hypothesis is supported by several lines of evidence. First, the peak of black hole mass growth, which manifests the maximum AGN activity at , is similar to the peak of the star formation rate (e.g., Dunlop 1999; Miyaji, Hashinger, & Schmidt et al. 2000, Wolf et al. 2003a, Wolf et al. 2003b). In individual AGNs, starburst activity is not uncommon, and may be more prevalent than in normal galaxies (Tadhunter, Dickson & Shaw 1996; Melnick, Gopal-Krishna & Terlevich 1997; Aretxaga et al. 2001). This apparent association of star formation and AGN activity suggests that the formation of the galaxy bulge could simultaneously trigger star formation and significant accretion onto a seed black hole.
Second, the total local black hole mass, estimated from inactive black holes at the center of the present-day galaxies, is comparable to the black hole mass integrated over the Hubble time using the quasar luminosity function (Yu & Tremaine 2002), indicating that dormant black holes in the present-day Universe are plausibly the end-products of quasar activity (see also Cavaliere & Padovani 1989).
Third, black hole mass appears to correlate with galaxy mass in a sample of nearby, well-studied galaxies (Ferrarese & Merritt 2000; Gebhardt et al. 2000a), with black hole mass measured from spatially resolved kinematics. This relation, between black hole mass () and bulge stellar velocity dispersion (), indicates that somehow the small-scale black hole knows the large-scale galaxy properties, and vice versa, further supporting a physical connection between galaxy formation and black hole accretion.
Finally, AGN host galaxies show the same - correlation (Gebhardt et al. 2000b; Ferrarese et al. 2001). In this case, black hole masses are derived from reverberation mapping results, which gives one of the most reliable AGN black hole mass measurements (Peterson 1993), suggesting the overall formation processes for black holes and galaxies are the same for normal and AGN host galaxies.
Accordingly, we started a program to test the Grand Unification hypothesis, by studying AGN host galaxies directly. Specifically, we investigate the Fundamental Plane of AGN host galaxies, to see whether they obey the same tight correlation among half light radius (), surface brightness (), and central velocity dispersion () as normal galaxies. Already it is known that early-type AGN host galaxies, especially radio-loud AGN hosts, follow the Kormendy relation, which is a projection onto the – plane (Taylor et al. 1996; Urry et al. 2000; O’Dowd, Urry & Scarpa 2002; Dunlop et al. 2003). However, this two-parameter relation has larger scatter than the Fundamental Plane (Dressler et al. 1987; Djorgovski & Davis 1987; Faber et al. 1987), and lacks the third dimension, namely, velocity dispersion. The empirical scaling relation, among , , and observed in normal galaxies is interpreted as evidence that early-type galaxies form a homologous family with a power-law relation between galaxy mass and the mass-to-light ratio. Due to the very low internal scatter, the Fundamental Plane is often used to study galaxy formation (Franx 1993; Jorgensen et al. 1996; van Dokkum & Stanford 2003), and it is a much more direct probe of the similarities and differences between normal and AGN host galaxies. Thus, we initiated a program to measure in the host galaxies of AGN.
Ultimately the Fundamental Plane must be probed at moderate to high redshift, where AGN are more numerous. Here we push to , roughly three times as high as most previously published measurements (Bettoni et al. 2001; Barth et al. 2002; Falome et al. 2003). Specifically, we report observations and velocity dispersion measurements for 15 AGN host galaxies from to . Combining with 11 published dispersion measurements, we investigate whether early-type AGN host galaxies lie on the same Fundamental Plane as normal galaxies, and how the mass-to-light ratio of AGN hosts evolves relative to that of normal galaxies. In § 2, we describe the observations and velocity dispersion measurements, and in § 3, the Fundamental Plane and its evolution. In § 4, we discuss black hole masses, and in § 5 we present the discussion and conclusions. The correlations of black hole mass with other AGN properties will be discussed in detail in a subsequent paper (Woo et al. 2004). We adopt a cosmology with , , and km sec-1 Mpc-1.
2 OBSERVATIONS and DATA REDUCTION
2.1 Sample Selection and Observation
AGN host galaxies are more difficult to study than normal galaxies due to the presence of bright central sources. To determine the structural parameters, , and , it is necessary to subtract the AGN contribution from a host galaxy, which then can be analyzed as a normal galaxy. Given the importance of high spatial resolution, our first sample selection criterion was to choose HST-imaged AGN host galaxies, for which reliable structural parameters are already available.
Second, we chose low ratios for the AGN-to-galaxy luminosity. Stellar absorption lines are much harder to detect from a typical bright AGN spectrum because the brighter nuclear continuum hides stellar lines and increases noise, and AGN broad emission lines hamper the determination of the velocity dispersion from stellar absorption lines. Indeed, we initially observed several typical bright AGNs with faint host galaxies, but failed to get reliable stellar signatures even with very high S/N ratios in the observed spectra. We concluded that it is not possible to measure the stellar velocity dispersion for host galaxies of bright AGNs using the present observational techniques (see also Barth et al. 2002). Therefore, we chose BL Lac objects and radio galaxies, which typically do not have strong emission lines, and whose luminosity is comparable to or smaller than the galaxy light.
Third, we selected low to intermediate redshift () objects. With 4-6m class telescopes and typical exposure times of a couple of hours, is the approximate upper limit for measuring bulge stellar velocity dispersion in AGN host galaxies.
Starting with the sample of 110 BL Lac objects observed with HST (Urry et al. 2000), we selected early-type host galaxies at giving BL Lac hosts in the southern and northern hemispheres. In addition, we selected several well-studied radio galaxies at similar redshifts, which were also previously observed with HST.
The spectra were obtained with the 6.5-m Magellan Clay Telescope at Las Campanas Observatory, the CTIO 4-m telescope, and the KPNO 4-m telescope during February to October 2003. Table 1 shows the details of instrumental setups and the journal of observations. We used the B&C long-slit spectrograph at the Magellan Telescope and the RC long-slit spectrograph at the CTIO and KPNO telescopes. The instrumental setups were chosen to cover strong stellar absorption lines, such as G-band (4300 Å), Mgb triplet (around 5172 Å), Ca+Fe (around 5269 Å), and NaD lines (5892 Å) depending on the redshift, and to provide sufficient instrumental resolution, km sec-1 (Gaussian dispersion), so that the expected velocity dispersions ranging 150 to 350 km sec-1 for our target galaxies could be reliably recovered.
Sky conditions were mostly photometric with excellent seeing, with the exception of a few nights when intermittent thin clouds were present. We used a slit width for most of the runs. For the KPNO run we used a slit width due to worse seeing conditions.
Bias frames and flat fields were taken in the afternoon. When the grating angle had to be changed in order to cover different wavelength ranges, all calibration frames were also taken again. Arc lamp spectra were taken in the afternoon for an initial wavelength solution, and at each telescope position during the night before and/or after target exposures, in order to check any systematic changes.
Late type (G8-K5) giant stars with low radial velocity ( km/sec) were selected as template stars. These stars were observed for each instrument setup, mostly at twilight. Smaller slit widths were used for template star observations in order to obtain a sufficiently high spectral resolution so that the Gaussian velocity dispersions of galaxies and the redshifted templates are comparable.
Total exposure times of 1 to 3.5 hours were used depending on the host galaxy magnitude. Each total exposure time was typically divided into 30 minute exposures to remove cosmic rays and avoid CCD saturation in the presence of bright nuclei.
2.2 Data Reduction and Dispersion Measurement
The standard data reduction procedures, such as bias subtraction, flat-fielding, spectral extraction, and wavelength calibration, were performed with IRAF routines. A one-dimensional spectrum was extracted from each exposure, using aperture sizes similar to or smaller than the effective radius of each host galaxy (Table 2). Extracted spectra were combined to make the final spectrum for each galaxy. Out of 18 observed AGN hosts, 3 galaxies were removed from further analysis since the signal-to-noise ratios of galaxy absorption lines were not sufficient to measure the velocity dispersion. The signal-to-noise ratio of the final sample ranges from 25 to 400 per pixel (see Table 1 for the plate scale), high enough to measure stellar velocity dispersions.
We used a direct fitting method, in which the observed spectrum is directly fitted in pixel space with broadened template spectra. The best-fitting dispersion values are determined by the smallest number. This method is widely used (van der Marel 1994; Rix et al. 1995; Kelson et al. 2000a; Barth et al. 2002), and has an advantage of easily removing bad pixels and AGN emission lines by masking out specific spectral regions in pixel space.
For the fitting procedure featureless continua with various slopes were added to the template star spectra to account for the possible presence of an AGN non-stellar continuum, which changes the line strength as a function of wavelength. The observed galaxy and template star spectra were then normalised by divinding by a continuum fit and re-binned logarithmically. Thus, a set of template spectra with various slopes were prepared for each template star. Finally the template spectra were convolved with Gaussian velocity profiles with 50-400 km sec-1, and fitted to the normalized galaxy spectrum using the Gauss-Hermite Pixel Fitting software111available at http://www.stsci.edu/marel/software.html, which is described in Appendix A of van der Marel (1994).
The fitting software uses various polynomial orders and line strength parameters to match galaxy spectra, and determines the best fit, which gives the velocity dispersion measurement. Bad pixels (especially for CTIO 4m data), galactic absorption lines, and various emission lines (e.g., clearly present H and [OIII] lines) were masked out before fitting.
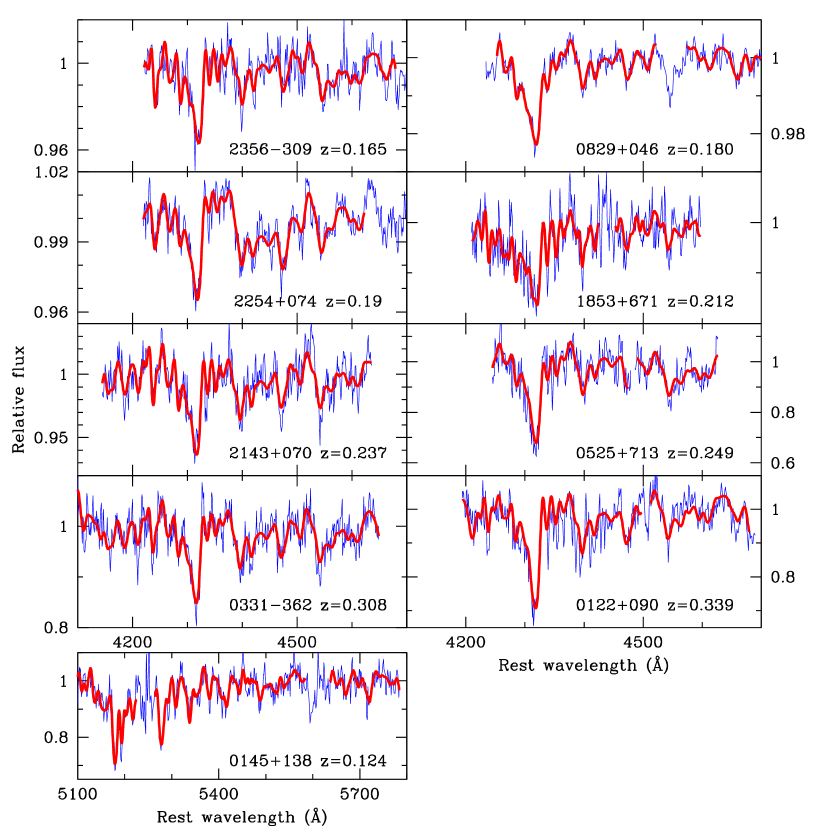
Extensive and careful fitting with various spectral regions, such as G-band, H, Mgb triplet, and NaD line regions, were performed to determine the best-fitting spectral range. We used the G-band region for many galaxies, and a larger spectral range containing from the G-band to the Ca+Fe lines was chosen for 6 galaxies. Various polynomial orders and continuum slopes were used for fitting to test any dependence on the parameters. Deviations with these parameters are similar to typical measurement errors. Changing the spectral type of the template stars gives a larger variation in the velocity dispersion. After fitting with each individual and combined template spectrum, we chose the best-template star with the smallest for each galaxy. Figure 1 shows the host galaxy spectra with the best-fitting template.
Like Barth et al. (2002), we found that Mgb triplet cannot be fit together with nearby lines such as Fe 5270 and Fe 5335 blends. The Mgb triplet is much deeper in the galaxy spectrum than in the stellar template. However, when we exclude the Mgb triplet, the overall fit was very good. Thus, in those cases we masked out the Mgb triplet for the final fitting (see Fig. 1a). The Mgb triplet mismatch is partially caused by a difference in -enhancement between stars in massive galaxies and Galactic stars (Barth et al. 2002). We note that the [N I] emission line, which in some case, is clearly present on the red side of the Mgb triplet, will also hamper a good fit around the Mgb triplet region. The issue of whether more accurate values of the velocity dispersion are obtained when the Mgb triplet lines are included or excluded was addressed in detail by Barth et al. (2002). They found that more accurate results are obtained when the lines are excluded, and we have followed this advice. In principle it would be interesting to provide an independent verification of this finding, and to analyze in more detail what aspects of the stellar and abundance composition of the galaxies are the cause of this. However, this is beyond the scope of the present paper. It would also require a larger sample of higher S/N spectra.
The measured velocity dispersions () are corrected for differences in instrumental resolution between the galaxy and template spectra using (van der Marel et al. 1997):
| (1) |
Here, is the measured velocity dispersion from the fitting, and and are the instrumental resolutions of galaxy and template spectra, respectively. Note that the instrumental resolution in km sec-1 unit is independent of redshift.
For nearby galaxies, this correction is unnecessary because the instrumental setup of template and galaxy spectra are the same. However, this is not the case for high-redshfit galaxies because template stars and galaxies are observed at different spectral ranges, and thus, the instrumental resolution of the template stars should be matched to that of galaxy spectrum (van Dokkum et al. 1996; Kelson et al. 2000a).
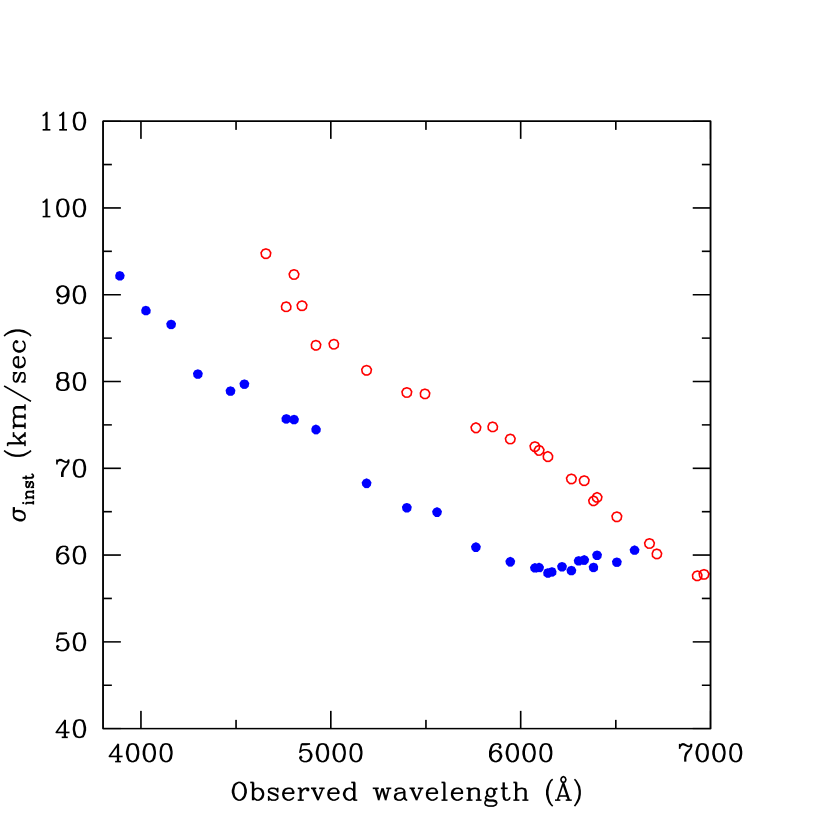
Figure 2 shows an example of instrumental resolution as a function of wavelength for each instrumental setup of our Magellan run. The resolution in Å of the template spectrum is better than that of the galaxy spectrum because of the smaller slit width (). Since the template spectrum resolution is very similar to that of the galaxy spectrum when the template spectrum is redshifted for fitting, the correction for the difference in instrumental resolutions is very small. We derived instrumental resolutions at the center of each fitting spectral range for each galaxy and corrected the galaxy velocity dispersions with Equation (1). Typical correction values are a few km/sec. We report corrected velocity dispersions and aperture radii for 15 AGN host galaxies in Table 2.
The velocity dispersion of AP Lib (1514-241) was measured previously by two groups, Barth et al. (2002) and Falomo et al. (2003), who reported dispersions km sec-1 and km sec-1, respectively. Several other BL Lac objects have large discrepancies between the measurements of those two groups as well. The source of the large (4) discrepancy is unclear. Our measurement for AP Lib, km sec-1, agrees very well with the value of Falomo et al. (2003).
3 The Fundamental Plane of AGN Host Galaxies
Since the Fundamental Plane is well established among early-type galaxies in nearby clusters (e.g., Jorgensen et al. 1996), it has become a tool to study the formation and evolution of normal early-type galaxies. AGN host galaxies, at least at very low redshifts, also show the same scaling relation. Bettoni et al. (2001) measured and collected data for 72 radio galaxies and showed that these low redshift () galaxies lie on the Fundamental Plane. Barth et al. (2002) and Falomo et al. (2003) measured bulge stellar velocity dispersions for a sample of low redshift () BL Lac objects and showed they lie on the same Fundamental Plane as normal galaxies. Here, we compare the Fundamental Plane of AGN host galaxies in our higher redshift sample with that of low-redshift radio and normal galaxies.
We measured and collected dynamical and structural parameters for a sample of 26 AGN host galaxies (23 BL Lac objects and 3 radio galaxies), combining our new higher redshift data with 11 published dispersion measurements from Barth et al. (2002) and Falomo et al. (2003). The velocity dispersions were corrected to a common aperture equivalent to at the distance of the Coma cluster (), based on the empirical prescription of Jorgensen et al. (1995). For several common objects in Barth et al. (2002) and Falomo et al. (2003), we took the mean of the logarithms of the two dispersions. The errors in the mean was calculated by propagation of the errors in the individual measurements (see Table 3). Note that this might underestimate the true errors, given that some of the values of Barth et al. (2002) and Falomo et al. (2003) are not mutually consistent within the errors. However, this does not affect the results of our further analysis.
For this sample of 26 galaxies, structural parameters are collected from the literature. The and total galaxy magnitudes are taken from the HST snapshot survey of BL Lac objects (Urry et al. 2000), with a few exceptions in which the HST-measured host galaxy size () is more than factor of 2 smaller than the ground-based result. These 4 cases, namely Mrk 180, Mrk 421, Mrk 501, and 3C 371, are all at very low redshift () and have large effective radii, . Due to the small field of view of WFPC2, overestimated sky background would lead to an underestimate of (Barth et al. 2002; Falomo et al. 2003). Thus, for these four cases, we took the median of all available data from Falomo et al. (2003). The mean surface brightness within the is derived from the total magnitude of the host galaxy using:
| (2) |
Here, is the total host galaxy magnitude measured in the Cousins R band (Urry et al. 2000),222Note that the published surface brightness in Table 2 of Urry et al. (2000) is not extinction corrected. is the effective radius in arcsec, is extinction in the R band taken from the NED database333 The NASA/IPAC Extragalactic Database (NED) is operated by the Jet Propulsion Laboratory, California Institute of Technology, under contract with the National Aeronautics and Space Administration. (Schlegel et al. 1998), and K is the K correction value interpolated from Poggianti et al. (1997).
3.1 Comparing with Radio and Normal Galaxies
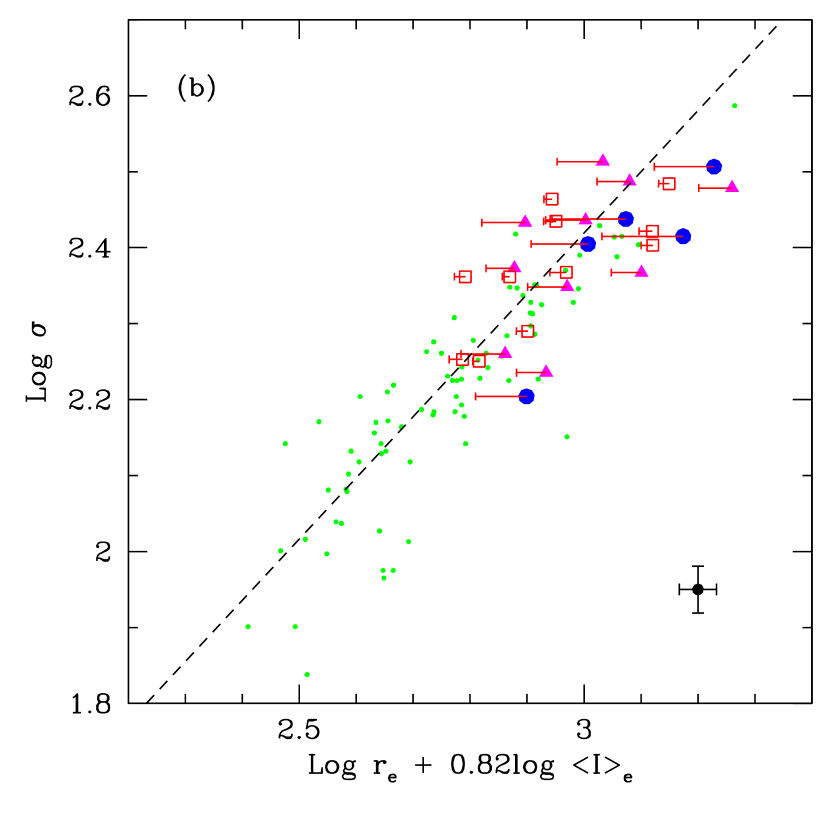
Radio galaxies and BL Lac objects are believed to constitute the same AGN family with different orientation angles (Urry & Padovani 1995). Here we compare the Fundamental Plane of the Bettoni sample of radio galaxies along with our AGN sample in Figure 3. The two panels correspond to two different edge-on projections. The axes of the two panels are such that the 72 radio galaxies of Bettoni et al. (2001) are viewed edge-on. The dashed line is the Fundamental Plane fit defined for 72 radio galaxies (small dots) in Bettoni et al. (2001), who demonstrated that radio galaxies lie on the same Fundamental Plane as normal early-type galaxies although the actual data points (small dots) present significant scatter (0.19 in ), probably due to the data quality and uncertainties in color transformation. The twenty-three BL Lac hosts and 3 radio galaxies in our sample also follow the same correlation. All scales (in this figure only) are corrected to km sec-1 Mpc-1, and for consistency with Bettoni et al. (2001). Our dispersion measurements (filled circles) show a similar trend to that observed by Barth et al. (2002) and Falomo et al. (2003; open circles). We do not find any significant difference in the Fundamental Plane between BL Lac hosts and radio galaxies. The RMS scatter in our sample is 0.103 in . Substracting the measurement errors in quadrature, we find the intrinsic scatter to be 0.071 in .
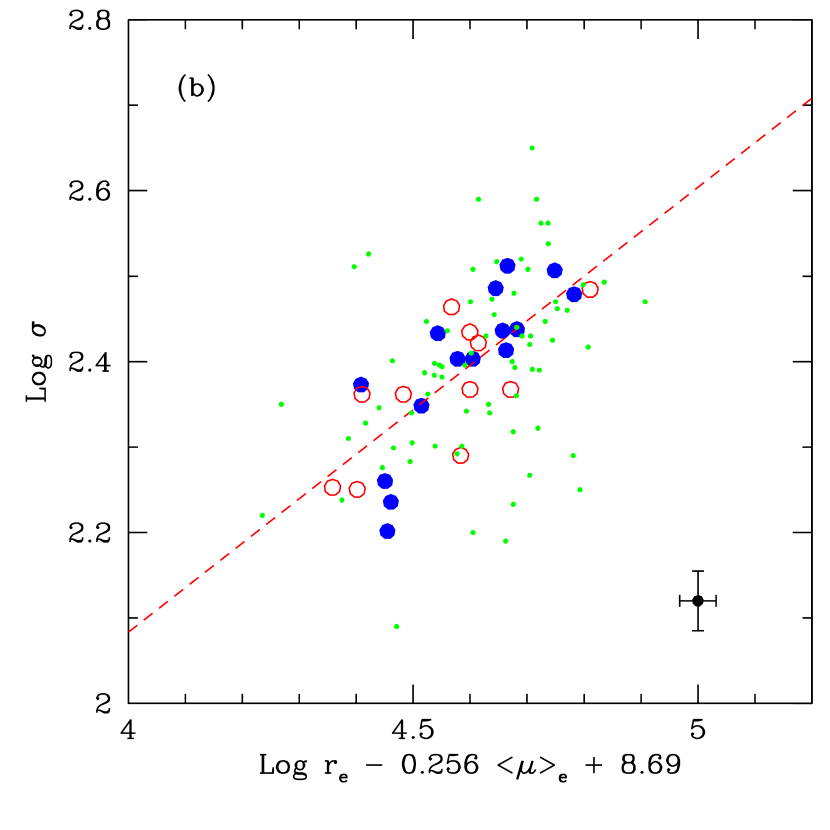
We also compare the normal galaxy Fundamental Plane with that of AGN host galaxies to test the “Grand Unification” picture. Figure 4 shows two edge-on projections of the Fundamental Plane. The axes of the two panels are such that the Coma cluster galaxies in Jorgensen et al. (1996) are viewed edge-on. The dashed line is a fit to the Coma cluster galaxies (small dots) from Jorgensen et al. (1996). Our sample of AGN host galaxies, converted from the Cousins R band to the Gunn r band assuming r-R=0.35 (Jorgensen 1994) are plotted with different symbols based on redshift. This figure shows that AGN host galaxies lie on the same Fundamental Plane as normal galaxies. The higher redshift host galaxies lie below the dashed line because the surface brightness is brighter on average due to the younger stellar populations, assuming and are not changed. This trend is also seen in cluster and field early-type galaxies in similar redshift ranges (van Dokkum et al. 1996; Treu et al. 2001), and corresponds to an evolution of the Fundamental Plane. By correcting passive luminosity evolution with a stellar population synthesis model with formation redshift , the Fundamental Plane becomes tighter (see § 3.2).
3.2 Mass-to-light ratio evolution
The mass-to-light ratio is a fundamental property of galaxies and a basic tool for studying galaxy evolution (Franx 1993). If early-type galaxies formed at relatively high redshift and evolved passively afterward, the evolution of the Fundamental Plane is simply caused by the dimming of surface brightness due to the aging of the stellar population (Tinsley & Gunn 1976). However, if early-type galaxies experience mergers at relatively low redshift, the evolution of the Fundamental Plane will be different due to the ensuing star formation. Thus, the study of the mass-to-light ratio evolution through the Fundamental Plane can constrain the galaxy formation history.
Various recent studies of high redshift (up to ) early-type galaxies have attempted to test galaxy formation scenarios (e.g., monolithic collapse versus merging models) by estimating the star formation epoch, showing that field and cluster early-type galaxies formed at and evolved passively afterward (Kelson et al. 2000b; Treu et al. 2001; van Dokkum et al. 2001; Treu et al. 2002; Gebhardt et al. 2003; Rusin et al. 2003; van Dokkum & Stanford 2003; van der Wel et al. 2004). The evolution of the mass-to-light ratio in early-type cluster galaxies () is consistent with a single burst of star formation at –3, but we note that at higher redshift the picture may be more complex. One of 3 galaxies at shows much lower mass-to-light ratio and strong Balmer absorption lines, indicating a younger stellar population than predicted with –3 models (van Dokkum & Stanford 2003).
In the case of early-type field galaxies, the formation redshift ranges from –3, with at least some observational studies reporting that early-type field galaxies show a steeper mass-to-light ratio evolution (van Dokkum et al. 2001; Treu et al. 2002; Gebhardt et al. 2003). This suggests the average age of their stellar population is younger than that of cluster galaxies, qualitatively consistent with hierarchical merging models that predict early-types in the field formed later than in clusters due to the less dense environment (Kauffman 1996; Diaferio et al. 2001). However, the age difference between field and cluster galaxies, estimated from the observed mass-to-light ratios, is much smaller than predicted with hierarchical merging models (van Dokkum et al. 2001; Treu 2004). It is not even clear whether field galaxies formed later than cluster galaxies, since other studies suggest that field and cluster early-type galaxies have a comparable formation epoch with similar stellar population ages (van Dokkum & Ellis 2003; Rusin et al. 2003). At each epoch of observation there are plausibly various early-type galaxies with stellar populations formed at different epochs (—3), since there is a large scatter in the mass-to-light ratio among field early-type galaxies up to , indicating a significant age spread among field galaxies (van de Ven et al. 2003; van der Wel et al. 2004).
If AGN host galaxies are fundamentally normal galaxies with an active nucleus, the evolution of the mass-to-light ratio should be similar to that of normal galaxies. In this section, we investigate the mass-to-light ratio evolution of our sample of 26 AGN host galaxies.
Because of the virial theorem, galaxy masses can be derived with
| (3) |
where is a constant and is the effective radius. By definition, the luminosity of a galaxy is given by , where is the average surface brightness within the effective radius. Hence, the mass-to-light ratio is given by
| (4) |
where, the constant . In the Gunn r band, , where is in and is the surface brightness in (Jorgensen et al. 1996). If galaxies evolve without merging or accretion, the mass-to-light ratio evolves due to the luminosity evolution of the stellar populations while the mass, , and remain the same (van Dokkum & Franx 1996). Using these relations, we estimated the mass-to-light ratio for each host galaxy, and its evolution by normalizing it with the Fundamental Plane of the Coma cluster galaxies. All parameters were corrected to a common set of cosmological parameters, km sec-1 Mpc-1, , and .
We also modeled the evolution of the mass-to-light ratio in the Gunn r band using stellar population synthesis models with the Salpeter IMF (Bruzual & Charlot 2003). The star formation rate is assumed to be exponentially decreasing:
| (5) |
where t is the time elapsed since the galaxy formed and is the e-folding time of the star formation rate.
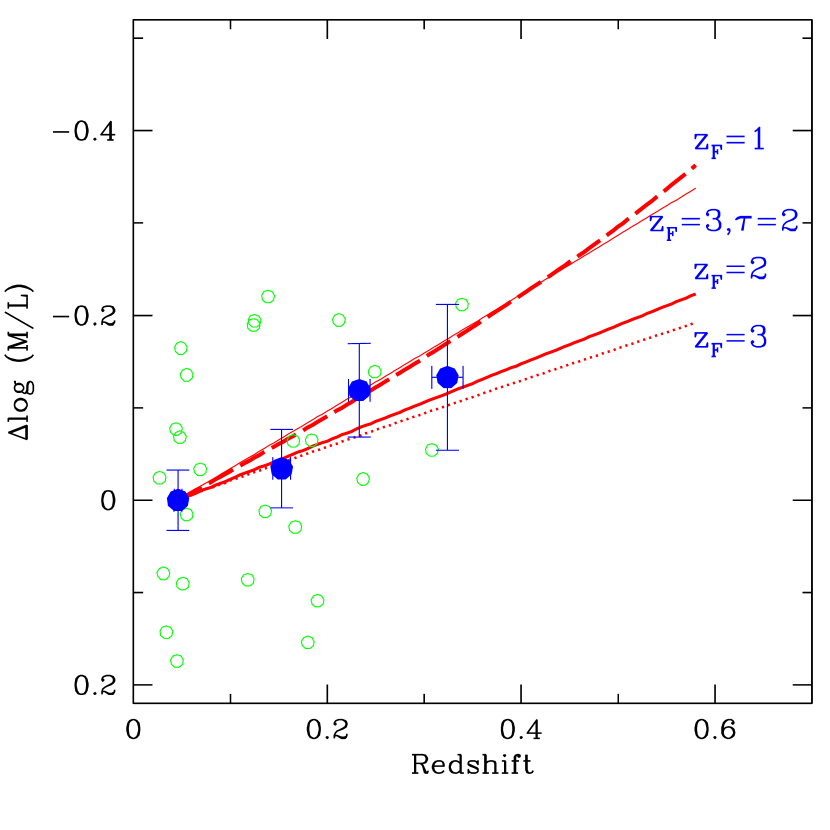
Figure 5 shows the passive evolution model predictions of the mass-to-light ratio in the Gunn r band, depending on the formation redshift and . To address the evolution of AGN hosts we compare high-redshift hosts to low-redshift hosts. We define to be difference in logarithm between the at a certain redshift and the in our lowest AGN host redshift bin, which is centered on . The Figure shows both the mass-to-light ratio of individual host galaxies (open circles) and the averaged values over each redshift bin (filled circles). There is a clear decrease as a function of redshift. The mass-to-light ratio at corresponds to a increase since , which can be reproduced by a single burst model with , although the data points are consistent with the passive evolution models of within the 68 confidence limit based on analysis. The mass-to-light ratio evolution in the Gunn r band corresponds to . Using the stellar population models consistent with this value, we estimated the evolution in the rest-frame B band, . The trend of the evolution of our AGN host galaxies is similar to that of normal galaxies in the field and clusters with star formation epoch at —3 (–0.72; Treu et al. 2002; Rusin et al. 2003; van de Ven et al. 2003; van Dokkum & Stanford 2003). A larger sample of higher redshift () galaxies is clearly required to narrow down the formation epoch of AGN host galaxies (O’Dowd & Urry 2004). We note, however, that a higher model with extended star formation (thin-solid line) and a lower single burst model (dashed line) predict the very similar mass-to-light ratio evolution, especially at low redshift.
Correcting the surface brightness of the galaxies in our sample using the single burst model (with ) predictions for the evolution, as in Figure 4, the Fundamental Plane shows a tight correlation within RMS scatter 0.095 in . Subtracting the measurement errors in quadrature, we find the intrinsic scatter of the Fundamental Plane to be 0.080 in , which is close to the intrinsic scatter, 0.070, of the Fundamental Plane of nearby clusters (Jorgensen et al. 1996).
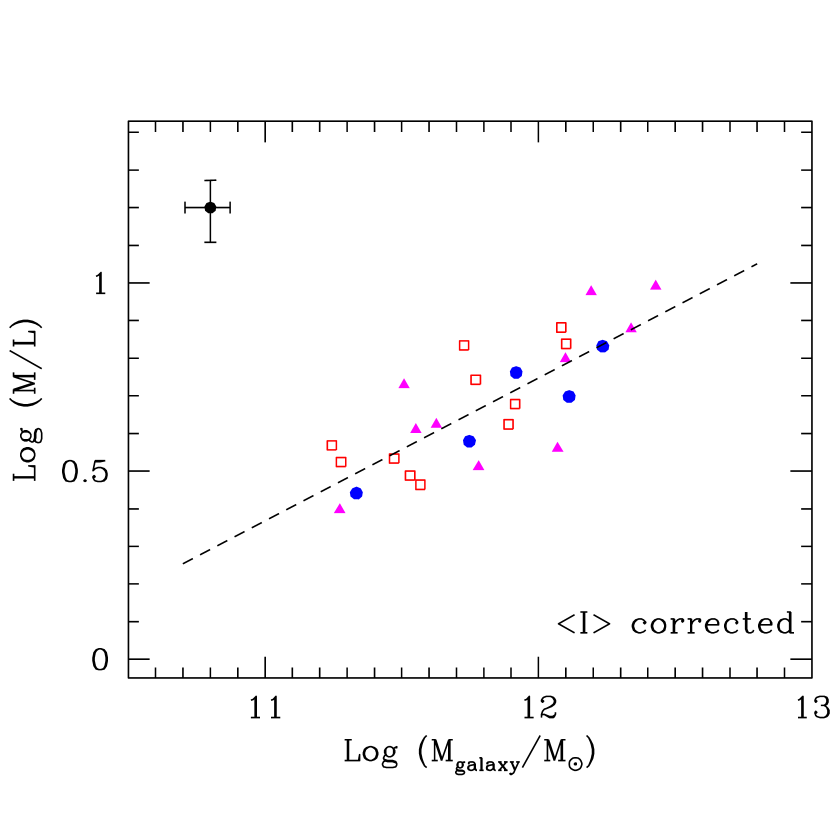
We also estimated each galaxy mass using Equation (3), with as suggested by Bender et al. (1992). AGN host galaxies show the same trend as normal galaxies in that more massive galaxies have larger mass-to-light ratios (Fig. 6). Using the luminosity correction with model, we obtain , which is similar to that of normal galaxies (Jorgensen et al. 1996)
We conclude that there is no significant difference of the evolution between normal and AGN host galaxies. The AGN host galaxies show the same Fundamental Plane, the same relation, and a similar star formation epoch.
4 AGN BLACK HOLE MASS
4.1 Black Hole Mass of BL Lac Objects and Radio Galaxies
AGN black hole masses estimated from reverberation mapping results show the same correlation with bulge kinematics as normal galaxies (Gebhardt et al. 2000b; Ferrarese et al. 2001). This tight correlation between black hole mass and bulge dispersion plausibly holds up to the epoch when galaxies have formed and virialized (Shields et al. 2003), after which the kinematical properties of each galaxy should be approximately stationary. Therefore, the mass-dispersion correlation is probably valid for galaxies that lie on the Fundamental Plane.
Our sample of AGN host galaxies at shows the same Fundamental Plane as normal and radio galaxies, particularly at similar redshift range common to all samples, as we shown in § 3. Thus, we estimate the black hole mass of these objects using the - relation of normal galaxies (Tremaine et al. 2002):
| (6) |
with proper aperture corrections for , following Jorgensen et al. (1995; which gives at most a 10 % change in the velocity dipersion value).
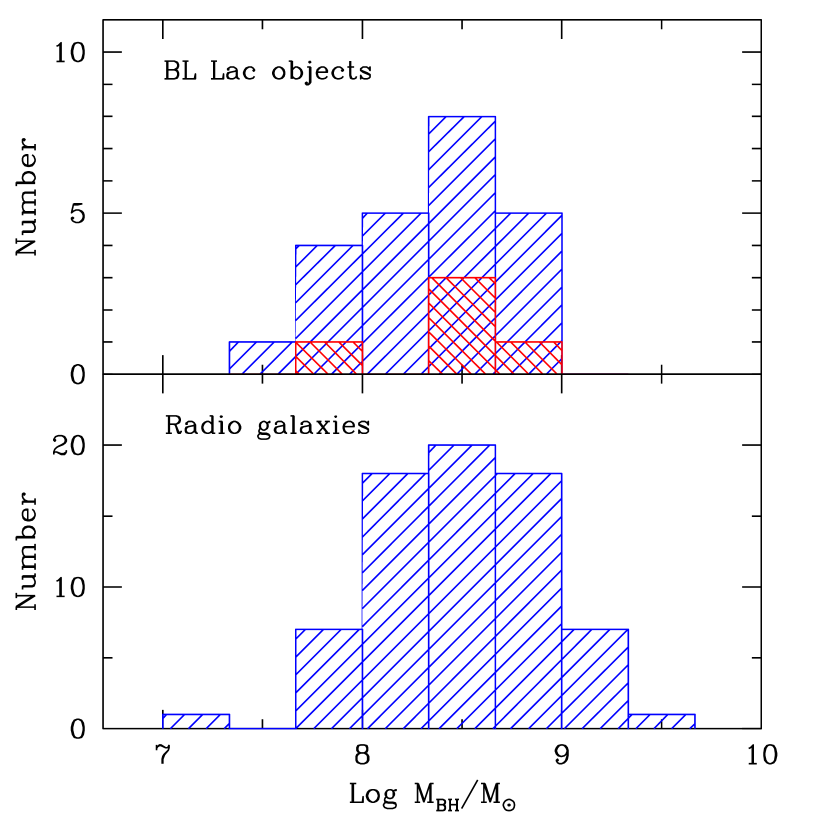
In Figure 7, we show the distribution of black hole masses for BL Lac objects, ranging from a few tens of millions to a billion solar masses, similar to the black hole mass ranges of normal (Kormendy & Gebhardt 2001) and radio galaxies (Woo & Urry 2002). It seems that regardless of the strength of the AGN activity, black hole mass spans a similar range, although the upper and lower limits of the black hole mass are not constrained.
The spectral energy distributions of BL Lac objects show two distinct peaks, at low and high frequencies, due to synchrotron and inverse Compton emission from the unresolved nucleus. The peak frequencies vary systematically and BL Lacs have been divided into two types, namely, low-energy peaked (LBL) and high-energy peaked (HBL). Using measured velocity dispersions, Barth et al. (2002) and Falomo et al. (2003) derived black hole masses using the - relation and found similar BH mass ranges between LBL and HBL, as predicted by Urry et al. (2000) on the basis of their similar host galaxy luminosities. With a larger sample of BL Lac objects, we confirm that black hole mass is independent of BL Lac type, suggesting black hole mass does not control the peak frequency (Fig. 7).
4.2 Black Hole Mass to Galaxy Luminosity Relation
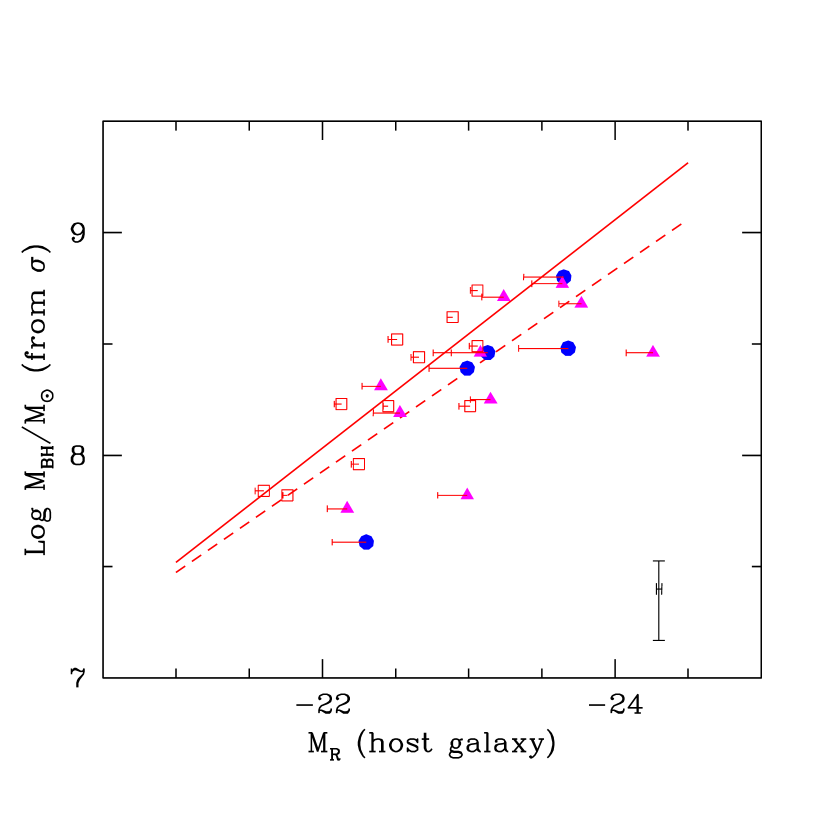
We derived the black hole mass to host galaxy luminosity relation in the Cousins R band (Fig. 8). For the 11 objects at , the best fit is:
| (7) |
Here, is the rest-frame absolute R magnitude of the host galaxy, determined using the apparent magnitude, after correcting for foreground Galactic extinction and applying a K correction. Higher redshift objects are removed before fitting since younger stellar populations can alter the local () black hole mass – galaxy luminosity relation. The derived slope of the mass – luminosity relation in the Cousins R band is -0.51, similar to -0.50 derived for local normal and radio galaxy samples (McLure & Dunlop 2002; Bettoni et al. 2003), indicating the local mass – luminosity relation is indistinguishable among normal, radio, and AGN host galaxies. The mass – luminosity relation derived from a sample of large redshift range suffers intrinsic scatter because host galaxy luminosity evolves as a function of time while the galaxy mass remains the same, probably up to the epoch of galaxy formation (see Fig. 4 of McLure & Dunlop 2002). Also, if derived from the local mass – luminosity relation, the black hole mass of high-redshift AGN will be overestimated due to the younger stellar population.
Therefore, we looked explicitly at the effect of luminosity evolution. We corrected all absolute R magnitudes to using a stellar population synthesis model with . We then derived the mass – luminosity relation for high- () and low-redshift () galaxies. The slope between mass and luminosity for the high-redshift sample is , lower than that of the low redshift sample () but consistent within the uncertainties. The values of y-intercept are also consistent within the uncertainties ( for the low-redshift sample; for the high-redshift sample). The RMS scatter increases from 0.16 to 0.24 in , suggesting the intrinsic scatter of the relation is larger at high redshift. However, it might be simply due to the larger luminosity correction error for younger galaxies at higher redshift.
5 DISCUSSION and CONCLUSION
We report new stellar velocity dispersion measurements for 15 AGN host galaxies at . Combining with published measurements for 11 low redshift () BL Lac hosts and 72 low redshift () radio galaxies, we find that AGN host galaxies lie on the same Fundamental Plane as normal galaxies. The mass-to-light ratio increases since , which is similar to that of normal early-type galaxies, and consistent with single burst galaxy formation models with , indicating AGN host galaxies formed at high redshift and evolved passively afterward. The fact that AGN host galaxies show the same Fundamental Plane and mass-to-light ratio evolution as normal galaxies indicates that there is no fundamental difference between AGN hosts and normal early-type galaxies. Although BL Lac objects (and radio galaxies) do not represent all families of AGNs, this is yet another step to confirm AGN as a transient phase of normal galaxy evolution, also known as the Grand Unification hypothesis. More studies, including radio-quiet AGNs and more AGNs at high redshift, are required to further verify this. However, measurements of bulge stellar velocity dispersion for host galaxies with a bright nucleus are extremely difficult due to the presence of luminous AGN continuum. New techniques will be necessary to overcome this barrier.
We estimated black hole masses for the combined sample of AGN host galaxies using the - correlation. The black hole mass distribution of 23 BL Lac objects is similar to that of 72 local radio galaxies. We also confirm that black hole mass is independent of BL Lac object type, suggesting the peak frequency of BL Lac SED is controlled by other parameters.
The correlation between black hole mass and galaxy luminosity for a sub-sample of AGNs at has a slope consistent with that of local radio and normal galaxies. The mass – luminosity relation derived for larger redshift AGN is uncertain due to the luminosity evolution of the host galaxies.
References
- (1) Aretxaga, I., Terlevich, E., Terlevich, R. J., Cotter, G., & D az, A. I. 2001, MNRAS, 325, 636
- (2) Barth, A., Ho, L., & Sargent, W. L. W. 2002, ApJ, 566, L13
- (3) Bender, R., Burstein, D., & Faber, S. M. 1992, ApJ, 399, 462
- (4) Bettoni, D., Falomo, R., Fasano, G., Govoni, F., Salvo, M., & Scarpa, R. 2001, A&A, 380, 471
- bett (03) Bettoni, D., Falomo, R., Fasano, G., & Govoni, F. 2003, A&A, 399, 869
- (6) Bruzual, G., & Charlot, S. 2003, MNRAS, 344, 1000
- (7) Cavaliere, A., & Padovani, P. 1989, ApJ, 340, L5
- (8) Diaferio, A., Kauffmann, G., Balogh, M. L., White, S. D. M., Schade, D., & Ellingson, E. 2001, MNRAS, 323, 999
- (9) Djorgovski, S., & Davis, M. 1987, ApJ, 313, 59
- (10) Dressler, A., Lynden-Bell, D., Burstein, D., Davies, R. L., Faber, S. M., Terlevich, R., & Wegner, G. 1987b, ApJ, 313, 42
- (11) Dunlop, J. 1999, in The Most Distant Radio Galaxies, ed. H. J. A. Röttgering, P. N. Best & M. D. Lehnert (Dordrecht: Kluwer), p. 71
- Dunlop (03) Dunlop, J. S., McLure, R. J., Kukula, M. J., Baum, S. A., & Hughes, D. H. 2003, MNRAS, 340, 1095
- (13) Faber, S. M., Dressler, A., Davies, R. L., Burstein, D., & Lynden-Bell, D. 1987, in Nearly Normal Galaxies: From the Planck Time to the Present, ed. S. Faber (New York: Springer), 175
- (14) Falomo, R., Kotilainen, J. K., Carangelo, N., & Treves, A. 2003, ApJ, 595, 624
- (15) Ferrarese, L., & Merritt, D. 2000, ApJ, 539, L9
- (16) Ferrarese, L., et al. 2001, ApJ, 555, L79
- (17) Franx, M. 1993, PASP, 105, 1058
- (18) Gebhardt, K., Bender, R., Bower, G., et al. 2000a, ApJ, 539, 13
- (19) Gebhardt, K., et al. 2000b, ApJ, 543, L5
- Gebhardt (2003) Gebhardt, K., et al. 2003, ApJ, 597, 239
- Ho (02) Ho, L. C. 2002, ApJ, 564, 120
- (22) Jorgensen, I. 1994, PASP, 106, 967
- jorgensen (95) Jorgensen, I., Franx, M., & Kjaergaard, P. 1995, MNRAS, 276, 1341
- jorgensen (96) Jorgensen, I., Franx, M., & Kjaergaard, P. 1996, MNRAS, 280, 167
- (25) Kelson, D. D., Illingworth, G. D., van Dokkum, P. G., & Franx, M. 2000a, ApJ, 531, 159
- (26) Kelson, D. D., Illingworth, G. D., van Dokkum, P. G., & Franx, M. 2000b, ApJ, 531, 184
- Kormendy (2001) Kormendy, J., & Gebhardt, K. 2001, AIP confrence proceedings, 586, 363
- Laor (2000) Laor, A. 2000, ApJ, 543, L111
- McLure et al. (1999) McLure, R. J., Kukula, M. J., Dunlop, J. S., Baum, S. A., & O’Dea, C. P. 1999, MNRAS, 308, 377
- (30) McLure, R. J., & Dunlop, J. S. 2001, MNRAS, 327, 199
- (31) McLure, R. J., & Jarvis, M. J. 2002, MNRAS, 331, 795
- (32) Melnick, J., Gopal-Krishna, & Terlevich, R. 1997, A&A, 318, 337
- (33) Miyaji, T., Hasinger, G., & Schmidt, M. 2000, A&A, 353, 25
- (34) O’Dowd, M., C. M., Urry, & R. Scarpa 2001, ApJ, 580, 960
- (35) O’Dowd, M., & C. M., Urry 2004, ApJ, submitted
- peter (1) Peterson, B. M. 1993, PASP, 105,207
- peter (2) Peterson, B. M. 1998, AdSpR, 21, 57
- (38) Poggianti, B. M. 1997, A&AS, 122, 399
- (39) Rix, H. W. R., Kennicutt, R. C., Jr., Braun, R., & Walterbos, R. A. M. 1995, ApJ, 438, 155
- (40) Rusin, D., et al. 2003, ApJ, 587, 143
- (41) Schlegel, D. J., Finkbeiner, D. P., & Davis, M. 1998, ApJ, 500, 525
- (42) Shields, G. A., et al. 2003, ApJ, 583, 124
- (43) Stoughton, C. et al. 2002, AJ, 123, 485
- (44) Tadhunter, C. N., Dickson, R. C., & Shaw, M. A. 1996, MNRAS, 281, 591
- (45) Taylor, G. L., Dunlop, J. S., Hughes, D. H., & Robson, E. I. 1996, MNRAS, 283, 930
- (46) Tinsley, B. M., & Gunn, J. E. 1976 ApJ, 206, 525
- (47) Tremaine, S., et al. 2002, ApJ, 574, 740
- treu (01) Treu, T., Stiavelli, M., Bertin, G., Casertano, S., & M ller, P. 2001, MNRAS, 326, 237
- treu (02) Treu, T., Stiavelli, M., Casertano, S., M ller, P., & Bertin, G. 2002, ApJ, 564, L13
- treu (04) Treu, T., 2004, Carnegie Observatories Astrophysics Series, Vol. 3, in print (astro-ph/0307281)
- (51) Ulrich, M.-H., Maraschi, L., & Urry, C. M. 1997, ARAA, 35, 445 Voges, W., et al. 1999, A&A, 349, 389
- urry (1) Urry, C. M., Scarpa, R., O’Dowd, M., Falomo, R., Pesce, J. E., & Treves, A. 2000, ApJ, 532, 816
- (53) Urry, C. M. & Paolo, P. 1995, PASA, 107, 803
- van (94) van der Marel, R. P. 1994, MNRAS, 270, 271
- van (97) van der Marel, R. P., de Zeeuw, P. T., & Rix, H. W. 1997, ApJ, 488, 119
- (56) van der Ven, P. M., van Dokkum, P. G., & Franx, M. 2003, MNRAS, 344, 924
- vande (04) van der Wel, P. M., Franx, M., van Dokkum, P. G., & Rix, H.-W. 2004, ApJ, 601, L5
- van (96) van Dokkum, P. G., & Franx, M. 1996, MNRAS, 281, 985
- van (01) van Dokkum, P. G., & Franx, M. 2001, ApJ, 553, 90
- (60) van Dokkum, P. G., & Stanford, S. A. 2003, ApJ, 585, 78
- (61) van Dokkum, P. G., & Ellis, R. 2003, ApJ, 592, L53
- (62) Wolf, C., Meisenheimer, K., Rix, H.-W., Borch, A., Dye, S., & Kleinheinrich, M. 2003a, A&A, 401, 73
- (63) Wolf, C., Wisotzki, L., Borch, A., Dye, S., Kleinheinrich, M., & Meisenheimer, K. 2003b, A&A, 408, 499
- (64) Woo, J.-H., & Urry, C. M. 2002, ApJ, 579, 530
- woo (04) Woo, J.-H., Urry, C. M., Lira, P., van der Marel, R., & Maza, J. 2004, in preparation
- (66) Yu, Q., & Tremaine, S. 2002, MNRAS, 335, 965
![[Uncaptioned image]](/html/astro-ph/0409006/assets/x1.png)
![[Uncaptioned image]](/html/astro-ph/0409006/assets/x4.png)
![[Uncaptioned image]](/html/astro-ph/0409006/assets/x6.png)
| Run | Date | Telescope | Inst. | l/mm | slit | res. | Å pixel-1 | scale | seeing | sky |
|---|---|---|---|---|---|---|---|---|---|---|
| 1 | 2/24,25/03 | Magellan 6.5m | B&C | 600 | 1 | 72 | 1.56 | 0.25 | 0.7-0.9 | clear |
| 2 | 4/28,29/03 | CTIO 4m | RC | 527 | 1 | 66 | 1.2 | 0.5 | 1.0-1.5 | thin |
| 3 | 8/27/03 | CTIO 4m | RC | 527 | 1 | 66 | 1.2 | 0.5 | 0.8-1.0 | clear |
| 4 | 9/15,16/03 | Magellan 6.5m | B&C | 600 | 1 | 72 | 1.56 | 0.25 | 0.5-0.9 | clear |
| 5 | 10/4,5/03 | KPNO 4m | RC | 632 | 1.2 | 41 | 1.42 | 0.69 | 1.2-1.5 | clear |
| Name | z | Run | Exp. | r | S/N | C | |||||||||
|---|---|---|---|---|---|---|---|---|---|---|---|---|---|---|---|
| ′′ | ′′ | km sec-1 | km sec-1 | hour | ′′ | ||||||||||
| 1 | 2 | 3 | 4 | 5 | 6 | 7 | 8 | 9 | 10 | 11 | 12 | 13 | 14 | 15 | 16 |
| 0122+090 | 0.339 | 18.97 | 0.25 | 0.495 | 18.88 | 0.04 | 1.05 | 0.10 | 240. | 22. | 4 | 1.7 | 1.25 | 52 | 1.08 |
| 0145+138 | 0.124 | 19.35 | 0.16 | 0.154 | 16.96 | 0.03 | 1.75 | 0.05 | 155. | 21. | 5 | 2.5 | 4.8 | 32 | 1.11 |
| 0229+200 | 0.139 | 19.30 | 0.36 | 0.175 | 15.85 | 0.01 | 3.25 | 0.07 | 267. | 17. | 5 | 3 | 6.9 | 49 | 1.13 |
| 0331-362 | 0.308 | 20.63 | 0.04 | 0.431 | 17.81 | 0.02 | 3.10 | 0.20 | 249. | 20. | 4 | 2.0 | 2 | 68 | 1.10 |
| 0525+713 | 0.249 | 19.36 | 0.32 | 0.327 | 17.49 | 0.01 | 1.98 | 0.01 | 279. | 28. | 5 | 3.5 | 6.9 | 25 | 1.15 |
| 0829+046 | 0.180 | 21.07 | 0.09 | 0.231 | 16.94 | 0.04 | 4.30 | 0.75 | 250. | 37. | 1 | 3.5 | 2 | 443 | 1.09 |
| 1212+078 | 0.136 | 19.89 | 0.06 | 0.171 | 16.02 | 0.01 | 3.40 | 0.10 | 283. | 6. | 1 | 1.5 | 2.5 | 133 | 1.08 |
| 1215+013a | 0.118 | 19.40 | 0.06 | 0.146 | 16.50 | - | 1.67 | - | 221. | 13. | 2 | 1.5 | 2 | 41 | 1.07 |
| 1215-033a | 0.184 | 20.27 | 0.10 | 0.236 | 17.10 | - | 2.14 | - | 166. | 13. | 2 | 3 | 2.5 | 43 | 1.10 |
| 1342-016a | 0.167 | 21.16 | 0.13 | 0.213 | 15.60 | - | 6.29 | - | 248. | 9. | 2 | 3 | 3 | 66 | 1.10 |
| 1514-241 | 0.049 | 18.66 | 0.37 | 0.052 | 14.45 | 0.01 | 3.70 | 0.10 | 242. | 7. | 1 | 1 | 2.5 | 302 | 1.05 |
| 1853+671 | 0.212 | 19.84 | 0.12 | 0.274 | 18.19 | 0.01 | 1.50 | 0.08 | 146. | 31. | 5 | 3 | 2 | 28 | 1.09 |
| 2143+070 | 0.237 | 20.06 | 0.20 | 0.309 | 17.89 | 0.02 | 2.10 | 0.15 | 232. | 19. | 4 | 1.5 | 2 | 103 | 1.09 |
| 2254+074 | 0.190 | 20.88 | 0.18 | 0.244 | 16.61 | 0.02 | 4.90 | 0.35 | 300. | 18. | 4 | 1.5 | 2 | 207 | 1.09 |
| 2356-309 | 0.165 | 19.63 | 0.04 | 0.211 | 17.21 | 0.02 | 1.85 | 0.10 | 206. | 16. | 4 | 1 | 2 | 151 | 1.08 |
References. — a) total galaxy magnitude, , and of these radio galaxies are from Dunlop et al. (2003).
| Name | z | ref. | |||||||||
|---|---|---|---|---|---|---|---|---|---|---|---|
| ′′ | ′′ | km sec-1 | km sec-1 | ||||||||
| 1 | 2 | 3 | 4 | 5 | 6 | 7 | 8 | 9 | 10 | 11 | 12 |
| Mrk501 | 0.034 | 20.40 | 0.05 | 0.036 | 13.07a | - | 12.99b | 4.15 | 291. | 13. | F |
| Mrk421 | 0.031 | 20.29 | 0.04 | 0.033 | 13.29 | 0.02 | 11.04b | 3.49 | 230. | 8. | BF |
| Mrk180 | 0.045 | 20.40 | 0.04 | 0.048 | 14.45 | 0.02 | 7.02b | 2.22 | 230. | 8. | BF |
| 3C371 | 0.051 | 20.61 | 0.10 | 0.054 | 13.87 | 0.02 | 10.53b | 1.09 | 272. | 16. | BF |
| 1Zw187 | 0.055 | 19.61 | 0.08 | 0.059 | 15.49 | 0.02 | 3.15 | 0.05 | 179. | 13. | B |
| 0521-365 | 0.055 | 18.44 | 0.10 | 0.059 | 14.60 | 0.01 | 2.80 | 0.07 | 264. | 16. | BF |
| 0548-322 | 0.069 | 20.40 | 0.09 | 0.076 | 14.62 | 0.01 | 7.05 | 0.15 | 233. | 14. | BF |
| 0706+591 | 0.125 | 19.59 | 0.10 | 0.156 | 15.94 | 0.01 | 3.05 | 0.07 | 233. | 25. | B |
| 1959+650 | 0.048 | 19.73 | 0.47 | 0.051 | 14.92 | 0.02 | 5.10 | 0.10 | 195. | 15. | F |
| 2201+044 | 0.027 | 19.63 | 0.11 | 0.029 | 13.74 | 0.01 | 6.78 | 0.08 | 178. | 6. | BF |
| 2344+514 | 0.044 | 19.06 | 0.58 | 0.046 | 14.01 | 0.01 | 5.93 | 0.02 | 305. | 25. | B |
References. — a) total galaxy magnitude is from Barth et al. (2003), b) is the median of published values from Falomo et al. 2003.