High spatial resolution mid-infrared spectroscopy of NGC 5253: The stellar content of the embedded super-star cluster††thanks: Based on observations obtained at the European Southern Observatory, La Silla, Chile (ID 70.B-0583).
We present the -band (8–13 m) spectrum of the hidden compact radio super-star cluster in NGC 5253, C2, obtained with TIMMI2 on the ESO 3.6 m telescope. The spectrum is characterised by a rising continuum due to warm dust, a silicate absorption and a strong [S iv] line at 10.5 m. Weaker lines of [Ar iii] at 9.0 m and [Ne ii] at 12.8 m are also present. The continuum can be modeled by an optically thick emission from hot ( K) dust emission extinguished by a cold foreground dust screen and a silicate absorption feature with mag. We show how the spatial scale of the observations greatly determine the mid-IR appearance of NGC 5253 and the important implications that this has on the interpretation of line fluxes in terms of the properties (age, IMF, etc.) of the embedded cluster.
We have modeled the observed line fluxes towards C2 using photoionisation models with the most recent spectral energy distributions available to describe the integrated properties of the stellar cluster. The detailed dependence of the mid-IR lines on parameters such as the cluster age, upper mass cutoff and power law index of the IMF, as well as the local abundance, the presence of internal dust and the density structure is largely discussed. Strong constraints on the geometry based on high spatial resolution observations at different wavelengths – near-IR (HST and Keck), mid-IR (TIMMI2) and radio (VLA) – allows us to restrain the ionisation parameters to values dex. This constraint on lead to two possible solutions for the age and upper mass cutoff of C2: 1) a young ( Myr) cluster with a ”non-standard” IMF with a low upper mass cutoff , and 2) a cluster of Myr with a standard high upper mass cutoff ( ). A young age ( 4 Myr) would agree with the lack of supernovae signatures in C2 and in case of being confirmed, would be the first indication for a “non-standard”, low upper mass cutoff of the IMF for an individual massive cluster. An older age of 5–6 Myr would imply that it is possible to “contain” and hide such a compact cluster for a longer time that what it is generally thought. Arguments in favour and against these two scenarios are presented.
The origin of the [O iv] 25.9 m emission measured by ISO and the possible presence of an intermediate mass black hole inside C2 are also addressed.
Key Words.:
ISM: lines and bands – ISM: H ii region – Galaxies: starburst – Galaxies: star clusters – Galaxies: individual: NGC 5253 – Infrared: galaxies1 Introduction
Near to mid-IR observations suffering from less or little extinction are thought to provide more accurate spectral diagnostics to quantify massive star formation and to distinguish between stellar (starburst) and other (AGN) activity (cf. Genzel & Cesarsky, 2000). With the near routinely access to mid-IR observations and thanks to their increased sensitivity, diagnostics in this spectral domain have been measured for a large number of Galactic and extra-galactic objects with the Infrared Space Observatory (ISO). Furthermore, observations with the Spitzer Space Telescope have just begun.
Despite the important advantage of strongly reduced extinction, mid-IR satellite observations are potentially hampered by limitations due to their large aperture, especially for extra-galactic targets. As high spatial resolution mid-IR observations show, starburst galaxies and related objects can exhibit complex structures, numerous “knots” etc. both in the continuum as in emission lines (e.g. Böker et al., 1998; Soifer et al., 2001, 2002) on scales much smaller than the spectroscopic apertures (e.g. typically 280–380 arcsec2 for ISO/SWS). Furthermore, different diagnostics (e.g. PAH and continuum emission, high and low excitation fine structure lines) may originate from different spatial regions. In consequence, it is by no means clear if and to what extent such spatially integrated or “global” spectra can be used for various diagnostics purposes.
For example, the reason for a relatively low average excitation in starburst galaxies as measured by the fine structure line ratio [Ne iii]/[Ne ii] (cf. Thornley et al., 2000) is not completely clear and has led to somewhat conflicting or inconsistent interpretations. Thornley et al. (2000) argue e.g. that the low [Ne iii]/[Ne ii] ratios are due to short burst timescales and aging effects allowing, however, for a “normal” Initial Mass Function (IMF) including massive stars up to 50–100 . In contrast, Rigby & Rieke (2004) argue for a deficiency of stars with or suggest that massive stars or star clusters in massive galaxies spend a significant fraction of their lifetime hidden even at near to mid-IR wavelengths. Martín-Hernández et al. (2002b), on the other hand, have pointed out a dependence of the observed [Ne iii]/[Ne ii] ratio of starbursts on metallicity and argue that a proper treatment of the metallicity effects on stellar tracks, atmospheres and nebular models must be taken into account in the comparisons. Finally one may wonder how reliable nebular models assuming a single “average” ionisation parameter are and to which extent the low [Ne iii]/[Ne ii] ratio is due to a non-negligible contribution of [Ne ii] from a diffuse low excitation medium (cf. Schaerer, 2003). Although Thornley et al. (2000) estimate a diffuse contribution to be insignificant, this remains to be demonstrated observationally.
In short, given the complexity of modelling and interpreting large aperture fine structure line emission and possibly other mid-IR diagnostics, there appears to be an important need for clarification based on simple objects representing, ideally, a single age and metallicity population with a well constrained geometry. The latter, in particular, is of prime importance to constrain the ionisation parameter of the nebular model and has generally not been treated with enough care.
With these aims in mind we have recently started gathering ground-based high spatial resolution mid-IR observations (imaging and spectroscopy) of several nearby starbursts. Among them is the well studied bright starburst galaxy NGC 5253, a nearby Magellanic type irregular, observed at basically all wavelengths from X-ray to radio. Although this galaxy has a lower metallicity and higher excitation than the typical starbursts observed with ISO (cf. Thornley et al., 2000; Verma et al., 2003), the observations and analysis present here can provide interesting insight on the difficulties related to low spatial resolution spectroscopic observations and on the problems discussed above.
The galaxy NGC 5253 is also of prime interest for studies related to super star clusters (hereafter SSCs), as it is one of the first starbursts where a very compact and hidden SSC was found from high spatial resolution radio observations (Turner et al., 1998). Such optically thick bremsstrahlung radio sources represent most likely the earliest phases of SSCs observed so far (e.g. Kobulnicky & Johnson, 1999; Vacca et al., 2002). As such, they provide invaluable insight on the properties of SSCs, their formation and evolution. Furthermore, studying the youngest star forming regions yields in principle the most accurate constraints on the true upper limit of the IMF, since least affected by effects such as mass segregation, evaporation, and by the short finite lifetime of the most massive stars.
Interestingly, the compact radio SSC in NGC 5253, often also referred to as the radio “supernebula”, also stands out by its large contribution to the total integrated flux of the galaxy at various wavelength. For instance, Gorjian et al. (2001) estimate that at least 15% of the bolometric luminosity of NGC 5253 is due to this SSC. Vanzi & Sauvage (2004) find that it dominates the total galaxy emission at wavelength longer than 2–3 m. Recently, HST/NICMOS observations have permitted resolving the region close to the supernebula revealing the presence of a nuclear double star cluster separated by 03–04 (Alonso-Herrero et al., 2004). The eastern near-IR cluster (C1) is identified with a young optical cluster, whereas the western star cluster (C2) coincides with the radio supernebula. Keck observations of NGC 5253 C2 (Gorjian et al., 2001) at 11.7 m reveal an unresolved source with a diameter of 058 and a total flux of 2.2 Jy. Radio observations at mm and cm wavelengths (Turner et al., 2000; Turner & Beck, 2004) show a slightly elongated source of about 01005. As we will see below, these high spatial resolution observations combined with our mid-IR spectroscopy provide, by means of detailed photoionisation models, a unique opportunity to study in detail the properties of this extreme hidden massive star cluster.
The core of the paper is structured as follows. Our observations are described in Sect. 2. Immediate results from our spectra are discussed in Sect. 3. Detailed photoionisation models for the compact SSC C2 are presented in Sect. 4. Our principal results on the age, initial mass function and other properties of the SSC, as well as various implications are discussed in Sect. 5. The main conclusions of the paper are summarised in Sect. 6.
2 Observations and data reduction
Our new infrared data on NGC 5253 were obtained as part of a programme with the Thermal Infrared MultiMode Instrument (TIMMI2) on the ESO 3.6 m telescope (La Silla Observatory, Chile) to observe young starburst galaxies.
The -band spectrum of NGC 5253 C2 was obtained on 2003 March 21. We used the 10 m low-resolution grism which ranges from 7.5 to 13.9 m and has a spectral resolving power . The slit width used was 1270″, with a pixel scale of 045. The slit was positioned across the bright infrared supernebula C2 and in the north-south direction. In order to correct for background emission from the sky, the observations were performed using a standard chopping/nodding technique along the slit (where the object is observed at two different positions on the slit) with an amplitude of 10″ in the north-south direction. The effective exposure time (on-source) was 32 min. The observation was performed at an airmass of . The star HD 123139 was observed right before and after C2 and served as both telluric and flux standard star. This is a primary ISO calibration standard star and is described in detail at the TIMMI2 webpage111www.ls.eso.org/lasilla/sciops/timmi. The synthetic calibrated spectrum for this standard star is given by Cohen et al. (1999).

The data processing included the removal of bad frames and the coaddition of all chopping and nodding pairs. This left us with one single image with one positive and two negative long-slit spectra. These were combined with a simple shift-and-add procedure which increased significantly the signal-to-noise. The spectra of the target and standard star were extracted using the optimal extraction procedure developed by Horne (1986), ideal for unresolved point sources. This procedure applies non-uniform pixel weights in the extraction sum in order to reduce the statistical noise in the extracted spectrum to a minimum while preserving its photometric accuracy. Slit losses are negligible, since the full-width-at-half-maximum (FWHM) along the spatial direction for both target and standard star is 11, smaller than the slit width (12). The calibration of the spectroscopic data included 1) the removal of the telluric features, which was done by dividing by the spectrum of the standard star, 2) the removal of the spectral features of the standard star and 3) the absolute flux calibration. These last two steps were conjointly done by multiplying by the synthetic spectrum of the standard star. Wavelength calibration is straight forward since a table with the pixel-to-wavelength correspondence is provided by the TIMMI2 webpage.
3 Results
3.1 The N-band spectrum
Figure 1 a shows the spectrum of the embedded cluster NGC 5253 C2. Only the valid range between 8.15 and 13 m is shown. The spectrum is characterised by a rising continuum due to warm dust, a silicate absorption around 9.7 m and the fine-structure lines of [Ar iii] at 9.0 m, [S iv] at 10.5 m and [Ne ii] at 12.8 m. The [Ne ii] line is very weak. The presence of silicate absorption contradicts the best fitting model of the nuclear SED by Vanzi & Sauvage (2004), which does not require a silicate component. The ISO/SWS spectrum of NGC 5253 by Crowther et al. (1999) shows no evidence of absorption at the location of the silicate band. However, the silicate absorption might be hampered by the large ISO aperture ( 14″20″) and by the low signal-to-noise of the spectrum. A direct comparison with the ISO/SWS spectrum also shows that the continuum flux level of NGC 5253 C2 is about 3 times lower that that observed by the large ISO aperture.
The spectrum does not display PAH emission features. This is confirmed by the -band spectrum of the nuclear region of NGC 5253 obtained by Alonso-Herrero et al. (2004), which shows the non-presence of the 3.3 m PAH feature. The ISO spectrum integrated over the whole galaxy (Crowther et al., 1999) shows no signature of PAH emission features neither. Most massive star-forming galaxies show emission bands at 3.3, 6.2, 7.7, 8.6 and 11.2 m, generally attributed to emission by Polycyclic Aromatic Hydrocarbon (PAH) molecules (e.g. Allamandola et al., 1989). Hence, the non-detection of PAH features towards NGC 5253 C2 makes it look more like an AGN than a star forming region (e.g. Genzel & Cesarsky, 2000; Siebenmorgen et al., 2004). However, it is shown from ISO observations that low metallicity dwarf galaxies such as NGC 5253 tend to show weak of no mid-IR PAH emission features (e.g. Thuan et al., 1999; Madden, 2002). Moreover, PAH features are not present in the mid-IR spectra of highly embedded massive star formation sites (e.g. Peeters et al., 2004). The effects of low metallicity and a harsh environment in NGC 5253 C2 probably suppress the formation of PAH emission features.
| Line | Line fluxa | Line fluxb | Aperture | ||||||
| (m) | (10-20 W cm-2) | (mag) | (″) | ||||||
| This work: | |||||||||
| [Ar iii] | 9.0 | 4.4 | 1.0 | 7.6 | 1.8 | 0.60 0.04 | 1.2 | ||
| [S iv] | 10.5 | 18.0 | 0.7 | 29.9 | 1.6 | 0.55 0.04 | 1.2 | ||
| [Ne ii] | 12.8 | 1.4 | 0.5 | 1.7 | 0.6 | 0.23 0.02 | 1.2 | ||
| Turner et al. (2003): | |||||||||
| Br | 2.17 | 0.4 | 0.1 | 2.2 | 1.4 | 1.9 0.6 | 0.579 | ||
| Br | 4.05 | 3.4 | 1.0 | 6.2 | 2.2 | 0.7 0.2 | 0.579 | ||
| Lumsden et al. (1994): | |||||||||
| He i | 2.06 | 0.240 | 0.004 | 1.6 | 1.0 | 2.10.7 | 3 | ||
| Selected mid-IR line fluxes measured by ISO/SWS (Verma et al., 2003): | |||||||||
| [Ar ii] | 7.0 | 2.3 | 0.2 | 2.6 | 0.2 | 0.130.01 | |||
| [Ar iii] | 9.0 | 5.9 | 0.5 | 10.2 | 0.9 | 0.600.04 | |||
| [S iv] | 10.5 | 34 | 3 | 56 | 5 | 0.550.04 | |||
| [Ne ii] | 12.8 | 8 | 1 | 10 | 1 | 0.230.02 | |||
| [Ne iii] | 15.5 | 28.9 | 4.6 | 34 | 5 | 0.190.01 | |||
| [S iii] | 18.7 | 15.9 | 2.5 | 20 | 3 | 0.250.02 | |||
| [O iv] | 25.9 | 0.9 | 0.1 | 1.0 | 0.1 | 0.140.01 | |||
a Before extinction correction. b After extinction correction.
3.2 Line fluxes observed at different spatial resolutions
Line fluxes in the -band spectrum were measured by fitting a Gaussian and are listed in Table 1. We have compared these line fluxes with IR measurements for NGC 5253 from the literature.
Beck et al. (1996) observed the nuclear region of the galaxy with a resolution of 16 and obtained fluxes for the [Ar iii], [S iv] and [Ne ii] lines of, respectively, , and W cm-2. The [Ar iii] line flux is comparable to the one we have measured with TIMMI2, while the line flux of [S iv] is about 2 times higher. The reason of this discrepancy is not clear to us.
The central region of NGC 5253 has also been observed by the SWS on board ISO, resulting in a spectrum ranging from 2.3 to 45 m (Crowther et al., 1999). The ISO/SWS apertures are approximately up to 12 m, and between 12 and 19.6 m. The line fluxes measured by ISO/SWS are , and W cm-2, respectively for the [Ar iii], [S iv] and [Ne ii] lines (Verma et al., 2003, see also Table 1), where we have adopted as uncertainties the typical ISO/SWS absolute flux accuracy (Peeters et al., 2002). Line ratios between the ISO/SWS and TIMMI2 fluxes are , and . Ar++, S3+ and Ne+ have ionisation potentials of 27.6, 34.8 and 21.6 eV, respectively. Hence, in view of the comparison between the line fluxes measured towards NGC 5253 C2 by TIMMI2 and those measured by the large ISO aperture, we see that a large fraction of the emission from the high-excitation lines ([Ar iii] and [S iv]) in the central starburst region of NGC 5253 comes from the compact and embedded H ii region associated to NGC 5253 C2. However, only 20% of the [Ne ii] emission comes from this H ii region. Other sources such as the remaining observed clusters and the diffuse ISM must contribute to the [Ne ii] line flux measured by ISO/SWS.
Ratios of fine-structure lines are commonly used in a diversity of diagnostics. For instance, the ratio of the high-to-low-excitation emission lines [O iv] 25.9/[Ne ii] 12.8 m is used, in combination with the 7.7 m PAH line-to-continuum ratio, to separate AGN dominated and star formation dominated nuclei (cf. Genzel et al., 1998)). As well, ratios such as [Ne iii] 15.5/[Ne ii] 12.8 m are used to infer the age of the starburst (e.g Thornley et al., 2000). The presence of IR-bright hidden clusters such as the one observed in NGC 5253 and their contribution to the global atomic line emission might thus obfuscate diagnostic diagrams used to determine the ultimate physical process powering galactic nuclei and studies of the IMF.
We also compare the Br line fluxes measured by Turner et al. (2003) using NIRSPEC on the Keck Telescope– with an aperture of 0.579″ centred on NGC 5253 C2 – and by ISO/SWS. These fluxes are, respectively, (see Table 1) and W cm-2 (Verma et al., 2003). Both line fluxes are in good agreement, indicating that practically all the Br emission is produced by NGC 5253 C2.
3.3 Extinction
3.3.1 Extinction in the near-IR
Turner et al. (2003) observed the Brackett (2.17 m) and (4.05 m) recombination lines of hydrogen towards NGC 5253 C2 using NIRSPEC on the Keck Telescope. The observed and extinction-corrected line fluxes are listed in Table 1. The lines were corrected for extinction considering that the intrinsic flux ratio is 2.8 (for an electron temperature K; Hummer & Storey 1987) and an extinction law (Mathis, 1990). The value of the electron temperature is determined for visible H ii regions in NGC 5253 (Campbell et al., 1986; Walsh & Roy, 1989; Kobulnicky et al., 1997). We have recomputed the extinction values obtained by Turner et al. (2003) in order to include a detailed error analysis. The extinctions with their respective uncertainties are: mag, mag and mag.
Assuming that for (Mathis, 1990), we obtain that NGC 5253 C2 is extinguished by mag in the optical V-band. This value of the extinction agrees well with the near-IR estimate by Alonso-Herrero et al. (2004), mag in an aperture of 063″. The modelling of the near-infrared to millimetre SED by Vanzi & Sauvage (2004) and Alonso-Herrero et al. (2004) gives comparable values for the extinction (16–21 mag). We note that this extinction range is obtained by Vanzi & Sauvage (2004) in their alternate model which does not consider the HST optical data. Dropping the optical flux as a constraint on the dust modelling is more appropriate as the dominant IR emitting region (C2) and the optically emitting regions are unrelated. In contrast, their principal model, which wrongly includes optical data, gives a lower extinction of mag.
3.3.2 Extinction in the -band
In order to determine the intrinsic line fluxes in the -band, we need to correct for extinction, which, in the mid-IR, is mainly caused by silicate absorption. Following Okamoto et al. (2001, 2003), we have adopted a simple model to derive the extinction in the -band, where the emission from hot dust in or at the outer edge of the ionised region is assumed to be extinguished by cold foreground dust along the line-of-sight. This representation of the dust distribution is supported by the UV study of Meurer et al. (1995), who concluded that the dust geometry towards NGC 5253 could be described in terms of a foreground dust screen near the starburst. In such model, the emission of the dust at a wavelength is described as:
| (1) |
where is a scaling factor, is the temperature of the emitting hot dust, is the dust emissivity and is the optical depth. We assume that the foreground dust has the same grain properties as the emitting hot dust and hence, can be written as , where is the peak optical depth of the silicate. We have considered two extreme cases for the optical emission of the emitting hot dust: an optically thick approximation (where ) and an optically thin approximation (where ). The adopted is based on a mixture of carbonaceous grains (PAH and graphite-like) and amorphous silicate grains with developed by Weingartner & Draine (2001) which successfully reproduces the observed Galactic interstellar extinction.
The 8–13 m spectrum was therefore fitted using the above model, which has 3 free parameters: , and . We performed least-squares fits to the data. The best fits for the optically thick and optically thin approximations are shown in Fig. 1 b. We obtained a significantly better fit using the optically thick approximation (with a resulting reduced- equal to 1.5) than using the optically thin approximation (reduced-) and therefore, we will only consider the first case hereafter. Figure 1 b shows the continuum-subtracted spectrum using the optically thick model.
The best fit (optically thick approximation) gives (with given in W cm-2 m-1), K and . The error analysis was done by following how changes as the parameters in the model vary. The final errors in the best-fit parameters were calculated by determining how much the parameters have to change to get to the 1% probability level.
The values of the extinction estimated at the wavelengths of the -band fine-structure lines are given in Table 1, together with the line fluxes after corrected for extinction. The extinction in magnitudes is related to the optical depth through . We also give the extinction estimates and corrected line fluxes of the mid-IR lines measured by ISO. These line fluxes must be taken as upper limits because of the large ISO aperture.
We can now draw the complete m extinction law for the embedded cluster, where the range between 2 and 7.5 m is given by (see Sect. 3.3.1), and the range beyond is given by the silicate profile by Weingartner & Draine (2001) with . Since we have obtained that mag (see Sect. 3.3.1), we have that , in good agreement with the ratio of found by Roche & Aitken (1984) for the local diffuse interstellar medium.
3.4 Ionic abundances
Ionic abundances can be determined from the measured strengths of the fine-structure and H i recombination lines. The ionic abundance of a certain ion with respect to hydrogen () can be determined using the following expression (e.g. Rubin et al., 1988):
| (2) |
where and are the extinction-corrected fluxes of any line produced by and H i, and and are their respective emission coefficients. This expression assumes that 1) the nebula is homogeneous with constant electron temperature and density, 2) all the line photons emitted in the nebula escape without absorption and therefore without causing further upward transitions and 3) the volume occupied by and H+ is the same.
The emission coefficients depend on , and the relevant atomic parameters (Martín-Hernández et al., 2002a). Adopting =12 000 K (see Sect. 3.3.1) and = cm-3 (see Sect. 4.1), we obtain , , and erg cm3 s-1. Using these values for the emission coefficients and the line fluxes listed in Table 1, the ionic abundances with respect to H+ we estimate for Ar++, S3+ and Ne+ are, respectively, , and .
Finally, we can estimate upper limits for the elemental abundances of Ar, S and Ne using the [Ar ii] 7.0, [S iii] 18.7 and [Ne iii] 15.5 m line fluxes measured by the larger ISO aperture. The emission coefficients of these lines for =12 000 K and = cm-3 are , and erg cm3 s-1. Hence, upper limits to the ionic abundances with respect to H+ of Ar+, S++ and Ne++ are, respectively, , and Taking into account these values, we can give upper limits to the total elemental abundances of Ar, S and Ne assuming that most of the argon and neon is singly and doubly ionised and that most of the sulphur appears as S++ and S3+. The upper limits we obtain for Ar/H, S/H and Ne/H are, therefore, , and , which are approximately 0.7, 0.9 and 0.4 times the solar elemental abundances. The upper limit that is likely closer to the true elemental abundance is that of Ne/H since most of the [Ne iii] line flux must come from the H ii region formed by the embedded star cluster C2 (as it is the case of the [S iv] line flux, cf. Sect. 3.2). The upper limit obtained for Ne/H (0.4[Ne/H]☉) agrees well with the global metallicity of the galaxy (, see Sect. 4.1).
4 Modelling the nebular lines
We begin with a description of the observational constraints and input parameters for the modelling of the nebular lines.
4.1 Observational constraints
There are several observational facts that can be used to constrain the photoionisation models:
Distance
The distance to NGC 5253 is well known from its Cepheids. Recently, Freedman et al. (2001) has derived a distance modulus of from 17 Cepheid candidates. This distance modulus is equivalent to a distance of Mpc.
Age
Recently, Alonso-Herrero et al. (2004) have estimated the age of the stellar population of NGC 5253 C2 based on the equivalent width (EW) of Pa ((EW(Pa))=). They derive an age of Myr. We have, however, computed the EW of Pa predicted by our photoionisation models (Sect. 4.2 and thereafter). The predicted EW is practically constant during the first 6 Myr after the burst of star formation, with a value of the order of the EW observed by Alonso-Herrero et al. (2004), decreasing drastically beyond this age. Hence, based on the observed EW, we can only obtain an upper limit for the age of the cluster of 6 Myr. This upper limit is independent of the upper mass cutoff of the cluster initial mass function since variations due to different upper mass cutoffs are smaller than the quoted observational error. Indication of an early age comes as well from the fact that the nuclear radio and millimetre continuum emission are almost entirely due to thermal emission (e.g. Beck et al., 1996; Turner et al., 2000), which rules out supernova remnants or radio supernovae as the source of the emission and place an upper limit of about 4 Myr for the age of the cluster. Finally, the finding of optically thick thermal radio emission from the C2 region (Turner et al., 1998) interpreted as an “ultra-dense” H ii region tends to indicate even younger ages ( Myr; cf. Kobulnicky & Johnson, 1999; Vacca et al., 2002) as deduced from pressure/lifetime arguments. However, this argument can possibly be relaxed if the cluster mass is large enough allowing for its own gravitational confinement, as suggested by Turner et al. (2003).
Geometry
Recent 7 mm continuum observations made with the VLA including Pie Town (Turner & Beck, 2004) shows that the supernebula has a size of mas by , with a position angle of , or 1.6 pc by 0.6 pc for the above distance of 3.25 Mpc. The nebula is smaller than most extra-galactic super star clusters (cf. Table 5).
Chemical composition
Optical and ultraviolet spectroscopy obtained with the HST Faint Object Spectrograph at three locations in the central H ii complex of NGC 5253 (Kobulnicky et al., 1997) gives an oxygen abundance of in agreement with previous ground-based spectroscopy (e.g. Walsh & Roy, 1989). Assuming a solar oxygen abundance of (Allende Prieto et al., 2001), NGC 5253 is a metal-poor galaxy with a metallicity . This metallicity agrees well with the upper limits for the elemental abundances of NGC 5253 C2 derived in Sect. 3.4; in particular, it is close to the upper limit obtained for Ne/H, which is close to the true Ne abundance of the embedded cluster (see also Sect. 3.4).
Electron density
The electron density can be constrained from radio continuum observations. Subarsecond resolution observations of NGC 5253 C2 indicates that the region is partially optically thick at cm wavelengths (Beck et al., 1996; Turner et al., 2000). However, it has been recently observed at 7 mm (43 GHz) by Turner & Beck (2004). The nebular emission is optically thin at this wavelength. The nebula contains 8.5 mJy of flux at 7 mm. Assuming that the line-of-sight dimension is equal to the transversal size of the region (1 pc if we take the geometrical average of the major and minor axes of the core as a representative size, see above), the rms electron density (calculated using Eq. A.2.5 by Panagia & Walmsley 1978 ) is cm-3. This electron density is typical of ultracompact H ii regions and it is high for an H ii region of this size. Densities and sizes for Galactic H ii regions follow a rather tight relation of the form , where is the diameter in pc (Garay et al., 1993; Martín-Hernández et al., 2003). A Galactic H ii region of about 1 pc in diameter would have an electron density of the order of cm-3.
H i recombination lines
He i recombination lines
Lumsden et al. (1994) observed the central 3″3″region of NGC 5253 in the K-band. They measured a Br flux equal to W cm-2. The good agreement with the Br flux measured by Turner et al. (2003) (see Table 1) indicates that the ionised emission in the K-band is dominated by NGC 5253 C2. Lumsden et al. (1994) also measured the 2.06 m () He i line in this band. The observed and extinction-corrected line fluxes of this He i line are listed in Table 1. The ratio He i 2.06/Br depends on the ratio of the He ( eV) to H ( eV) ionising photons.
Mid-infrared fine-structure lines
Mid-IR fine-structure lines can be used to probe the stellar SED in
the EUV range. The observed and extinction-corrected line fluxes of
the mid-infrared lines observed by TIMMI2 ([Ar iii] 9.0, [S iv] 10.4 and
[Ne ii] 12.8 m) are listed in Table 1. We also
list other mid-infrared line fluxes measured by ISO ([Ar ii] 7.0,
[Ne iii] 15.5, [S iii] 18.7 and [O iv] 25.9 m),
which must be taken as upper limits because of the large ISO aperture.
A summary of the above observational constraints is shown in Table 2.
4.2 Input parameters and assumptions
We compute sets of nebular models with the photoionisation code CLOUDY222see http://thunder.pa.uky.edu/cloudy/ (Ferland et al., 1998) version 96.00-beta 4 using MICE333see http://www.astro.rug.nl/spoon/mice.html, the IDL interface for CLOUDY created by H. Spoon. The computation is performed for a static, spherically symmetric, ionisation bounded gas distribution with an inner cavity. We assume that the gas is uniformly distributed in small clumps of constant density over the nebular volume and occupies a fraction of the total volume. The shape of the stellar radiation field, the ionising photon luminosity (), the electron density (), the inner radius of the shell of ionised gas (), the filling factor (), and the chemical composition () are the input parameters for the photoionisation models to predict the intensity of the emission lines.
| Parameter | Value |
|---|---|
| Br | W cm-2 |
| He i/Br | |
| [Ar ii]/Br | |
| [Ar iii]/Br | |
| [S iv]/Br | |
| [Ne ii]/Br | |
| [Ne iii]/Br | |
| [S iii]/Br | |
| 0.8 pc | |
| cm-3 | |
| 0.006 |
We have used the evolutionary synthesis code Starburst99444see http://www.stsci.edu/science/starburst99/ (Leitherer et al., 1999) version 4.0 to model the integrated properties of the stellar cluster. This code is based on stellar evolution models of the Geneva group and uses enhanced mass loss tracks for masses above 12 (Meynet et al., 1994) and standard mass loss tracks between 0.8 and 12 (Schaller et al., 1992; Schaerer et al., 1993a, b; Charbonnel et al., 1993). Starburst99 follows the evolution in the H-R diagram of a stellar population whose composition is specified by a stellar initial mass function (IMF). At a given age, the integrated SED is obtained by summing over the contributions of all stars present and is built using 1) the non-LTE WM-Basic stellar models (Pauldrach et al., 2001; Smith et al., 2002) for O stars, which take into account the effects of stellar winds and line blanketing, 2) the fully line-blanketed models calculated with the CMFGEN code (Hillier & Miller, 1998) for Wolf-Rayet (WR) stars and 3) the plane-parallel LTE models by Kurucz (1993) for the remaining stars that contribute to the continuum. We assume an instantaneous burst of star formation, a Salpeter (1955) IMF with exponent (), a lower mass cutoff M☉ and an upper mass cutoff set to 30, 50 and 100 M☉. We also assume that the stars evolve from the main sequence following the and stellar tracks (stellar tracks with are not currently available). We present models every 0.5 Myr for 10 Myr after the burst of star formation.
The chemical composition of the gas is set to (see Sect. 4.1). We have adjusted the helium abundance according to , where is the primordial helium abundance (Audouze, 1987) and is an observed constant (Pagel, 1992). To arrive at the appropriate metal abundances, we have simply scaled the solar values.
A change of the rate of Lyman ionising photons, electron density, inner radius of the shell and/or filling factor is equivalent to a change of the ionisation parameter () defined by CLOUDY as:
| (3) |
where is the distance between the ionising cluster and the illuminated surface of the gas shell and is the total hydrogen density (ionised, neutral and molecular). Basically, is the dimensionless ratio of hydrogen ionising photons to total hydrogen density. We fix an electron density equal to the rms electron density derived from radio continuum observations ( cm-3, see Sect. 4.1). is fixed individually for every photoionisation model so that the Br line flux is reproduced within 5%. Test models give that the resulting varies slightly with the cluster age, with values between and s-1, in fair agreement with the s-1 estimated from the 7 mm observations presented by Turner & Beck (2004).
Once we have fixed and , there is still a degeneracy between the inner and outer radius of the H ii region and its filling factor. From Osterbrock (1989), we have that:
| (4) |
where the rate of ionising photons emitted by the cluster () just balances the total number of H i recombinations to excited levels within the ionised volume , where is the outer radius of the gas shell. The parameter is the case B H i recombination coefficient to all levels . Using Eq. 4, we can express (Eq. 3) as a function of , and as follows:
| (5) |
where we have assumed that . The size of the source observed by Turner & Beck (2004) is pc (see Sect. 4.1). Hence, cannot be larger than 0.8 pc. The outer radius of the model comes defined by the position where the ratio of electron to total hydrogen densities reaches a value of 0.90, i.e. near the H+–H0 ionisation front. and , however, cannot be constrained from observations, but we can set them to reasonable values.
Equation 4 can be re-written as:
| (6) |
where is in pc and , with . We have adopted s-1. Physical solutions of this equation are those that satisfy the condition , which is equivalent to
| (7) |
This condition leads to for = cm-3 and pc. We note that this condition does not allow values of pc and cm-3. The minimum value allowed for the filling factor is . Hence, the final constraints on the geometry are pc, pc and . We remind that these three parameters are not independent, but have to satisfy the condition expressed by Eq. 6.

| Parameter | Value |
|---|---|
| 0.6 pc | |
| 0.8 pc | |
| 1 | |
| cm-3 | |
| 0.3 |
We evaluate now how the above variations of and modify the ionisation parameter . Fig. 2 shows the variation of for an H ii region with s-1 and = cm-3 (Eq. 3). pc (which corresponds to a filling factor ) is the maximum value allowed for the inner radius if pc. The ionisation parameter for a nebula with pc and is, according to the figure, log dex. However, regions with smaller inner radii will have larger ionisation parameters.
We will adopt a reference geometry with pc and for the main bulk of models presented hereafter. A summary of the input parameters of these fiducial models is presented in Table 3. The effect of varying (i.e. and ) and other parameters such as the slope of the IMF, the nebular metal content, the internal dust content and density structure will be discussed in the following section.
4.3 Results from the photoionisation models
Figures 3 and 4 show the main results of the photoionisation models compared to the (extinction-corrected) observed values listed in Table 1. Figure 3 shows the variation of the seven independent constraints from Table 1 ([Ar ii]/Br, [Ar iii]/Br, [S iii]/Br, [S iv]/Br, [Ne ii]/Br, [Ne iii]/Br and He i 2.06/Br) as a function of time since the burst of star formation. We note that these models reproduce the observed Br line flux within 5%. Figure 4 shows the variation of the mid-infrared line ratios [S iv]/[Ne ii], [Ar iii]/[Ne ii] and [Ne iii]/[Ne ii].
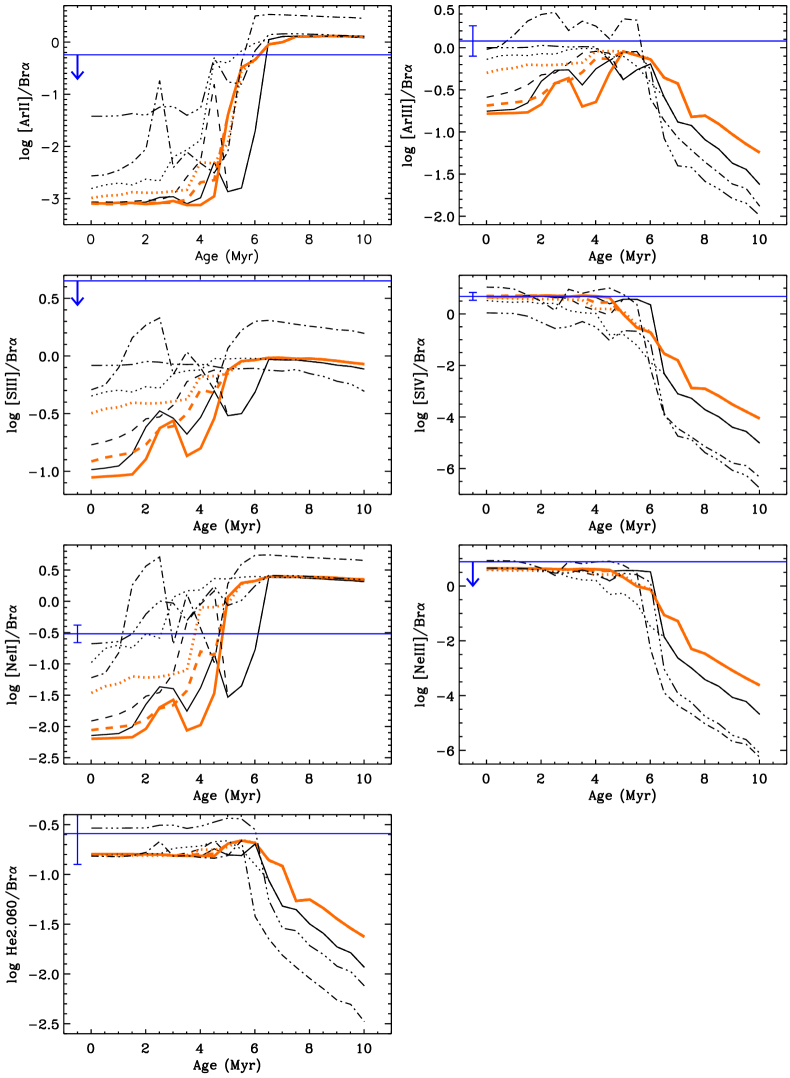
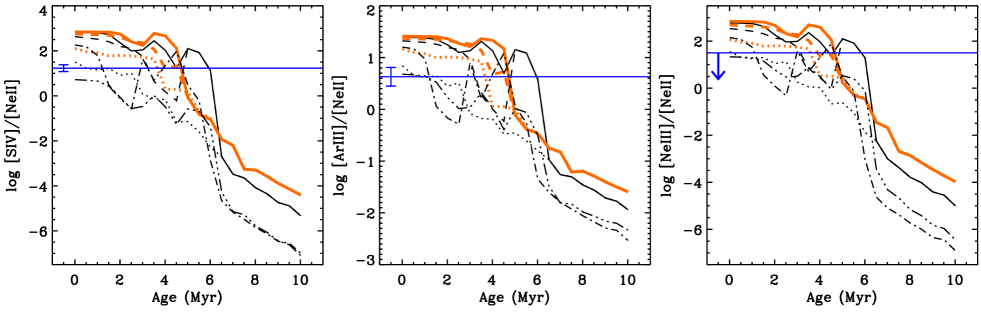
In agreement with earlier combined starburst and photoionisation models (e.g. Schaerer & Stasińska, 1999a, b; Rigby & Rieke, 2004), we observe that ratios such as [S iv]/[Ne ii], [Ar iii]/[Ne ii] and [Ne iii]/[Ne ii] (see Fig. 4) decrease smoothly during approximately the first 3 Myr as the hottest O stars leave the main sequence, increasing again from 3 to 4–6 Myr as a consequence of the contribution of the WR stars and the remaining main sequence stars to finally drop afterwards. This clearly reflects the importance of WR stars, which contribute to the ionisation of the nebula after the hottest O stars have left the main sequence. This behaviour is especially noticeable in the case of models with . This contribution of the WR stars is also observable in Fig. 3.
These figures clearly show the dependence of these line ratios on the stellar content and metallicity. A higher implies a harder stellar spectrum and consequently, a higher degree of excitation. Similarly, a lower stellar metallicity leads as well to a harder stellar spectrum.
We will focus first on the subsolar predictions. The comparison between the results of these photoionisation models and the (extinction-corrected) observed line ratios clearly shows that it is not possible to constrain at the same time both the age and of the stellar cluster. However, some conclusions can be derived. First, it is shown that NGC 5253 C2 has an age of less than 6 Myr. All model predictions beyond this age fall far from the observations. A cluster with reproduces well all the observed lines for an age of Myr. Second, a closer inspection reveals that younger clusters fit the observed line fluxes only when the upper mass cutoff is smaller. For instance, a cluster younger than about 4 Myr can only reproduce the observed line ratios if its is lower than 50. An even younger cluster of about 1 Myr could only fit the observations if its is lower than 30.
The large spectral range covered by ISO included line fluxes such as [Ar ii] 7.0, [Ne iii] 15.5 and [S iii] 18.7 m. These lines fluxes (listed in Table 1) are upper limits to the true fluxes emitted by the nebula because of the large ISO aperture. They are compared to the model predictions in Fig. 3. As it was already pointed out in Sect. 3.2, the comparison of the models with the observed line fluxes reveal that most of the emission from the high-excitation [Ne iii] line (the ionisation potential of Ne++ is 41 eV) comes from C2. However, other sources included in the ISO aperture must contribute to the low-excitation [Ar ii] and [S iii] line fluxes (Ar+ and S++ have ionisation potentials of 15.8 and 23.3 eV) since the models predict much lower fluxes. Indeed, these fluxes must be taken as upper limits. Considering that practically all the [Ne iii] line flux measured by ISO is emitted by the embedded SSC C2, we can confirm that the upper limit to the elemental abundance of neon estimated in Sect. 3.4 ([Ne/H]☉) is close to the true neon abundance of the H ii region. Since neon is a primary product of the stellar synthesis of elements and its abundance closely follows that of oxygen, we can affirm that the H ii region excited by NGC 5253 C2 is metal-poor with a metallicity close to that measured for the galaxy.
The effect of varying the ionisation parameter (i.e. and/or ) and other parameters such as the slope of the IMF, the nebular and stellar metal content, the internal dust content and the density structure, as well as the effect of a matter bounded geometry are discussed below.
4.3.1 The ionisation factor
We have adopted pc, pc and for the models presented here. As mentioned in Sect. 4.2, possible solutions for the geometry of the nebula include lower values of and . Such solutions will produce an increase of the ionisation factor, as was shown in Fig. 2, and of the general ionisation level of the nebula. Hence, the models presented in Figs. 3 and 4 provide an upper limit to the upper mass cutoff for a given starburst age in the case of the nebula having a smaller inner radius (or a larger ionisation parameter).
Another aspect that can be analysed with respect to the ionisation factor is that of how it can be lower. A decrease of or an increase of the size of the H ii region will indeed lower the parameter . Assuming that is well constrained from the observed Br line flux, other geometries must satisfy the condition given by Eq. 7. An upper limit to the size of the nebula is given by the 11.7 m image of Gorjian et al. (2001), where the source is seeing as an unresolved object with a diameter of 058 ( pc). We will take then pc as the largest possible outer radius of the nebula. Using this outer radius, the condition given by Eq. 7 requires an electron density larger than 2830 cm-3. The lowest value for the ionisation parameter is obtained considering the largest possible values for the inner radius and electron density (see Eq. 3). The electron density cannot be larger than that derived from the 7 mm observations ( cm-3) for a much smaller and compact H ii region. A nebula with pc and = cm-3 will have an ionisation parameter equal to . The filling factor of a nebular with this geometry is constrained by Eq. 7: .
We have run a set of photoionisation models using this geometry (= cm-3, pc and ) and stellar SEDs with and . These models are plotted by dashed-dotted-dotted lines in Figs. 3 and 4. They reproduce well the observed He i line flux and the [Ne iii] measured by ISO. Regarding the IR lines observed by TIMMI2, the [Ne ii] and [Ar iii] line fluxes are well reproduced by star clusters younger than 4 Myr, while the [S iv] line flux is underpredicted by a factor of about 4–15 in this age range.
Stellar clusters with an upper mass cutoff of can marginally reproduce all the observed line fluxes when the radius of the H ii region is allowed to be as large as 4.5 pc. However, the Lyman continuum photon rate we estimate from the Br line flux ( s-1) is of the order of the value obtained from the 7 mm radio observations ( s-1 when a distance of 3.25 Mpc is assumed) we use to constrain the size of the nebula. Hence, it does not seem plausible that the nebula has a radius much larger than the value of 0.8 pc we have considered.
4.3.2 The power law index of the IMF
We have adopted a Salpeter IMF with a power law index . However, for massive stars, Scalo (1986) finds a steeper IMF with . Correcting for binaries can also lead to systematically larger exponents (; Kroupa, 2002). A larger value () is also suggested by a completely independent but indirect approach based on the FIR luminosity function of IRAS point sources with colours of ultracompact H ii regions and CS(2–1) detections in the Galactic disk (Casassus et al., 2000).
We analyse here the effect of a steeper IMF on the photoionisation model results. In order to do so, we have run a set of photoionisation models with the reference parameters listed in Table 3 and stellar SEDs with , and . The effect of a steeper IMF with on the considered line ratios is not very significant. In the age interval 0–6 Myr, the predicted [Ar iii] and [Ne ii] line fluxes increase by factors and , respectively, while the [S iv] line flux decreases by a factor . Hence, there is a softening of the cluster SED because of the smaller number of very massive stars; however, the effect on the mid-IR lines is small. Concluding, an IMF with a steeper slope does not reconcile stellar clusters with and age 4 Myr with the observed line fluxes.
The effect of a top-heavy IMF (i.e. with a smaller power law index) would be a hardening of the SED because of the increased number of very massive stars. Hence, the fiducial models presented in Figs. 3 and 4 (with a Salpeter index, ) provide an upper limit to the upper mass cutoff for a given starburst age in the case of an IMF with . There are only minor indications of clusters with top-heavy IMF’s. For instance, Figer et al. (1999a) find an index for the massive Arches and Quintuplet clusters situated near the Galactic centre. There also indications of a top-heavy IMF in the massive M82-F cluster located in the starburst galaxy M82. The mass-to-light ratio derived towards this cluster (Smith & Gallagher, 2001) is significantly smaller that the ratio expected from a normal IMF, indicating a deficit of low-mass stars and a top-heavy IMF. However, other well-studied and resolved massive clusters such as 30 Doradus (Selman et al., 1999) and NGC 3603 (Eisenhauer et al., 1998) have an IMF power law index close to the Salpeter value.
4.3.3 Metal enrichment
The effect of a possible metal enrichment of the parental molecular cloud is discussed here. We have considered an H ii region with the same geometrical parameters as in the fiducial models (see Table 3) but considering solar stellar (and nebular) metallicity. The predictions of the photoionisation models are plotted in Figs. 3 and 4 by a dashed-dotted line. The general effect of increasing the metallicity is softening the SED and lowering the general ionisation level of the nebular gas. A young stellar cluster with and solar metallicity can reproduce the observed line fluxes for ages Myr.
However, the upper limits for the elemental abundances estimated in Sect. 3.4 (especially that for Ne/H, which must be close to the true neon abundance of the H ii region, see the discussion above) do not give evidences of a possible metal enrichment. This test is anyway useful to show how wrong assumptions on the metallicity can lead to wrong conclusions on the cluster properties.
4.3.4 Internal dust
The effect of adding internal dust in the nebula is to increase the absorption of ionising photons and to modify the shape of the ionising spectrum. The new CLOUDY version 96.00–beta 5 presents a very detailed treatment of the grain physics, where the heating and cooling of the gas by grain photoionisation-recombination is determined consistently and the grain size distribution is resolved. Resolving the size distribution can lead to significant changes in the emitted spectrum at IR wavelengths. CLOUDY allows the use of different grain size distribution functions. We will consider here two of these distributions: the ISM type, which reproduces the observed ratio of total to selective extinction (i.e. ), and the Orion size distribution, which is deficient in small particles and reproduces the larger observed in Orion.
We have run several photoionisation models using a stellar SED with , 1 Myr and , and the nebular parameters of the fiducial models (see Table 3). We have considered internal dust following the ISM and Orion size distributions with an abundance 0.1 times their standard abundance. This is basically a scale factor used to multiply the stored grain opacities. For both types of dust, we have fixed such that we reproduce the Br line flux within 5% (we note that the flux of Br have only been corrected for foreground extinction).
| Model | log [Ar iii]/Br | log [S iv]/Br | log [Ne ii]/Br | log [S iv]/[Ne ii] | (pc) | (pc) | ||
|---|---|---|---|---|---|---|---|---|
| #1 | 0 | 0.68 | 2.80 | 0.6 | 0.19 | |||
| #2 | 1 | 0.75 | 2.92 | 0.6 | 0.26 | |||
| #3 | 2 | 0.84 | 3.08 | 0.6 | 0.41 | |||
| #4 | 0 | 1.14 | 3.15 | 0.45 | 2.48 | |||
| #5 | 1 | 1.24 | 2.95 | 0.45 | 41.3 | |||
| #6 | 0 | 0.97 | 0.8 | |||||
| #7 | 0 | 0.8 | ||||||
| Obs |
⋆ Thickness of the shell.
A first result of these dusty models is that, in order to reproduce the observed Br flux, we get a larger with respect to the value obtained for the non-dusty models. In particular, increases to about s-1 and s-1 for the models with ISM and Orion-like dust grains, respectively. With respect to the mid-IR line fluxes, the models give the following ratios: log([Ne ii]/Br)= and , log([Ar iii]/Br)= and , log([S iv]/Br)= 0.5 and 0.7, log([S iv]/[Ne ii])=3.2 and 3.0, and log([Ar iii]/[Ne ii])=1.4 and 1.3. Hence, we see that the general ionisation level increases with respect to the non-dusty models, increasing even more the difference with the observed line fluxes. This is because the absorption cross section per H nucleon decreases for energies above 13.6 eV and consequently, the presence of dust favours the ionisation of He and other ions with respect to H.
As a conclusion, the presence of internal dust does not reconcile the stellar clusters with and age Myr with the observed line fluxes. The non-dusty models presented in Figs. 3 and 4 provide an upper limit to the upper mass cutoff for a given starburst age in the case of the presence of internal dust.
4.3.5 Density profile
We have considered so far photoionisation models with a constant electron density equal to cm-3. We will analyse now the effect of an electron density profile which is allowed to vary as a power law of the form , where is the electron density at the illuminated face of the nebula and is the nebular radius. We have run a set of models with different values of and using a stellar SED with =100 , 1 Myr and . Predictions of these models are shown in Table 4, where they are compared with the fiducial model (#1) and the observations.
The first test, which comprises models #2 and #3, analyses the effect of a density gradient with an inner density equal to cm-3. A density gradient produces a slight increase of the [S iv]/[Ne ii] line ratio and a thickening of the ionised shell when compared with the fiducial model #1. The discrepancy with the observations is even higher. This increase in [S iv]/[Ne ii] is principally due to the fact that the [S iv] 10.5 m line has a lower critical density ( cm-3) than the [Ne ii] 12.8 m line ( cm-3). Hence, a density gradient favours the enhancement of the [S iv] line with respect to the [Ne ii] line (and also with respect to the [Ar iii] line, with a critical density equal to cm-3).
The second test (models #4 and #5) studies the effect of decreasing the inner density, . As noted in Sect. 4.2, an H ii region with s-1 and pc does not allow values of the electron density lower than cm-3. As it is shown by Eq. 7, the smallest H ii region with s-1 and cm-3 would have an outer radius of pc (with pc), about 4 times larger than what is observed at radio wavelengths. In terms of the line fluxes, these models predict higher fluxes and a general increase of the excitation of the gas (as measured by [S iv]/[Ne ii]). The discrepancy with the observations is, again, higher than that of the fiducial model.
The third and final test (models #6 and #7) analyses the effect of increasing the inner density. We study two cases: and cm-3. We only consider constant densities. At these high densities, the thickness of the shell is very small and density gradients will not produce any effect on the predictions. These models predict an important decrease of the [S iv]/[Ne ii] ratio. This effect goes in the right direction to reconcile the models with =100 and the observations. The model with cm-3 even reproduces rather well the [S iv]/[Ne ii] line ratio; however, it fails to reproduce the individual fluxes of [Ar iii], [S iv] and [Ne ii]. The increase of the density up to cm-3 comes along with an important weakening of the [S iv] line flux. This weakening is also seen in the [Ar iii] line. On the contrary, the flux of the [Ne ii] slightly increases. This is because, at this high density, collisional de-excitation of the upper levels of the [Ar iii] and [S iv] lines is important, while the [Ne ii] line, with a higher critical density, is much less affected. Hence, an increase of the density, even though leads to a lower ionisation level of the nebula, fails to reproduce the observed [Ar iii] and [S iv] line fluxes, while the [Ne ii] line flux, although higher, is still underpredicted.
In conclusion, variations in the density and/or density profile do not reconcile the models with =100 and 1 Myr with the observations. The models presented in Figs. 3 and 4 provide an upper limit to the upper mass cutoff for a given starburst age in the case of power-law density profiles with inner densities lower than that assumed in the fiducial models ( cm-3). We have also shown that even though an increase of the density leads to lower values of the [S iv]/[Ne ii] ratio, such models largely underpredict the [Ar iii], [S iv] and [Ne ii] line fluxes.
4.3.6 Matter bounded geometry
The nebular models presented here have an ionisation (or radiation) bounded geometry, where the outer limit of the H ii region is defined by a hydrogen front. In this geometry, the H ii region is optically thick to the hydrogen ionising continuum and has absorbed nearly all of it. H ii regions can be also matter (or density) bounded if the outer limit is set by the edge of the cloud. In this case, the H ii region is optically thin to the incident continuum. The effect of a matter bounded geometry will be then to cut off the external parts of the nebula, i.e., the lower excitation regions, producing a nebula with a higher ionisation level. Consequently, if the nebular were matter-bounded, the upper mass cutoff of the IMF would need to be revised downward in comparison to the models discussed above (Figs. 3 and 4).
4.4 On the [O iv] emission in NGC 5253
The high-excitation [O iv] line at 25.9 m has been observed in active galactic nuclei and in some starburst galaxies including NGC 5253 (e.g. Genzel et al., 1998; Lutz et al., 1998). The ionisation edge for the creation of O iv (54.9 eV) is just beyond the He ii edge where normal stars emit little flux and hence, the origin of such high-excitation line in starbursts has been unclear. Different excitation mechanisms such as weak AGNs, super-hot stars (e.g. WR stars), planetary nebulae and ionising shocks related to the starburst activity have been proposed by Lutz et al. (1998). These authors favour ionising shocks as the most likely explanation for the presence of [O iv] emission in starburst galaxies. Schaerer & Stasińska (1999a), on the other hand, propose that the emission of [O iv] 25.9 m observed with ISO in the two dwarf galaxies NGC 5253 and II Zw 40 is due to the presence of hot WR stars. Independently of the origin of the [O iv] emission, the mere presence of such high energy source(s) in NGC 5253 calls for an examination of their possible effects on the photoionisation models presented above and on the robustness of the results. We shall briefly address this now.
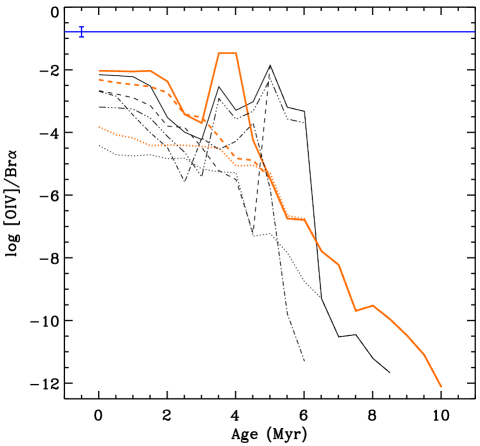
First we assume that the [O iv] 25.9 m emission observed in the ISO-SWS aperture originates from the cluster C2. Figure 5 shows the observed and predicted [O iv]/Br line ratio from the starburst models discussed above (Figs. 3 and 4). Manifestly, the predicted strength of the [O iv] line is much lower than observed. In the best case (the model with =100 and ), [O iv]/Br reaches few percent (%) between 3 to 5 Myr when WR stars are present. In contrast to the models of Schaerer & Stasińska (1999a), the discrepancy between the observed and predicted [O iv] emission found here is due to 1) softer stellar atmosphere models (mostly WR spectra including line blanketing; Smith et al. 2002), and 2) a reliable constraint on the ionisation parameter.
Can the models be reconciled with the observed [O iv] line flux?
In principle this could be possible by increasing the ionisation parameter – e.g. by adopting a smaller inner radius and/or a density gradient and/or internal dust and/or a top-heavy IMF (see Sect. 4.3). However, as discussed previously, such an increase of would cause a larger discrepancy between the models with =100 and the other mid-IR lines. In particular, the [Ar iii] line flux, which is barely reproduced by the fiducial models with =100 would be largely underpredicted.
A more promising way to circumvent the shortfall of the observed [O iv] line flux is by considering that the adopted spectral energy distribution of the cluster close to and beyond the He ii edge is not well defined. This could be justified for several reasons. First, X-emission in early type stars can alter their ionising spectra at high energies (see e.g. Pauldrach et al., 2001; Schaerer & de Koter, 1997; MacFarlane et al., 1994, and discussion therein). Second, other sources of high energy photons as binaries or shocks responsible of soft X-ray emission could be present in C2 (Summers et al., 2004). In this situation, the ionising spectrum could be increased at high energy such as to enhance the [O iv] emission without altering the ionisation structure (and hence the emission line strengths) of the other observed ions whose ionisation potentials are lower ( 30–40 eV). Indeed, after several ad-hoc modifications of the library SEDs beyond eV, we have verified that a spectral energy distribution with 555Here and stand for the ionising flux capable to ionise H and He+ respectively. can reproduce both the observed [O iv] line flux and the other constraints. This corresponds to a harder SED than typically expected for starbursts (cf. Smith & Gallagher, 2001). For instance, the hardest Starburst99 model used above (a burst at 4 Myr) has , whereas in other models one typically has –5 to –6. In fact, if the X-ray luminosity determined for region #19 by Summers et al. (2004) is attributed to C2, one has , considerably higher than the “normal” X-ray luminosity of early type stars (Chlebowski et al., 1989). Invoking a harder SED than predicted by standard synthesis models would therefore seem justified. Finally the postulated hardness of would correspond to an optical line ratio of , a hardness not unusual in metal-poor H ii regions and Wolf-Rayet galaxies (cf. Guseva et al., 2000).
From the above we see that is possible to construct models able to reconcile the observed ISO [O iv] 25.9 m emission with the other observables for the cluster C2 without altering our conclusions on the age, IMF etc. Furthermore, the required harder ionising spectrum does not seem physically unplausible. On the other hand, it is not excluded that part or all of the [O iv] line flux is not related to C2 and comes from another object included in the large ISO-SWS aperture. In this case, our observations and modelling require, for consistency, that this source shows a rather faint [Ar iii] 9.0 m emission and a [S iv] 10.5 m comparable or less than C2. Mid-infrared observations with Spitzer should be able to test these predictions.
5 Discussion
5.1 Importance of high spatial resolution observations
We have shown the importance of high spatial resolution observations of extra-galactic star clusters. Only such observations provide accurate measurements of the line fluxes emitted by the cluster itself and avoid contamination by other clusters, the local ISM, etc. For instance, in the case of NGC 5253 C2, while most of the high-excitation [S iv] and [Ne iii] line fluxes measured by the large ISO aperture is emitted by the H ii region associated to the cluster, other sources largely contribute to the low-excitation [Ar ii], [S iii] and [Ne ii] line fluxes. For example, the remaining presumably “diffuse” [Ne ii] emission in the large ISO aperture amounts to 80% of the total emission.
This has implications not only in the interpretation of line fluxes in term of the properties (age, IMF, etc.) of the embedded cluster (e.g. Crowther et al., 1999; Thornley et al., 2000; Rigby & Rieke, 2004), but also on the modelling of the SED (e.g. Vanzi & Sauvage, 2004), where contamination by background radiation from the underlying galaxy and other sources might lead to erroneous conclusions.
High spatial resolution observations also provide important constraints on the nebular geometry (size, electron density, etc.). The interpretation of nebular lines in terms of properties of the ionising cluster depends on photoionisation models which have as free parameters the SED of the cluster ( and age), the local abundance and the ionisation parameter . In particular, the parameter , which depends on the geometry, is generally strongly underconstrained, leading to wrong conclusions. Along these lines, we have shown how two SEDs with different can lead to similar conclusions when two different geometries are considered (see Sect. 4.3.1). The same holds when the local abundance is not properly taken into account (cf. Sect. 4.3.3).
We have thus demonstrated that the spatial scale of the observations greatly determine the mid-IR appearance of NGC 5253. Similar aperture effects affecting both the line and PAH emission fluxes have been observed by Siebenmorgen et al. (2004) in luminous IR galaxies. However, it is likely that “global” mid-IR (ISO or even the smaller Spitzer aperture) diagnostics give to a large extent correct answers concerning AGN/starburst diagnostics. This is supported by the comparison with optical diagnostics, which mostly agree with the mid-IR ones (cf. Genzel et al., 1998; Laurent et al., 2000; Peeters et al., 2004). However, more detailed and subtle diagnostics (IMF, age, etc.) are probably more prone to aperture effects.
5.2 Constraints on the age and upper mass cutoff
It has been claimed that the IMF upper mass cutoff is not well defined, but is given by the stochastic nature of the IMF (cf. Elmegreen, 1997). However, NGC 5253 C2 is massive enough (see Table 5) to be populated with stars up to (cf. Weidner & Kroupa, 2004).
For NGC 5253 C2, strong constraints on the geometry (i.e. Lyman photon rate, density, filling factor and inner/outer radius of the nebula) based on high spatial observations in the near-IR (HST and Keck), mid-IR (TIMMI2) and radio (VLA) lead to an ionisation parameter dex. This restriction on the parameter allows us to conclude that a cluster with an upper mass cutoff of 100 can only reproduce the observed line fluxes if its age is about 5–6 Myr, above the upper limit set by the non presence of supernovae ( Myr). A cluster younger than about 4 Myr can fit the observations if its . A young cluster of 1 Myr would only be consistent with an even lower upper mass cutoff (around 30 M☉). This result is practically independent on the power law index of the IMF (cf. Sect. 4.3.2), the internal dust content (cf. Sect. 4.3.4) and the density profile (cf. Sect. 4.3.5).
The photoionisation models allow higher values of the upper mass cutoff for ages Myr only in the case of an H ii region much larger than what the radio continuum images imply (cf. Sect. 4.3.1) or when a solar metallicity, for which there is no indication, is considered for the cluster (cf. Sect. 4.3.3).
In short, we are left schematically with two possible solutions due to an age degeneracy: 1) a young ( 4 Myr) cluster with a clear evidence for a “non-standard”, low, upper mass cutoff of the IMF, or 2) a cluster of 5–6 Myr with a “standard” high upper mass cutoff. The existing age constraints have been described above (Sect. 4.1). Let us now discuss these two cases and their implications.
5.2.1 A young cluster deficient in massive stars?
A young age ( 3–4 Myr) would agree with the lack of supernovae signatures in C2, but it would imply a “non-standard” IMF with a low upper mass cutoff (). Indeed, so far there is a general consensus from various studies of individual stars in clusters that stars of at least 100 are formed and that most likely 120–150 quite independently of metallicity and other “environmental” conditions (e.g. Massey & Hunter 1998, Figer et al. 1999a, Kroupa 2002, Weidner & Kroupa 2004 and reviews in Gilmore & Howell 1998 and Corbelli et al. 2004). has also been found from integrated light studies of (giant) extra-galactic H ii regions, H ii galaxies and alike objects at sub-solar metallicities (cf. reviews of Leitherer 1998 and Schaerer 2003). Even at high metallicity, recent direct studies of the stellar content indicate a high/normal value of (Pindao et al., 2002). Claims for a low upper mass cutoff of the IMF have been made repeatedly (e.g. Goldader et al., 1997; Bresolin et al., 1999; Coziol et al., 2001; Rigby & Rieke, 2004). However, these claims are essentially based on less direct diagnostics involving nebular line observations, large apertures and/or objects with complex structures which render their interpretation more difficult. Here we find, for the first time, an indication for a “non-standard”, low upper mass cutoff of the IMF for an individual massive cluster. If true, this implies that the IMF is different and not fully populated up to the largest masses in some regions/objects. What is responsible for this deviation remains, however, unknown as apparently similar clusters with a normal IMF exist (cf. list in Table 5). Is it related to the cluster mass, to its strong gravitational potential, or dependent on other properties? Do dynamical processes and interactions play a role in establishing the IMF in such a case? A better understanding of the IMF and its origin are needed before these questions can be answered.
What are the implications from a massive star deficiency? This obviously depends on the physical quantity of interest and on how general such a case is. Studies of additional hidden SSCs will obviously be of interest to examine if our result is also found for other objects. For example, we simply note that the bolometric luminosity emitted by a massive young ( 4–5 Myr) cluster with is 1 mag smaller per unit stellar mass than for a normal 100 . In other words the contribution of such a hidden cluster to the dust heating and IR flux is reduced by the same amount.
5.2.2 An “old” hidden compact cluster?
The solution of an “old” age of 5–6 Myr raises several question. First, how is it possible to “contain” and hide such a compact cluster so long? With a much higher electron density ( cm-3) than what it is commonly found in typical giant extra-galactic H ii regions ( cm-3), NGC 5253 C2 should be overpressured compared to the surrounding ionised gas. At such high pressure, the region would expand rapidly to reestablish pressure equilibrium. Following Wood & Churchwell (1989b), we find that with an age of 5–6 Myr and under no other additional external pressure, C2 would have expanded until a size of 22–24 pc in diameter. However, this size is more than 10 times what it is observed at radio wavelengths (1.6 by 0.6 pc, cf. Sect. 4.1). The most simple explanation seems that the cluster mass is large enough to allow its own gravitational confinement (self-gravity), as suggested by Turner et al. (2003) and Tan & McKee (2004).
While several other compact hidden clusters have been known for several years (Kobulnicky & Johnson, 1999; Neff & Ulvestad, 2000; Beck et al., 2002) they are generally thought to be very young with ages ( 1–4 Myr) mainly based on compactness arguments. In some cases also, compact thermal radio sources seem to show optical counterparts providing age estimates of 0–4 Myr (Whitmore & Zhang, 2002). Here, however, our analysis indicates for the first time that such hidden clusters could live longer. The “average” fraction of the lifetime massive stars spend buried in their parent molecular clouds can also be estimated by comparing the number of “hidden” O stars to the total observed in the galaxy. The hidden cluster C2 is powered by Lyman continuum photons per second, which implies about 2000 O7 V equivalent stars. Over a 30″ aperture, the total (extinction-corrected) Br line flux is W cm-2, which is equivalent to s-1 and 5000 O7 V equivalent stars. Based on these estimates, O stars in NGC 5253 might spend approximately 40% of their lives in the embedded phase. This percentage is much larger than the 10%–20% estimated for Galactic ultracompact H ii regions (cf. Wood & Churchwell, 1989a) and the 15% estimated for young ultradense H ii regions in the young starburst galaxy He 2–10 by Kobulnicky & Johnson (1999).
If this scenario is true, it remains to be understood what determines the duration of the “hidden” phase of SSCs allowing for significant variations of the latter. Is it the cluster mass, concentration, its gravitational potential, external effects or others? The only clue we have so far is that the cluster C2 analysed here is among the most massive and compact ones (see Table 5). Future detailed studies of young massive clusters should be able to able to shed more light into these questions.
On the other hand, the “old” solution of 5–6 Myr is somewhat puzzling given the apparent absence of supernovae in this region of NGC 5253 (cf. 4.1). Indeed, given the high luminosity/Lyman continuum production of C2 (see Table 5) one expects a supernova rate of at least 100 SN/Myr after approximately 3 Myr (e.g. Cerviño et al., 2000) or in other words, at least a total of several hundred past SN explosions at an age of 5–6 Myr from stars with initial masses 35–40 . However, it seems difficult to understand how such a large number of supernovae could be “hidden” without giving raise to non-thermal radio emission especially in such a high density region (cf. Chevalier & Fransson, 2001).
| Cluster | Radius (pc) | Age (Myr) | Ref. | ||||
|---|---|---|---|---|---|---|---|
| NGC 5253 C2 | 0.8 | 9.0 | 52.3 | 1, 2, 3, 4 | |||
| Quintuplet | 3.8⋆ | 1.0 | 3.2 | 3–6 | 7.5 | 50.9 | 5 |
| Arches | 4.3⋆ | 0.19 | 5.8 | 1–2 | 8.0 | 51.0 | 5 |
| Gal. Center | 4.0⋆ | 0.23 | 5.6 | 3–7 | 7.3 | 50.5 | 5 |
| NGC 3603 | 3.7⋆ | 0.23 | 5.0 | 2.5 | 7.3 | 51.1 | 5 |
| R136 | 4.5⋆ | 1.6 | 3.3 | 51.9 | 5 | ||
| MGG–11△ | 5.5♭ | 1.2 | 4.7 | 7–12 | … | … | 6 |
| W992♮ | 6.3♭ | 4.5 | … | 7 | … | … | 7 |
⋄ If due to virialised motions, the Br line width measured by Turner et al. (2003) indicates a cluster mass of the order of for a Salpeter IMF slope and a lower mass cutoff of or less. ⋆ Total cluster mass in all stars extrapolated down to a lower mass cutoff of 1 , assuming a Salpeter IMF slope and an upper mass cutoff of 120 . ♭ Kinematic mass. △ Star cluster in M82. ♮ Star cluster in NGC 4038/4039. REFERENCES: (1) This work; (2) Turner & Beck (2004); (3) Vanzi & Sauvage (2004); (4) Alonso-Herrero et al. (2004); (5) Figer et al. (1999b); (6) McCrady et al. (2003); (7) Mengel et al. (2002).
5.3 Comparison with previous mid-IR constraints on the IMF
In the case of NGC 5253 we are facing an apparent “contradiction”. The ISO observations show that NGC 5253 is, with II Zw 40, the object with the highest excitation within the ISO extra-galactic sample (as measured by [Ne iii]/[Ne ii]). For this reason this object is considered as “unproblematic”, i.e. compatible with a normal Salpeter IMF extending to at least 40–60 (Rigby & Rieke, 2004) in contrast to the majority of the starbursts observed by ISO. In addition, our observations now indicate an even higher excitation for the SSC C2. Why then do we here face this difficulty of reconciling the observations with a “normal”, high value of ? The answer to this apparent contradiction is simple: the difficulty arises from the fact that a proper geometrical constraint is used here for the first time implying a fairly large ionisation parameter. Had we neglected the information on the spatial extent (or better said the compactness) of the emission associated with C2, we would easily be able to reconcile the observations with a standard value of for any burst age. This case illustrates the potentially severe limitations inherent in the traditional interpretations of fine structure line ratios when the source distribution and geometry are unknown. However, from the single case study presented here it is not possible to generalise the conclusions.
5.4 Comparison with other massive clusters
A stellar cluster with = 100 and an age of 6 Myr would have a total cluster mass and a total number of stars for a Salpeter IMF slope extending down to 1 . A stellar cluster with = 50 and an age of 4 Myr would have and . Finally, a stellar cluster with and 1 Myr would have and .
Table 5 compares NGC 5253 C2 and other massive clusters in mass, size, density, age, luminosity and Lyman continuum flux. NGC 5253 C2 is most comparable in mass to MGG–11 and W992, but it is younger. In terms of mass density, NGC 5253 C2 is comparable to the Galactic Centre and Arches clusters, but it has a higher luminosity and produces more ionising photons.
Regarding the upper mass cutoff, studies of R136, the ionising cluster of 30 Doradus, find that the most probable upper mass limit in the Large Magellanic Cloud is about 130 M☉ (cf. Selman et al., 1999). Towards the Arches cluster, Figer et al. (1999a) find that there more than 10 stars with masses larger than 120 M☉. If true, the case of a low upper mass cutoff in NGC 5253 C2 would greatly differ with the high values found in these massive clusters.
5.5 Host of an intermediate mass black hole?
Recent dynamical simulations by Portegies Zwart et al. (2004) show that massive stars in young dense clusters can sink rapidly to the centre of the cluster to participate in a runaway collision and produce a star of 800–3000 which ultimately collapses to a black hole of intermediate mass (see also Gürkan et al. 2004 and references therein).
The conditions for the formation of a black hole inside a dense cluster depend on two distinct parameters, the concentration parameter () and the dynamical friction timescale (). The parameter is defined as , where and represent the tidal radius and the core radius, respectively; is the time taken for a star of a certain mass to sink to the cluster centre from a circular orbit at initial distance . According to the simulations by Portegies Zwart et al. (2004), the requirement for the formation of such a black hole is that the cluster is born with and that Myr. The 4 Myr upper limit for is such that massive stars can easily reach the centre of the cluster before exploding as supernovae.These authors’ simulations indicate that in the cluster MGG–11, located in M82 and associated with an ultraluminous X-ray source, a runaway star could form on the necessary timescale. In the case of NGC 5253 C2, we find Myr, calculated for a star of 50 starting at a radius of 0.8 pc. As stated by Portegies Zwart et al. (2004), less massive stars undergo weaker friction and thus must start at smaller radii in order to reach the cluster centre on a similar timescale. Hence, an intermediate mass black hole might form through runaway collisions in the core of NGC 5253 C2.
Recent Chandra and XMM-Newton observations of NGC 5253 (Summers et al., 2004) have found a X-ray point source at the peak of the radio emission associated with C2 (their source #19). However, this X-ray source is very soft, with very few counts above 1.0 keV and virtually none above 2.0 keV. The authors suggest that this X-ray emission is associated with the emission from superbubles surrounding the inner cluster rather than with an individual harder object such as a black hole. Besides, they find that the X-ray emission coincident with C2 seems to be extended compared to the Chandra PSF, reinforcing the idea that the emission is associated with the cluster. Hence, although it seems that X-ray observations show no evidence for the presence of a black hole within C2, it is a possibility that deserves certain consideration.
6 Conclusions
We have presented the -band (8–13 m) spectrum of the hidden compact radio super-star cluster in NGC 5253, C2, obtained with TIMMI2 on the ESO 3.6 m telescope. The spectrum is characterised by a rising continuum due to warm dust, a silicate absorption and a strong [S iv] line at 10.5 m. Weaker lines of [Ar iii] at 9.0 m and [Ne ii] at 12.8 m are also present. The continuum can be modeled by an optically thick emission from hot ( K) dust emission extinguished by a cold foreground dust screen and a silicate absorption feature with mag.
It has been demonstrated that the spatial scale of the observations greatly determine the mid-IR appearance of NGC 5253. In particular, most of the high-excitation [Ar iii], [S iv] and [Ne iii] line fluxes measured by the large ISO aperture are emitted by C2, while other sources largely contribute to the low-excitation [Ar ii], [S iii] and [Ne ii] line fluxes. This has important implications in the interpretation of line fluxes in terms of the properties (age, IMF etc.) of the embedded cluster. For instance, the present data indicate an even higher excitation for C2 compared to the observations through the large ISO/SWS aperture.
We have computed sets of nebular models with the photoionisation code CLOUDY using the evolutionary synthesis code Starburst99 to model the integrated properties of the stellar cluster. It has been shown that the interpretation of the nebular lines in terms of properties of the ionising cluster depends largely on the local abundance and the ionisation parameter . The detailed dependence of the mid-IR lines on other parameters such as the cluster age, upper mass cutoff and power law index of the IMF, as well as the presence of internal dust and the density structure is largely discussed. In the case of the SSC C2, high spatial resolution observations at different wavelengths – near-IR (HST and Keck), mid-IR (TIMMI2) and radio (VLA) – have allowed us to strongly constrain the geometry of the region (i.e. Lyman photon rate, density, filling factor and inner/outer radius), leading to an ionisation parameter dex. This constraint on lead to two possible solutions for the age and upper mass cutoff of C2 when comparing the observed line fluxes with the predicted ones: 1) a young ( Myr) cluster with a ”non-standard” IMF with a low upper mass cutoff , and 2) a cluster of Myr with a standard high upper mass cutoff ( ). The photoionisation models allow higher values of for ages Myr only in the case of an H ii region much larger than what the radio continuum imply or when a solar metallicity, for which there is no indication, is considered for the cluster. A young age ( 4 Myr) would agree with the lack of supernovae signatures in C2 and in case of being confirmed, would be the first indication for a “non-standard”, low upper mass cutoff of the IMF for an individual massive cluster. An older age of 5–6 Myr would imply that it is possible to “contain” and hide such a compact cluster for a longer time that what it is generally thought. Arguments in favour and against these two scenarios are presented. Based on the available information, we are not able to favour one solution over the other. A better understanding of the signature of supernovae from massive star progenitors in compact and dense environments, as well as radio observations at even higher spatial resolution, would permit to exclude or not the ages above 4 Myr. Besides, mid-IR observations at even higher spatial resolution (which can be performed e.g. in the near future with VISIR on the VLT), would allow determining the exact size of C2 at these wavelengths and resolving its ionisation structure. In particular, resolving the ionsation structure of C2 would be useful to verify if the lines we are using for our photoionisation analysis come from the same region or if there is any contamination by the close presence of the optical stellar cluster C1. Observations of massive stellar clusters with similar characteristics will be as well essential to see if the same result is found.
We have addressed as well the origin of the [O iv] 25.9 m emission measured by ISO assuming that all of it originates from the SSC C2. The strength of the [O iv] line predicted by the photoionisation models is much lower than observed. However, it has been shown that it is possible to construct models able to reconcile the observed ISO [O iv] emission with the other mid-IR lines by modifying the adopted SED of the cluster close to and beyond the He ii edge. A SED with can reproduce all the observables. This hardness would correspond to an optical line ratio of , not unusual in metal-poor H ii regions and Wolf-Rayet galaxies.
Finally, based on dynamical simulations, we consider the possibility that an intermediate mass black hole might form through runaway collisions in the core of C2. However, recent X-ray observations show that the X-ray source associated with C2 is very soft and it is most probably associated with the emission from superbubles surrounding the inner cluster.
Acknowledgements.
We have benefited from numerous discussions with and suggestions from a number of colleagues. Among them we would like to thank Grazyna Stasińska, Claus Leitherer and Berhard Brandl in particular. We also thank Almudena Alonso-Herrero for communicating results prior to publication. Finally, we want to thank Els Peeters for providing us with fully reduced ISO/SWS spectra and Ilaria Pascucci for letting us use her IDL routine to fit the mid-IR dust continuum. This work was supported by the Swiss National Foundation, the French Centre National de la Recherche Scientifique, and CEA.Appendix A The 18 m flux of NGC 5253 C2
Besides the -band spectrum, we also obtain an image of NGC 5253 C2 in the band (50% band cuts are 17.35 and 18.15 m). The object appears unresolved, with a FWHM of . The flux was calibrated using the standard star HD 123139. We obtain a total flux of Jy. This value is times larger than the 18.7 m flux reported by Gorjian et al. (2001); Jy. However, according to Gorjian (private communication), their low 18.7 m flux could be due to a too small chopping throw, resulting in an incorrect zero-level, or to a complex airmass correction.
References
- Allamandola et al. (1989) Allamandola, L. J., Tielens, A. G. G. M., & Barker, J. R. 1989, ApJS, 71, 733
- Allende Prieto et al. (2001) Allende Prieto, C., Lambert, D. L., & Asplund, M. 2001, ApJ Lett., 556, L63
- Alonso-Herrero et al. (2004) Alonso-Herrero, A., Takagi, T., Baker, A. J., et al. 2004, ApJ, in print
- Audouze (1987) Audouze, J. 1987, in IAU Symp. 124: Observational Cosmology, Vol. 124, 89–115
- Beck et al. (1996) Beck, S. C., Turner, J. L., Ho, P. T. P., Lacy, J. H., & Kelly, D. M. 1996, ApJ, 457, 610
- Beck et al. (2002) Beck, S. C., Turner, J. L., Langland-Shula, L. E., et al. 2002, AJ, 124, 2516
- Böker et al. (1998) Böker, T., Krabbe, A., & Storey, J. W. V. 1998, ApJ Lett., 498, L115
- Bresolin et al. (1999) Bresolin, F., Kennicutt, R. C., & Garnett, D. R. 1999, ApJ, 510, 104
- Campbell et al. (1986) Campbell, A., Terlevich, R., & Melnick, J. 1986, MNRAS, 223, 811
- Casassus et al. (2000) Casassus, S., Bronfman, L., May, J., & Nyman, L.-Å. 2000, A&A, 358, 514
- Cerviño et al. (2000) Cerviño, M., Knödlseder, J., Schaerer, D., von Ballmoos, P., & Meynet, G. 2000, A&A, 363, 970
- Charbonnel et al. (1993) Charbonnel, C., Meynet, G., Maeder, A., Schaller, G., & Schaerer, D. 1993, A&AS, 101, 415
- Chevalier & Fransson (2001) Chevalier, R. A. & Fransson, C. 2001, ApJ Lett., 558, L27
- Chlebowski et al. (1989) Chlebowski, T., Harnden, F. R., & Sciortino, S. 1989, ApJ, 341, 427
- Cohen et al. (1999) Cohen, M., Walker, R. G., Carter, B., et al. 1999, ApJ, 117, 1864
- Corbelli et al. (2004) Corbelli, E., Palla, F., & Zinnecker, H. 2004, IMF@50, The Initial Mass Function 50 years later (Astrophysics and Space Science, in press)
- Coziol et al. (2001) Coziol, R., Doyon, R., & Demers, S. 2001, MNRAS, 325, 1081
- Crowther et al. (1999) Crowther, P. A., Beck, S. C., Willis, A. J., et al. 1999, MNRAS, 304, 654
- Eisenhauer et al. (1998) Eisenhauer, F., Quirrenbach, A., Zinnecker, H., & Genzel, R. 1998, ApJ, 498, 278
- Elmegreen (1997) Elmegreen, B. G. 1997, ApJ, 486, 944
- Ferland et al. (1998) Ferland, G. J., Korista, K. T., Verner, D. A., et al. 1998, PASP, 110, 761
- Figer et al. (1999a) Figer, D. F., Kim, S. S., Morris, M., et al. 1999a, ApJ, 525, 750
- Figer et al. (1999b) Figer, D. F., McLean, I. S., & Morris, M. 1999b, ApJ, 514, 202
- Freedman et al. (2001) Freedman, W. L., Madore, B. F., Gibson, B. K., et al. 2001, ApJ, 553, 47
- Gürkan et al. (2004) Gürkan, M. A., Freitag, M., & Rasio, F. A. 2004, ApJ, 604, 632
- Garay et al. (1993) Garay, G., Rodríguez, L. F., Moran, J. M., & Churchwell, E. 1993, ApJ, 418, 368
- Genzel & Cesarsky (2000) Genzel, R. & Cesarsky, C. J. 2000, ARA&A, 38, 761
- Genzel et al. (1998) Genzel, R., Lutz, D., Sturm, E., et al. 1998, ApJ, 498, 579
- Gilmore & Howell (1998) Gilmore, G. & Howell, D. 1998, The Stellar Initial Mass Function, 38th Herstmonceux Conference (ASP Conference Series, Vol. 142)
- Goldader et al. (1997) Goldader, J. D., Joseph, R. D., Doyon, R., & Sanders, D. B. 1997, ApJ, 474, 104
- Gorjian et al. (2001) Gorjian, V., Turner, J. L., & Beck, S. C. 2001, ApJ Lett., 554, L29
- Guseva et al. (2000) Guseva, N. G., Izotov, Y. I., & Thuan, T. X. 2000, ApJ, 531, 776
- Hillier & Miller (1998) Hillier, D. J. & Miller, D. L. 1998, ApJ, 496, 407
- Horne (1986) Horne, K. 1986, PASP, 98, 609
- Hummer & Storey (1987) Hummer, D. G. & Storey, P. J. 1987, MNRAS, 224, 801
- Kobulnicky & Johnson (1999) Kobulnicky, H. A. & Johnson, K. E. 1999, ApJ, 527, 154
- Kobulnicky et al. (1997) Kobulnicky, H. A., Skillman, E. D., Roy, J., Walsh, J. R., & Rosa, M. R. 1997, ApJ, 477, 679
- Kroupa (2002) Kroupa, P. 2002, Science, 295, 82
- Kurucz (1993) Kurucz, R. 1993, ATLAS9 Stellar Atmosphere Programs and 2 km/s grid. Kurucz CD-ROM No. 13. Cambridge, Mass.: Smithsonian Astrophysical Observatory, 1993., 13
- Laurent et al. (2000) Laurent, O., Mirabel, I. F., Charmandaris, V., et al. 2000, A&A, 359, 887
- Leitherer (1998) Leitherer, C. 1998, in ASP Conf. Ser. 142: The Stellar Initial Mass Function (38th Herstmonceux Conference), 61
- Leitherer et al. (1999) Leitherer, C., Schaerer, D., Goldader, J. D., et al. 1999, ApJS, 123, 3
- Lumsden et al. (1994) Lumsden, S. L., Puxley, P. J., & Doherty, R. M. 1994, MNRAS, 268, 821
- Lutz et al. (1998) Lutz, D., Kunze, D., Spoon, H. W. W., & Thornley, M. D. 1998, A&A, 333, L75
- MacFarlane et al. (1994) MacFarlane, J. J., Cohen, D. H., & Wang, P. 1994, ApJ, 437, 351
- Madden (2002) Madden, S. C. 2002, Ap&SS, 281, 247
- Martín-Hernández et al. (2003) Martín-Hernández, N. L., van der Hulst, J. M., & Tielens, A. G. G. M. 2003, A&A, 407, 957
- Martín-Hernández et al. (2002a) Martín-Hernández, N. L., Peeters, E., Morisset, C., et al. 2002a, A&A, 381, 606
- Martín-Hernández et al. (2002b) Martín-Hernández, N. L., Vermeij, R., Tielens, A. G. G. M., van der Hulst, J. M., & Peeters, E. 2002b, A&A, 389, 286
- Massey & Hunter (1998) Massey, P. & Hunter, D. A. 1998, ApJ, 493, 180
- Mathis (1990) Mathis, J. S. 1990, ARA&A, 28, 37
- McCrady et al. (2003) McCrady, N., Gilbert, A. M., & Graham, J. R. 2003, ApJ, 596, 240
- Mengel et al. (2002) Mengel, S., Lehnert, M. D., Thatte, N., & Genzel, R. 2002, A&A, 383, 137
- Meurer et al. (1995) Meurer, G. R., Heckman, T. M., Leitherer, C., et al. 1995, AJ, 110, 2665
- Meynet et al. (1994) Meynet, G., Maeder, A., Schaller, G., Schaerer, D., & Charbonnel, C. 1994, A&AS, 103, 97
- Neff & Ulvestad (2000) Neff, S. G. & Ulvestad, J. S. 2000, AJ, 120, 670
- Okamoto et al. (2001) Okamoto, Y. K., Kataza, H., Yamashita, T., Miyata, T., & Onaka, T. 2001, ApJ, 553, 254
- Okamoto et al. (2003) Okamoto, Y. K., Kataza, H., Yamashita, T., et al. 2003, ApJ, 584, 368
- Osterbrock (1989) Osterbrock, D. E. 1989, Astrophysics of gaseous nebulae and active galactic nuclei (Research supported by the University of California, John Simon Guggenheim Memorial Foundation, University of Minnesota, et al. Mill Valley, CA, University Science Books)
- Pagel (1992) Pagel, B. E. J. 1992, in IAU Symp. 149: The Stellar Populations of Galaxies, Vol. 149, 133
- Panagia & Walmsley (1978) Panagia, N. & Walmsley, C. M. 1978, A&A, 70, 411
- Pauldrach et al. (2001) Pauldrach, A. W. A., Hoffmann, T. L., & Lennon, M. 2001, A&A, 375, 161
- Peeters et al. (2002) Peeters, E., Martín-Hernández, N. L., Damour, F., et al. 2002, A&A, 381, 571
- Peeters et al. (2004) Peeters, E., Spoon, H. W. W., & Tielens, A. G. G. M. 2004, ApJ, in print; astro-ph/0406183
- Pindao et al. (2002) Pindao, M., Schaerer, D., González Delgado, R. M., & Stasińska, G. 2002, A&A, 394, 443
- Portegies Zwart et al. (2004) Portegies Zwart, S. F., Baumgardt, H., Hut, P., Makino, J., & McMillan, S. L. W. 2004, Nature, 428, 724
- Rigby & Rieke (2004) Rigby, J. R. & Rieke, G. H. 2004, ApJ, 606, 237
- Roche & Aitken (1984) Roche, P. F. & Aitken, D. K. 1984, MNRAS, 208, 481
- Rubin et al. (1988) Rubin, R. H., Simpson, J. P., Erickson, E. F., & Haas, M. R. 1988, ApJ, 327, 377
- Salpeter (1955) Salpeter, E. E. 1955, ApJ, 121, 161
- Scalo (1986) Scalo, J. M. 1986, Fundamentals of Cosmic Physics, 11, 1
- Schaerer (2003) Schaerer, D. 2003, in in IAU Symposium 212, 642
- Schaerer et al. (1993a) Schaerer, D., Charbonnel, C., Meynet, G., Maeder, A., & Schaller, G. 1993a, A&AS, 102, 339
- Schaerer & de Koter (1997) Schaerer, D. & de Koter, A. 1997, A&A, 322, 598
- Schaerer et al. (1993b) Schaerer, D., Meynet, G., Maeder, A., & Schaller, G. 1993b, A&AS, 98, 523
- Schaerer & Stasińska (1999a) Schaerer, D. & Stasińska, G. 1999a, A&A, 345, L17
- Schaerer & Stasińska (1999b) Schaerer, D. & Stasińska, G. 1999b, in ESA SP-427: The Universe as Seen by ISO, 751
- Schaller et al. (1992) Schaller, G., Schaerer, D., Meynet, G., & Maeder, A. 1992, A&AS, 96, 269
- Selman et al. (1999) Selman, F., Melnick, J., Bosch, G., & Terlevich, R. 1999, A&A, 347, 532
- Siebenmorgen et al. (2004) Siebenmorgen, R., Krügel, E., & Spoon, H. W. W. 2004, A&A, 414, 123
- Smith & Gallagher (2001) Smith, L. J. & Gallagher, J. S. 2001, MNRAS, 326, 1027
- Smith et al. (2002) Smith, L. J., Norris, R. P. F., & Crowther, P. A. 2002, MNRAS, 337, 1309
- Soifer et al. (2002) Soifer, B. T., Neugebauer, G., Matthews, K., Egami, E., & Weinberger, A. J. 2002, AJ, 124, 2980
- Soifer et al. (2001) Soifer, B. T., Neugebauer, G., Matthews, K., et al. 2001, AJ, 122, 1213
- Summers et al. (2004) Summers, L. K., Stevens, I. R., Strickland, D. K., & Heckman, T. M. 2004, MNRAS, 351, 1
- Tan & McKee (2004) Tan, J. C. & McKee, C. F. 2004, in Cancun Workshop on Formation and Evolution of Young Massive Clusters, eds. H. J. G. L. M. Lamers, A. Nota and L. Smith, see astro-ph/0403498
- Thornley et al. (2000) Thornley, M. D., Schreiber, N. M. F., Lutz, D., et al. 2000, ApJ, 539, 641
- Thuan et al. (1999) Thuan, T. X., Sauvage, M., & Madden, S. 1999, ApJ, 516, 783
- Turner & Beck (2004) Turner, J. L. & Beck, S. C. 2004, ApJ Lett., 602, L85
- Turner et al. (2003) Turner, J. L., Beck, S. C., Crosthwaite, L. P., et al. 2003, Nature, 423, 621
- Turner et al. (2000) Turner, J. L., Beck, S. C., & Ho, P. T. P. 2000, ApJ Lett., 532, L109
- Turner et al. (1998) Turner, J. L., Ho, P. T. P., & Beck, S. C. 1998, AJ, 116, 1212
- Vacca et al. (2002) Vacca, W. D., Johnson, K. E., & Conti, P. S. 2002, AJ, 123, 772
- Vanzi & Sauvage (2004) Vanzi, L. & Sauvage, M. 2004, A&A, 415, 509
- Verma et al. (2003) Verma, A., Lutz, D., Sturm, E., et al. 2003, A&A, 403, 829
- Walsh & Roy (1989) Walsh, J. R. & Roy, J. 1989, MNRAS, 239, 297
- Weidner & Kroupa (2004) Weidner, C. & Kroupa, P. 2004, MNRAS, 348, 187
- Weingartner & Draine (2001) Weingartner, J. C. & Draine, B. T. 2001, ApJ, 548, 296
- Whitmore & Zhang (2002) Whitmore, B. C. & Zhang, Q. 2002, AJ, 124, 1418
- Wood & Churchwell (1989a) Wood, D. O. S. & Churchwell, E. 1989a, ApJ, 340, 265
- Wood & Churchwell (1989b) Wood, D. O. S. & Churchwell, E. 1989b, ApJS, 69, 831