Distance of the Hypernova SN 2002ap via the Expanding Photosphere Method 111 Based on observations obtained at the David Dunlap Observatory, University of Toronto
New optical photometric and spectroscopic data of the bright hypernova SN 2002ap are presented. The obtained light curves as well as the optical spectra agree well with other published data series. The distance has been inferred by applying the Expanding Photosphere Method for the data around maximum. The derived Mpc is in good agreement with recent photometric distances of M74. However, the total (random plus systematic) uncertainty of the EPM-distance is at least Mpc (about 70 %). The physical parameters of the SN have been determined via simplified analytic models of the light and velocity curves. It is confirmed that SN 2002ap was a less energetic hypernova, the kinetic energy was 4 - erg, and the reddening-free absolute bolometric magnitude reached mag (corresponding to ), about 2 magnitude less than the prototype hypernova SN 1998bw.
Key Words.:
supernovae: individual: SN 2002ap; Galaxies: individual: M741 Introduction
The idea that core-collapse supernovae (SNe) may produce observable gamma-ray bursts, has received many theoretical as well as observational attention since the discovery of SN 1998bw within the error box of GRB 980425 (Galama et al. (1998)). Recently, the optical afterglow of GRB 030329 that showed SN 1998bw-like spectrum (SN 2003dh, Garnavich et al. (2003); Chornock et al. (2003); Stanek et al. (2003); Lipkin et al., (2004)) provided a very convincing evidence of the supernova - GRB connection. With GRB 031203 - SN 2003lw (Gal-Yam et al. (2004)) there are now three low-redshift () GRBs that are all associated with SNe. The spectra of these SNe were characterized by shallow, very broad lines and a very blue continuum at the early phases. Usually, their spectroscopic classification is Ic, although they do not really resemble other Type Ic SNe. The very broad lines in the early spectra are indicative of high expansion velocity, up to 40,000 kms-1. Such SNe are now referred as “hypernovae”, because of their high expansion velocity as well as large kinetic energy released by the explosion (Iwamoto et al. (1998)). Actually, some model computations (Höflich, Wheeler & Wang, (1999)) showed that such high expansion velocities can also be consequences of an asymmetric explosion seen at different viewing angles rather than extremely high intrinsic kinetic energy.
SN 2002ap, discovered by Y. Hirose on Jan. 29, 2002 (Nakano et al. (2002)), turned out to be a very interesting event in many respects. First, it occured in M74 (NGC 628), a nearby spiral galaxy ( Mpc), thus, it is one of the closest SNe observed ever. Second, it was discovered well before maximum, and the early phase spectra were very similar to those of SN 1998bw. Therefore, SN 2002ap was quickly classified as a hypernova (Meikle et al. (2002); Kinugasa et al. (2002); Gal-Yam & Shemmer, (2002)). Third, despite the expectations, SN 2002ap could not be associated with any detected GRBs (Totani, (2003)). Some authors (Leonard et al. 2002a ) suggested that SN 2002ap should be classified as “Peculiar Type Ic” SN instead of hypernova, because in this case the latter term can be reserved to those SNe that actually produce GRBs.
In spite of the lack of associated GRB, SN 2002ap has been extensively followed-up in many bands extending from radio (Berger et al., (2002)) to X-ray (Sutaria et al. (2002); Soria et al. (2003)). Optical spectroscopy and/or photometry were reported in many papers (Gal-Yam et al. (2002); Borisov et al. (2002); Cook et al. (2002); Pandey et al. (2002); Kinugasa et al. (2002); Yoshii et al. (2003); Foley et al. (2003)). Based on optical spectrophotometry, significant continuum polarization was detected (Kawabata et al. (2002); Leonard et al. 2002a ; Wang et al. (2002)), suggesting an asymmetric explosion.
From these observations, a more-or-less consistent physical picture was revealed, containing a relatively low-mass progenitor (), exploding with ergs kinetic energy, synthesizing 0.07 - 0.1 of 56Ni (Mazzali et al. (2002); Maeda et al. (2003); Foley et al. (2003)). The original mass of the progenitor was estimated as . However, the lack of the detection of the progenitor on previous optical and near-IR frames of M74 (Smartt et al. (2002)) may imply a lower mass and/or lower luminosity.
All of these physical parameters are based on the assumed distance to the host galaxy of SN 2002ap. There are two modern distance estimates of M74 in the literature. Sharina et al. (1996) derived mag as a reddening-free distance modulus, based on the luminosity of the brightest blue supergiants. The Sharina et al. result confirms the distance determined by Sohn & Davidge, (1996) (), although Sohn & Davidge claimed that blue supergiants are unreliable distance indicators and they preferred the use of the brightest red supergiants for this purpose. However, both groups assumed the total absorption in as mag based on the map of Burstein & Heiles, (1982). The more recent reddening map of Schlegel et al. (1998) predicts mag in the direction of M74, which reduces the above distance moduli to mag, corresponding to Mpc.
Surprisingly, the various attempts to determine the distance of M74 have led to very inconsistent results. For example, Sandage & Tammann, (1974) derived mag from the sizes of HII-regions, while Bottinelli et al. (1984) inferred from Tully-Fisher relation. Thus, there is an order of magnitude disagreement between the distances determined by different methods.
In all papers cited above, the distance of SN 2002ap was assumed to be 7.3 Mpc, corresponding to the original distance modulus of Sharina et al. (1996). This value itself may introduce a 0.2 mag systematic uncertainty in the derived absolute magnitudes of the SN (which then incorporates into the other inferred physical parameters), because this distance is based on the earlier reddening map. Moreover, the large scatter in the early M74 distances may further complicate the situation. A new, independent distance measurement of M74 based on SN 2002ap itself seems to be useful to clarify the picture.
In this paper we present a new distance estimate of SN 2002ap and M74 via the Expanding Photosphere Method (EPM). For this purpose we obtained new optical spectrocopic and photometric measurements of SN 2002ap, from days up to days. These are described in Section 2. The distance estimate is discussed in Section 3. Section 4 contains the analysis of the bolometric light and radial velocity curves, based on a simple analytic model. Section 5 summarizes our results.
2 Observations and data reduction
2.1 Photometry
The photometric observations were started on Jan 31, 2002, just after the discovery of SN 2002ap. Most of the data were obtained with the 60/90 cm Schmidt-telescope of Konkoly Observatory (installed at Piszkesteto Mountain, Hungary) equipped with a 1536x1024 Photometrics camera. Some CCD frames were also collected using the 1 m RCC telescope at Konkoly and the 40 cm Cassegrain at Szeged Observatory (see Vinkó et al. (2003) for the technical details of these instruments).
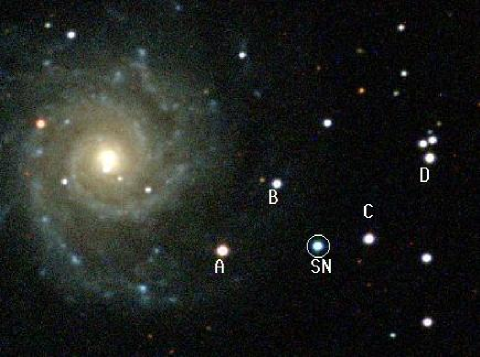
The CCD frames were reduced using the standard way in IRAF111IRAF is distributed by NOAO which is operated by the Association of Universities for Research in Astronomy (AURA) Inc. under cooperative agreement with the National Science Foundation. Comparison stars were selected in the vicinity of the SN (Fig.1), and differential magnitudes were determined via aperture photometry. Because the SN occured outside the visible region of its host, the background was not affected significantly by the light of the host galaxy. Thus, aperture photometry could be easily applied.
The instrumental magnitudes were transformed into the standard system using the equations given by Vinkó et al. (2001). The comparison stars were calibrated via standard stars in the field of M67. Then, the standard magnitudes were compared with those given by Henden (Gal-Yam et al. (2002)) and Foley et al. (2003). The three datasets showed acceptable agreement within 0.03 mag (Fig.2), except for the brightest star (A), where the differences were slightly higher. The final adopted magnitudes of our comparison stars are determined as the average of the three standard sequences. These are collected in Table 1. The uncertainties are estimated from the standard deviation of the averaged data.
| Star | ||||
|---|---|---|---|---|
| A | 12.91(0.05) | 1.24(0.06) | 0.78(0.02) | 1.46(0.04) |
| B | 13.80(0.02) | 0.72(0.01) | 0.42(0.02) | 0.81(0.03) |
| C | 13.08(0.03) | 0.76(0.02) | 0.45(0.01) | 0.89(0.03) |
| D | 13.24(0.02) | 0.77(0.02) | 0.44(0.01) | 0.87(0.02) |


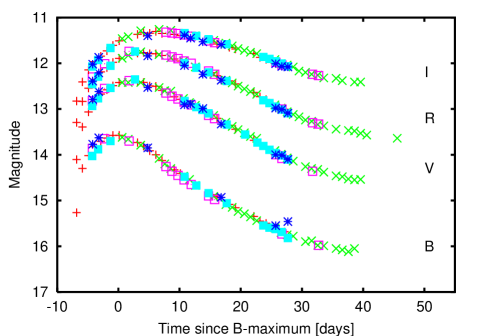
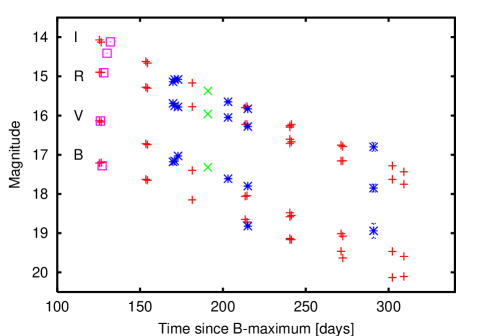
The magnitudes listed in Table 1 were used to calculate the calibrated standard magnitudes of SN 2002ap. The final results (after averaging the magnitudes obtained from star A, B, C and D) are listed in Table 2. Fig.3 shows the light curve in bands. In order to compare our photometry with other published data, we also plot photometric data of SN 2002ap collected from literature. The agreement is satisfactory (note that the tabulated light curve data in Foley et al. (2003) already contain the reddening correction - this was removed before plotting in Fig.3). As usual, the phase is referenced to the moment of -maximum, which was determined as JD 2452311.5 (note that it is 2 days less than the one given by Gal-Yam et al. (2002)).
| JD | Tel. | ||||
|---|---|---|---|---|---|
| 52307.30 | 13.27(0.013) | 12.79(0.008) | 12.89(0.009) | 13.02(0.008) | A |
| 52308.30 | 13.13(0.015) | 12.62(0.006) | 12.71(0.008) | 12.87(0.007) | A |
| 52316.30 | 13.35(0.080) | 12.53(0.043) | 12.34(0.031) | 12.40(0.032) | C |
| 52322.30 | … | 12.91(0.041) | 12.55(0.022) | 12.39(0.024) | C |
| 52323.30 | … | 12.89(0.067) | … | 12.45(0.035) | C |
| 52325.30 | … | 12.99(0.029) | 12.74(0.049) | 12.53(0.042) | C |
| 52328.30 | 14.43(0.051) | 13.33(0.046) | 12.87(0.052) | 12.59(0.028) | C |
| 52337.20 | 15.05(0.010) | 13.99(0.007) | 13.48(0.008) | 13.01(0.009) | A |
| 52338.20 | … | 14.01(0.014) | 13.51(0.008) | 13.07(0.015) | A |
| 52339.20 | 14.96(0.029) | 14.10(0.016) | 13.59(0.021) | 13.08(0.019) | A |
| 52481.40 | … | 17.18(0.007) | 16.19(0.008) | 16.14(0.006) | A |
| 52482.40 | … | 17.16(0.006) | 16.25(0.005) | 16.08(0.013) | A |
| 52484.40 | … | 17.03(0.015) | 16.28(0.033) | 16.08(0.050) | A |
| 52526.50 | 18.32(0.022) | 17.80(0.015) | 16.78(0.008) | 16.83(0.012) | A |
| 52514.60 | … | 17.61(0.027) | 16.55(0.030) | 16.65(0.018) | B |
| 52602.40 | … | 18.94(0.190) | 18.35(0.110) | 17.80(0.125) | A |
2.2 Constructing the bolometric light curve
The bolometric light curve was constructed after combining all available optical and near-IR measurements collected from the literature. After dereddening with mag (see next section), the magnitudes were converted into monochromatic fluxes using the calibration of Bessell, (2001). The near-IR contribution was estimated from the data of Yoshii et al. (2003), while contribution from other bands were neglected. Then, the bolometric fluxes were calculated by integrating the monochromatic fluxes with a simple trapezoidal rule. This resulted in the “observed” bolometric flux as a function of time. Finally, the absolute bolometric magnitudes have been determined applying the true distance modulus mag derived in this paper (see Sect.4).
The absolute bolometric magnitudes have been compared with those derived by Yoshii et al. (2003). Because Yoshii et al. applied mag as distance modulus, their data were corrected to match the slightly lower distance modulus used above. After correcting for this difference, the two bolometric light curves showed very good agreement. Thus, it is concluded that the various determinations of the bolometric light curve of SN 2002ap have led to consistent results, and the source of the main uncertainty of the bolometric light curve is the true distance modulus of the SN.
The bolometric light curve of SNe can be described analytically by the simple model of Contardo et al. (2000). In this model the light curve has the form
| (1) |
Note that we applied only one gaussian component, because the bolometric light curve of SN 2002ap does not show significant bump on the descending branch. The light curve parameters were determined via least-squares fitting as , , , , , , . Among these, the most interesting parameter is the late-time decline rate that is physically linked to the Co-Fe decay and the radiation transport in the expanding SN ejecta. The value derived above, mag/day is in good agreement with the one published by Pandey et al. (2002) ().
In Fig.4 we plot the “observed” bolometric light curve () together with the analytic model given above and the expected decline rates due to the Ni-Co-Fe radioactive decay. As seen in Fig.4, the decline of SN 2002ap is significantly faster than the Co-Fe radioactive decline rate ( mag/day), as also noted by Pandey et al. (2002) and Yoshii et al. (2003). They explained this as a leakage of photons from the atmosphere, indicating a transparent, less massive ejecta. Our new late-time photometry fully supports these conclusions. The connection between the physical state of the expanding atmosphere and the bolometric light curve is analyzed further in Section 4.

2.3 Optical spectroscopy
The spectroscopic observations were carried out at David Dunlap Observatory (DDO) between the 2nd and 25th February, 2002 ( = to days), with the Cassegrain spectrograph attached to the 74” telescope. Two different setups have been applied: the 100 lines/mm grating was used for the low dispersion observations, while the 1800 lines/mm grating was selected for obtaining high resolution spectra. The reciprocal dispersion was 3.60 Å/pixel and 0.2 Å/pixel, respectively. The low-resolution spectra extended from 4000 to 7500 Å, while the high-resolution spectrum was centered on Na D and covered a 200 Å-wide spectral interval. The slit width was 306 microns (corresponding to 1.8 arcsec on the sky) for both observing modes. The seeing was between 2 - 3 arcsec during the observations.
The reduction was done in the standard way using IRAF. Flux calibration was performed via the spectra of comparison stars HD 26793 (spectral type B9V) and HD 74280 (B3V), obtained before or after the SN observation on the same night with the same setup. The slit of the DDO spectrograph has fixed E-W direction, so the observations could not be taken at the parallactic angle. During the observations the airmass of the SN was always less than 2, but differential light loss may have reduced the observed fluxes in the blue part of the spectra (especially below 4500 Å). However, this effect is probably not strong, because the shapes of our spectra are similar to those collected from literature (see below).
After the calibrations, the spectra were de-reddened using = 0.09 mag (discussed below) and corrected for the redshift of the host galaxy ( = 0.0021, Foley et al. (2003)). Table 3 contains the journal of spectroscopic observations.
| Date | JD-2452000 | Phase | airmass | PA | ||
|---|---|---|---|---|---|---|
| 2002.02.02 | 308.49 | 5800 | 800 | 1.22 | 31 | |
| 2002.02.03 | 309.50 | 5800 | 800 | 1.25 | 34 | |
| 2002.02.06 | 312.54 | 5890 | 14700 | 1.46 | 44 | |
| 2002.02.09 | 315.54 | 5800 | 800 | 1.60 | 46 | |
| 2002.02.15 | 320.53 | 5800 | 800 | 1.54 | 46 | |
| 2002.02.18 | 323.50 | 5800 | 800 | 1.45 | 44 | |
| 2002.02.24 | 330.49 | 5800 | 800 | 1.60 | 45 | |
| 2002.02.25 | 331.52 | 5800 | 800 | 1.82 | 47 |

The final, redshift-corrected and dereddened spectra are plotted in Fig.5, together with the spectra taken by Gal-Yam et al. (2002) at Wise Observatory. The characteristic features of hypernovae are apparent: very blue, almost featureless spectrum at early phases, very broad, strong troughs around maximum light, and flat continuum with shallow, broad absorption lines at the end of the photospheric phase. These spectra are very similar to those presented by Kinugasa et al. (2002) and Foley et al. (2003). Kinugasa et al. showed that the deep absorption troughs developing around maximum are due to Ca ii, Fe ii, Si ii, Ni ii, Co ii, O i and Na i.
Radial velocities were determined from the usual Si ii 6355 line. Table 4 lists the derived velocities, together with other available data collected from the literature. The uncertainties were estimated from the width of the Si ii absorption trough. These errors are rather large due to the strong broadening at the very early phases and the decreasing line strength at late phases. Fig.6 contains the comparison of Si ii velocities of hypernovae SN 1998bw (Patat et al. (2001)) and SN 1997ef (Mazzali, Iwamoto & Nomoto, (2000)). This figure agrees very well with a similar plot presented by Kinugasa et al. (2002), and supports their conclusion that SN 2002ap evolved faster than the other two well-observed hypernovae (see also Foley et al. (2003)). The radial velocities will be used in Sect.3 and 4.

| JD | (Si II) | ref. | ||
|---|---|---|---|---|
| (2452000+) | (days) | (kms-1) | (kms-1) | |
| 305.9 | 2.5 | 33000 | K | |
| 306.3 | 2.9 | 33465 | W | |
| 306.9 | 3.5 | 31000 | K | |
| 308.5 | 5.1 | 21097 | pp | |
| 309.5 | 6.1 | 19162 | pp | |
| 311.9 | 8.5 | 16000 | K | |
| 312.9 | 9.5 | 15000 | K | |
| 313.3 | 9.9 | 15055 | W | |
| 314.9 | 11.5 | 12000 | K | |
| 315.5 | 12.1 | 12317 | pp | |
| 315.9 | 12.5 | 11000 | K | |
| 317.9 | 14.5 | 9000 | K | |
| 318.9 | 15.5 | 8000 | K | |
| 319.9 | 16.5 | 7000 | K | |
| 320.3 | 16.9 | 7974 | W | |
| 320.5 | 17.1 | 6794 | pp | |
| 321.9 | 18.5 | 5200 | K | |
| 323.5 | 20.1 | 5897 | pp | |
| 325.9 | 22.5 | 3400 | K | |
| 326.9 | 23.5 | 3000 | K | |
| 327.3 | 23.9 | 3867 | W | |
| 327.9 | 24.5 | 3000 | K | |
| 330.5 | 27.1 | 3112 | pp | |
| 330.9 | 27.5 | 2000 | K | |
| 331.5 | 28.1 | 3301 | pp |
A single high-resolution spectrum was obtained on 6th Feb. 2002 centered around Na D (Fig.7). The presence of the narrow dublet at zero velocity is clearly indicative of interstellar absorption originating from Milky Way ISM. The equivalent width of the two components was measured to be and Å. According to Barbon et al., (1990), the total EW of the dublet corresponds to mag. The more recent relation of Munari & Zwitter, (1997) (that uses only the EW of the Å component) results in mag. The uncertainties given here are formal errors of the EW measurement errors. A more realistic error bar that reflects the uncertainties of the applied empirical relations is in the order of mag. Despite of the lower S/N of our high-resolution spectrum, these estimates agree quite well with the value derived by Foley et al. (2003) (). This confirms the conclusion of many previous papers that the reddening of SN 2002ap is low, but not negligible.
For such low reddening, the all-sky map of Schlegel et al. (1998) usually works better. This gives mag as the galactic component (that is also probed by the observed zero velocity NaD dublet). This is somewhat lower than the values listed above, but it is within the global uncertainty of the above estimates. The contribution of the host galaxy ISM was measured by Takada-Hidai et al. (2002), and found to be as low as 0.02 mag. The sum of these two components gives mag, which was used in almost all previous papers on SN 2002ap. Therefore, we have adopted mag (estimated uncertainty) throughout the rest of this work. Our spectroscopic result, although with higher uncertainty, supports this low reddening value.

3 Distance estimate
Distance is one of the most important parameter for SNe, because the physical parameters, such as luminosity and kinetic energy, can be inferred reasonably only if the distance is known. Core-collapse events, such as hypernovae, usually exhibit large variation in their peak luminosity and ejected mass (Hamuy, (2003)), thus, distance determination is necessary to infer these parameters from the observed ones.
The distance of a hypernova is not an easy parameter to determine. Because these events are far from being “standard candles”, a pure photometric distance measurement is not possible at present. A possible solution for this problem may be the determination of the distance of the host galaxy itself, via another, independent method. This might work at least for the nearby galaxies, such as M74. Surprisingly, such pre-determined distances for M74 are quite uncertain (see Section 1). Thus, in order to obtain reliable parameters, a distance measurement of SN 2002ap itself would be very useful.
3.1 The Expanding Photosphere Method
We have applied the Expanding Photosphere Method (EPM) for measuring the distance to SN 2002ap. This method was developed by Kirshner & Kwan, (1974), and was used many times for measuring distances of Type II SNe (e.g. Schmidt et al. (1994); Hamuy et al. (2001)). The main assumptions of this method are as follows:
-
•
the expansion is spherically symmetric and homologous
-
•
there is a well-defined photosphere in the ejecta, below which the gas is optically thick
-
•
the photosphere radiates as a (diluted) blackbody (parametrized by the dilution factor ).
Because Type II SNe eject a massive H-rich envelope, they have optically thick atmospheres, in which the location of the photosphere is determined by the position of the H recombination front. This phase lasts for months, therefore the EPM can be applied for data obtained over a long time interval.
It is very probable that none of the above assumptions are fully applicable for SN 2002ap, which was very different from a Type II SN. According to the spectroscopic observations (including those presented in this paper), the photosphere disappeared quickly, and after a few weeks the SN entered the nebular phase. Therefore, the EPM can be applied only for a few data points just before and after maximum light. Moreover, the atmosphere of hypernovae could be very different from that of a Type II SN, and the emergent radiation may be far from being Planckian. In their very thorough study of Type II SN atmospheres, Eastman et al. (1996) showed that the dilution factor for a particular atmosphere is usually between 0.4 - 1.5 depending on the effective temperature, density profile and the choice of the wavelength regime for determining the colour temperature. Because directly influences the EPM-based distances, neglecting the deviation from Planckian flux can lead to a 40% systematic error in the derived distance. For hypernovae, such kind of problems can be studied only via detailed model atmospheres, which is beyond the scope of this paper. Nevertheless, we assumed that the EPM can be applied to SN 2002ap, as a first approximation, until the more sophisticated model atmosphere computations are available.
Perhaps the weakest point of the feasibility of the EPM is the assumption of spherical symmetric expansion. According to the polarization results (Section 1), there are indications that the expansion of SN 2002ap was definitely asymmetric at early phases. The measured net polarization (about 2 %) may suggest an asymmetry of about 10 % (Kawabata et al. (2002)), although the polarization angle varied in time, which means that the asymmetry, if indeed present, may be of complex nature. Another possibility may be the presence of higher interstellar polarization than Kawabata et al. estimated. In this case the measured polarization is not due to the elongated shape of the ejecta. Indeed, recently Leonard et al. 2002b has discovered evidence for extremely high polarization efficiency in NGC 3184, where a high degree of polarization was measured for SN 1999gi that otherwise was only slightly reddened. It is also worth noting that model computations for SN 2002ap could reproduce the early part of the light curve using sperical as well as non-spherical models (see e.g. Maeda et al. (2003) for details). In the followings we assume, for simplicity, that the expansion of SN 2002ap was spherically symmetric during the photospheric epoch, but note that deviations from sphericity may result in systematic errors in the distance determination. Discussion of other possible sources of random and systematic uncertainty is presented at the end of this Section.
The formulae of the EPM are straightforward. According to the homologous expansion, the radius of the photosphere can be expressed as:
| (2) |
where is the moment of explosion. is a crucial parameter for the distance determination. The angular size of the photosphere, , where is the distance, can be expressed as (Kirshner & Kwan, (1974))
| (3) |
where is the observed flux density, is the Planck function and is the dilution factor.
In this paper we used the bolometric light curve of SN 2002ap (Section 2) for estimating the surface brightness - temperature relation. The dilution factor is assumed to be (as a first approximation) and Eq.3 can be written as
| (4) |
where is the observed bolometric flux density (in erg/s/cm2) and is the Stefan-Boltzmann constant. is given from the bolometric light curve discussed in Sect.2. The effective temperature was estimated from hypernova model atmospheres.
We used the hypernova model atmospheres by Mazzali, Iwamoto & Nomoto, (2000) constructed for SN 1997ef. For several epochs, they tabulated the effective temperature and the calculated color of the photosphere. We fitted a simple linear function to these data and found
| (5) |
Combining Eq.4 and 5, the angular size of the photosphere can be derived from the observations.
The photospheric velocities were assumed to be equal to the radial velocities based on the usual Si ii line (Sect.2). The hypernova models of Mazzali, Iwamoto & Nomoto, (2000) give some support to our assumption, as their computed Si ii velocities are similar to the photospheric ones.


Having the angular size and the velocity determined from the observations at several epochs, the distance can be derived via Eq.2 and 4. Following Schmidt et al. (1994), their combination yields
| (6) |
where is in Mpc, is in kms-1, is in days and is the conversion factor between the quantities. Plotting versus , and can be determined by linear regression.

The results for SN 2002ap are plotted in Figs.8, 9 and 10. Fig.8 contains the plot of the temperature variation (from dereddened data, via Eq.5). Fig.9 shows the angular size calculated from Eq.4. It is apparent that the expansion of the photosphere stopped at about JD 2452317, so the expansion phase did not last long. Note, that, as the referee pointed out, this does not mean that the photospheric phase has ended, because the spectra clearly indicate that the SN is still in the photospheric phase (see Fig.5). The EPM was applied only for data obtained before this epoch. The fitting of Eq.6 to the combined data is presented in Fig.10. The linear regression resulted in = 6.7 Mpc and = 2452304.3 as the distance and the moment of explosion, respectively. It is clear from Fig.10 that the relation becomes non-linear when the expansion phase ends, thus, at least one of the assumptions of the EPM became invalid at that time. The quoted uncertainties are formal (random) errors due to the fitting procedure.
These results show remarkably good agreement with previous ones, determined via other methods. The EPM-distance is almost perfectly equal to the photometric distance of M74 when the Schlegel et al. (1998) reddening correction is applied ( Mpc, see Sect.1). The moment of explosion agrees within the uncertainties with the one derived by Mazzali et al. (2002) (, Jan. 28, 2002) from model computations. It also worths noting that the derived explosion date is only 1 day prior to the discovery of SN 2002ap (see Sect.1).
3.2 Uncertainties of the EPM-distance
As mentioned above, difference between the assumptions of the EPM and the true physical state of the SN atmosphere may lead to significant uncertainty in the inferred distance. Despite the good agreement between the new EPM-distance and other distance estimates, all these may suffer from quite large systematic errors. Recently, Leonard et al. (2003) presented a thorough test of the EPM- and Cepheid-based distances of SN 1999em and NGC 1637. They concluded that the Cepheid-based distance is 50 % greater than the EPM-based distance, which means that there is serious disagreement between these two measurement methods. They also showed that, at present, the Cepheid-based distance is more favourable than the EPM-based one, thus, the EPM-distances are plagued by at least 50% systematic error. This leads to a 60 - 70 % total (systematic plus random) uncertainty for the EPM.
What are the possible sources of such high uncertainty? Leonard et al. (2003) mention the dilution factor and the radial velocity measurement technique as the most probable ones. The need for a precise dilution factor based on model atmosphere tuned for the particular SN has been emphasized by Eastman et al. (1996). However, their dilution factors may also suffer from uncertainies, because independent calculations by other groups have lead to significantly different factors (see Leonard et al. (2003) for extensive discussion and references). These problems are probably more enhanced for the present study, due to the atmospheric properties of hypernovae. Since there was no detailed model atmosphere for SN 2002ap at our disposal, we had to assume , which may lead up to 50 % systematic error in the distance (as it was mentioned in Section 3.1). This error can be even larger if the atmosphere of SN 2002ap were very different from a Type II SN atmosphere so that the dilution factor was quite different from those of Eastman et al. (1996). On the other hand, the application of a hypernova model of Mazzali, Iwamoto & Nomoto, (2000) (constructed for SN 1997ef) may somewhat reduce this large uncertainty. As it is explained above, we assigned the model effective temperature (via Eq.5, by comparing the observed and predicted color indices) to the bolometric flux data. This technique may have the advantage of using the “bolometric” fluxes that are integrated over a long wavelength regime, thus, it is not sensitive to the chosen wavelength and wavelength-dependent dilution factors. On the other hand, the uncertainties of the derived bolometric fluxes are probably in the same order of magnitude as that of the dilution factor.
The systematic errors caused by the measurement method of radial velocities are also quite large for SN 2002ap because of the very broad lines and strong blends in the spectra, especially at the early phases. Therefore, referring to Leonard et al. (2003), we estimate the systematic uncertainty of the EPM-based distance as 60 % that means Mpc for SN 2002ap. The total (random plus systematic) error of the distance becomes Mpc, or about 70 %.
The consistency between the EPM-distance and the other photometric distances of M74 may support the applicability of the EPM for hypernovae. However, it is important to note that Leonard et al. (2003) found similar agreement between the EPM-distance and the “brightest red supergiants” (BRSG) distance (Sohn & Davidge, (1998)) for NGC 1637. Among the distance measurement methods discussed by Leonard et al. (2003), the BRSG technique is the only one that gives consistent result with the EPM. Therefore, this agreement does not, unfortunately, reduce the large systematic uncertainty of the EPM-distance for M74.
We conclude that our first attempt to apply the EPM-technique to a hypernova resulted in distance estimate for SN 2002ap that has remarkably good internal precision (good linearity, low scattering in Fig.10.) On the other hand, the systematic uncertainty of the EPM-distance is quite high due to the problematic issue of the dilution factors as well as the complexity of hypernova spectra at the early phases. Note that the EPM-distance is 0.6 Mpc lower than the one used in previous papers (7.3 Mpc), thus, the inferred physical parameters of SN 2002ap may need some revision, if we adopt this new distance. For example, the nickel mass may be somewhat lower than derived previously (e.g. Mazzali et al. (2002); Pandey et al. (2002); Foley et al. (2003)).
4 Model computations and physical parameters
| Model | |||||||||
|---|---|---|---|---|---|---|---|---|---|
| A | 1.0 | 0.07 | 1.0* | 0.0* | 35000 | 0.1 | 5.0 | 0.009 | 7.35 |
| B | 1.0 | 0.04 | 0.01* | 2.1 | 35000 | 0.005 | 0.1 | 0.03 | 3.84 |
| C1 | 1.0 | 0.07 | 0.15* | 2.1 | 40000 | 0.027* | 1.4 | 0.025 | 5.67 |
| C2 | 2.0* | 0.045 | 0.15* | 2.1 | 35000 | 0.027* | 1.0 | 0.012 | 8.69 |
Some basic physical parameters of the SN explosions can be estimated by comparing the observations with model computations of the light curves and/or spectra. This usually requires sophisticated calculations including hydrodynamics, radiative transfer and atomic physics, which are beyond the scope of this paper. Instead, in the followings we use a simple analytic (“toy”-) model to estimate the fundamental parameters of SN 2002ap, such as Ni-mass and kinetic energy of the ejecta.
The bolometric light variation of SNe can be qualitatively described by simple analytic models (Arnett, (1980); Arnett, (1982); Iwamoto et al. (2002); Maeda et al. (2003)), assuming homologous expansion of the ejected envelope and (probably over-)simplified deposition of gamma-rays. It is known that SNe are powered by radioactive decay of 56Ni 56Co 56Fe. The basic parameter characterising the emitted energy is , the mass of 56Ni synthesized during the explosion. The gamma-rays originating from radioactive decay are deposited and thermalized in the ejecta via Compton-scattering. Because the ejecta is optically thick at early phases, the timescale of the radiative transfer of photons to the surface is comparable to the timescale of the expansion (characterized by , the velocity of the outmost part of the ejecta), thus, the energy remains trapped in the optically thick atmosphere. As the ejecta expands, the density and the opacity decreases, and the deposited energy can escape more and more quickly. Thus, the light curve has a peak at 15-20 days past explosion, when the emitted luminosity becomes roughly equal to the instantaneous rate of the energy deposition (Arnett, (1982)). Because the transparency of the ejecta quickly decreases with time, the light variation after maximum mimics the radioctive decay law and the physics of gamma-ray deposition.
The very simple light curve model used in this paper is based on the assumption of free, homologous expansion of the ejecta. The ejecta has a radius that increases with time as
| (7) |
where is the (negligible) initial radius of the progenitor and is the (constant) expansion velocity. The velocity of a thin shell at fractional radius has a velocity
| (8) |
The density structure of the ejecta is assumed to be consisting of an inner core with constant density, and an outer shell where the density is decreasing as power-law:
| (9) |
where is the fractional radius of the core, is the density in the core (i.e. for ) and is the power-law exponent. As a consequence of the expansion, decreases in time as
| (10) |
where is a geometric factor due to the assumed density structure, and is the total mass of the ejecta. With these assumptions the kinetic energy can be expressed as
| (11) |
The energy production released as gamma-rays is described by the exponental decay law:
| (12) | |||||
| (13) | |||||
| (14) |
where erg/g, erg/g, s-1, s-1, and is the total mass of the synthesized 56Ni. A fraction of the decay energy goes to generating positrons, which are decelerated and annihilated by the ejecta (see e.g. Capellaro et al. (1997)). The energy input due to positrons is approximated as
| (15) |
Thus, the total energy generation rate becomes the sum of the gamma ray and positron energy productions.
The gamma-rays as well as positrons must interact with the ejecta through multiple scattering in order to deposit their energy, which is assumed to be fully thermalized and re-radiated as optical photons. The total amount of deposited energy at each time is approximated as
| (16) |
where
| (17) |
is the total optical depth for gamma-rays and positrons (Capellaro et al. (1997)). The opacity is assumed to be constant for both gamma-rays and positrons. This is a major simplification, but often used in SNe models (e.g. Capellaro et al. (1997); Pinto & Eastman, (2000)).
If the diffusion time is short, the emitted energy per second is approximately equal to the rate of the deposited energy, i.e. . We have adopted this approximation for calculating the bolometric luminosity (similarly to Maeda et al. (2003)), instead of solving the time-dependent transport problem for optical photons (see Capellaro et al. (1997)). This condition is certainly not valid for pre-maximum epochs, thus, our simple light curve model is applicable only on the declining part of the light curve.
The light curve model outlined above contains the following free parameters: the total ejected mass , the nickel mass , the expansion velocity , the density exponent , and the opacities and . These parameters can be constrained by the observations. However, it is known that the light curve alone does not determine all parameters uniquely, i.e. the same light curve could be described by several parameter combinations (Iwamoto et al. (1998); Iwamoto et al. (2002)). Therefore, additional (usually spectroscopic) data are needed to constrain the physical parameters. Since our code is not capable of modeling the spectrum, we have used the Si ii velocities for this purpose.
In a grey atmosphere (such as our simple model with constant opacity) the location of the photosphere is usually defined as
| (18) |
Using Eq.2, the photospheric velocity can be expressed as
| (19) |
We have fitted Eq.16 and 19 to the bolometric light curve and the radial velocity curve presented in Sect.2. Three kinds of models were defined depending on the density configuration (characterized by the density parameters and ): a constant-density model with fixed (Model A), a power-law model with fixed (Model B) and a “core-shell” model with fixed (Model C). In the latter two, the density exponent was treated as variable. In addition, the parameters , , , , and were varied to find the best agreement between the observed and computed data.
The fitted parameters are collected in Table 5. In general, low-mass models with gave adequate fit to the observed data. All models have shallow density dependence (). The kinetic energy of the explosion is between 4 - 9 and the nickel mass is 0.04 - 0.07 . For Model C, we have also forced an model fit (model C2 in Table 5). This model resulted in slightly worse, but still acceptable fit (with less Ni mass, expansion velocity and opacity values). Similar tendency was found in the case of Models A and B: the increase of the ejected mass required the decrease of the Ni mass, velocity and opacities. It indicates that the parameter degeneracy, mentioned above, is not completely solved by introducing the velocity data.
Fig.11 and 12 show the comparison of Model C1 (solid line) and C2 (dashed line) with the observations. Model A and B resulted in very similar light and velocity curves (note that the models are valid only for the late-time light curve).
Because only Model C could be fitted with the usual value of the gamma-opacity cm, we have adopted model C1 as the most probable. This model is somewhat similar to the two-component model described by Maeda et al. (2003), because the density structure and the optical depth is different for the core and the outer shell. Maeda et al. (2003) discussed that a dense core is responsible for the late-time decline of the light curve. Note that our simple constant density model (Model A) can also describe the late-time light curve, but this requires a radical increase of the gamma-ray and positron opacities, which is difficult to explain physically.
Indications for a shallow density profile of the ejecta was also given by spectral synthesis models. Using the parametrized spectral synthesis code SYNOW, Kinugasa et al. (2002) obtained for the optical depth above the photosphere. Assuming homologous expansion () and grey atmosphere ( constant), this corresponds to . The hydrodynamical calculations (Mazzali et al. (2002)) also resulted in a flat density distribution above the photosphere. The result of our simple model () is consistent with these more sophisticated calculations.
| Ref. | |||
|---|---|---|---|
| 2.5 - 5 | 0.07 | 4 - 10 | Mazzali et al. (2002) |
| 2.7 | 0.08 | 5.5 | Maeda et al. (2003) |
| - | 0.06 | - | Pandey et al. (2002) |
| 1.5 | 0.09 | - | Foley et al. (2003) |
| 1.0 | 0.07 | 5.7 | Present paper |


Table 6 summarizes the basic parameters of SN 2002ap collected from the literature. It is seen that our Model C1 has lower ejected mass than the previous models, but the Ni-mass and the kinetic energy is similar. This is a bit surprising, because we used a somewhat shorter distance modulus than the authors in the previous papers, thus, our bolometric light curve is slightly fainter. Because the peak luminosity is directly connected with the Ni-mass, one should expect a lower Ni-mass for a fainter peak luminosity. However, our light curve code is probably too simplistic for such fine-tuning of the physical parameters of SN 2002ap, thus, the parameters listed in Table 6 can be considered only as order-of-magnitude estimates. As Maeda et al. (2003) pointed out, a two-component (or core-shell) ejecta model may, in fact, be an indication of an asymmetric explosion. If this is indeed the case, the parameters derived from such spherical models may deviate significantly from the real values.
We conclude that the simple model of the light- and velocity curves of SN 2002ap confirms that the progenitor was a low-mass object (probably a stripped stellar core), and the synthesized nickel mass was quite low, about 0.07 , or even less, depending on the density structure of the ejected envelope.
5 Summary
The results of this paper can be summarized as follows.
-
1.
We have presented new photometry of SN 2002ap up to days past maximum, and photospheric phase optical spectroscopy.
-
2.
The Expanding Photosphere Method was used to infer the distance of SN 2002ap. This resulted in Mpc (corresponding to mag) with Mpc random and Mpc (estimated) systematic uncertainty. This agrees with previous photometric distances of M74, if the reddening map of Schlegel et al. (1998) is used to estimate the galactic reddening. However, it is slightly less than the value (7.3 Mpc) used in previous papers of SN 2002ap.
-
3.
The physical parameters of the SN ejecta were estimated with a simple parametrized analytic model, assuming homologous expansion and power-law density structure. From simultaneous fitting to the bolometric light curve and the radial velocity curve, we found that the SN ejected a low mass envelope () and synthesized about 0.04 - 0.07 of 56Ni.
Acknowledgements.
This work was supported by Hungarian OTKA Grant No. T034615, and the Bolyai János Research Scholarship to J.V. R.M.B. acknowledges financial support from the Natural Science and Engineering Research Council through a research grant to C. T. Bolton. The authors wish to express their thanks to the staff of Konkoly Observatory (director Prof. L. G. Balázs) and David Dunlap Observatory (director Prof. S. M. Rucinski) for generously granting telescope time. Thanks are also due to Zs. Bebesi, Sz. Mészáros, P. Székely, A. Gáspár, M. Váradi (University of Szeged) and B. Sipőcz (ELTE University, Budapest) for assisting during the photometric observations. The authors are grateful to an anonymous referee who provided many useful suggestions and comments that helped to improve this paper. The NASA Astrophysics Data System, the SIMBAD and NED databases and the Canadian Astronomy Data Centre were used to access data and references. The availability of these services is also gratefully acknowledged.References
- Arnett, (1980) Arnett, W.D. 1980, ApJ 237, 541
- Arnett, (1982) Arnett, W.D. 1982, ApJ 253, 785
- Barbon et al., (1990) Barbon, R., Benetti, S., Rosino, L. et al. 1990, A&A 237, 79
- Berger et al., (2002) Berger, E., Kulkarni, S.R., Chevalier, R.A. 2002, ApJ 577, L5
- Bessell, (2001) Bessell, M.S. 2001, PASP 113, 66
- Borisov et al. (2002) Borisov, G., Dimitrov, D., Semkov, E. et al. 2002, IBVS No. 5264.
- Bottinelli et al. (1984) Bottinelli, L., Gouguenheim, L., Paturel, G., de Vaucoulers, G. 1984, A&AS 56, 381
- Burstein & Heiles, (1982) Burstein, D., Heiles, C. 1982, AJ 87, 1165
- Capellaro et al. (1997) Capellaro, E., Mazzali, P.A., Benetti, S. et al. 1997, A&A 328, 203
- Chornock et al. (2003) Chornock, R., Foley, R.J., Filippenko, A.V., Papenkova, M., Weisz, D. 2003, IAU Circ. 8114
- Contardo et al. (2000) Contardo, G., Leibundgut, B., Vacca, W.D. 2000, A&A 359, 876
- Cook et al. (2002) Cook, L.M., Katkova, E.V., Sokolov, N.A., Guseva, I.S. 2002, IBVS No. 5283
- Eastman et al. (1996) Eastman, R.G., Schmidt, B.P., Kirshner, R. 1996, ApJ 466, 911
- Foley et al. (2003) Foley, R., Papenkova, M., Swift, B. et al. 2003, PASP 115, 1220
- Galama et al. (1998) Galama T.J. et al. 1998, Nature 395, 670
- Gal-Yam & Shemmer, (2002) Gal-Yam, A., Shemmer, O. 2002, IAU Circ. 7811
- Gal-Yam et al. (2002) Gal-Yam, A., Ofek, E.O., Shemmer, O. 2002, MNRAS 332, L73
- Gal-Yam et al. (2004) Gal-Yam, A., Moon, D.-S., Fox, D.B. et al. 2004, ApJ 609, 59
- Garnavich et al. (2003) Garnavich, P., Matheson, T., Olszewski, E.W., Harding, P., Stanek, K.Z. 2003, IAU Circ. 8114
- Hamuy et al. (2001) Hamuy, M., Pinto, P.A., Maza, J. et al. 2001, ApJ 558, 615
- Hamuy, (2003) Hamuy, M. 2003, ApJ 582, 905
- Höflich, Wheeler & Wang, (1999) Höflich, P., Wheeler, J.C., Wang, L. 1999, ApJ 521, 179
- Iwamoto et al. (1998) Iwamoto, K. et al. 1998, Nature 395, 672
- Iwamoto et al. (2002) Iwamoto, K., Nomoto, K., Mazzali, P.A., Nakamura, T., Maeda, K. 2003, in: Supernovae and Gamma-Ray Bursts (ed. K.Weiler) Springer-Verlag p.243
- Kawabata et al. (2002) Kawabata, K.S., Jeffery, D.J., Iye, M. et al. 2002, ApJ 580, 39
- Kinugasa et al. (2002) Kinugasa, K., Kawakita, H., Ayani, K. et al. 2002, IAU Circ. 7811
- Kinugasa et al. (2002) Kinugasa, K., Kawakita, H., Ayani, K. et al. 2002, ApJ 577, L97
- Kirshner & Kwan, (1974) Kirshner, R.P., Kwan, J. 1974, ApJ 193, 27
- (29) Leonard, D.C., Filippenko, A.V., Chornock R., Foley, R. 2002, PASP 114, 1333
- (30) Leonard, D.C., Filippenko, A.V., Chornock R., Li, W. 2002, AJ 124, 2506
- Leonard et al. (2003) Leonard, D.C., Kanbur, S.M., Ngeow, C.C, Tanvir, N.R. 2003, ApJ 594, 247
- Lipkin et al., (2004) Lipkin, Y.M., Ofek, E.O., Gal-Yam, A. et al. 2004, ApJ 606, 381
- Maeda et al. (2003) Maeda, K., Mazzali, P.A., Deng, J. et al. 2003, ApJ 593, 931
- Mazzali, Iwamoto & Nomoto, (2000) Mazzali, P.A., Iwamoto, K., Nomoto, K. 2000, ApJ 545, 407
- Mazzali et al. (2002) Mazzali, P.A., Deng, J., Maeda, K. et al. 2002, ApJ 572, L61
- Meikle et al. (2002) Meikle, P., Lucy, L., Smartt, S. et al. 2002, IAU Circ. 7811
- Munari & Zwitter, (1997) Munari, U, Zwitter, T. 1997, A&A 318, 269
- Nakano et al. (2002) Nakano, S., Kushida, R., Kushida, Y., Li, W. 2002, IAU Circ. 7810
- Pandey et al. (2002) Pandey, S.B., Anupama, G.C., Sagar, R. et al. 2003, MNRAS 340, 375
- Patat et al. (2001) Patat, F. et al. 2001 ApJ 555, 900
- Pinto & Eastman, (2000) Pinto, P.A., Eastman, R.G. 2000, ApJ 530, 744
- Sandage & Tammann, (1974) Sandage, A.R., Tammann, G.A. 1974, ApJ 194, 559
- Schlegel et al. (1998) Schlegel, D., Finkbeiner, D., Davis, M. 1998, ApJ 500, 525
- Schmidt et al. (1994) Schmidt, B.P., Kirshner, R.P., Eastman, R.G. et al. 1994, ApJ 432, 42
- Sharina et al. (1996) Sharina, M.E., Karachentsev, I.D., Tikhonov, N.A. 1996, A&AS 119, 499
- Smartt et al. (2002) Smartt, S.J., Vreeswijk, P.M., Ramirez-Ruiz, E. et al. 2002, ApJ 572, 147
- Sohn & Davidge, (1996) Sohn, Y-J., Davidge, T.J. 1996, AJ 111, 2280
- Sohn & Davidge, (1998) Sohn, Y-J., Davidge, T.J. 1998, AJ 115, 130
- Soria et al. (2003) Soria, R., Pian, E., Mazzali, P.A. 2003, A&A 413, 107
- Stanek et al. (2003) Stanek, K.Z., Matheson, T., Garnavich, P.M. et al. 2003, ApJ 591, 17
- Sutaria et al. (2002) Sutaria, F.K., Chandra, P., Bhatnagar, S., Ray, A. 2002, A&A 397, 1011
- Takada-Hidai et al. (2002) Takada-Hidai, M., Aoki, W., Zhao, G. 2002, PASJ 54, 899
- Totani, (2003) Totani, T. 2003, ApJ 598, 1151
- Yoshii et al. (2003) Yoshii, Y., Tomita, H., Kobayashi, Y. et al. 2003, ApJ 592, 467
- Vinkó et al. (2001) Vinkó, J., Csák, B., Csizmadia, Sz. et al. 2001, A&A 372, 824
- Vinkó et al. (2003) Vinkó, J., Bíró, I.B., Csák, B. et al. 2003, A&A 397, 115
- Wang et al. (2002) Wang, L., Baade, D., Höflich, P., Wheeler, J.C. 2003, ApJ 592, 457