Formation Histories of Dwarf Galaxies in the Local Group
Abstract
We compare the properties of dwarf galaxies in the Local Group with the simulated galaxies formed before reionization in a cosmological simulation of unprecedented spatial and mass resolution, including radiative feedback effects. We find that a subset of the Local Group dwarfs are remarkably similar to the simulated dwarf galaxies in all their properties already before reionization. Based on this similarity, we propose the hypothesis that Local Group dwarfs form in a variety of ways: some of them are “true fossils” of the pre-reionization era, some of them form most of their stars later, after reionization (we call them “survivors” of the reionization era), and the rest of them form an intermediate group of “polluted fossils”. We also identify a simple observational test that is able to falsify our hypothesis.
1 Introduction
Nothing emphasizes our lack of understanding of the origin of the dwarf galaxies of the Local Group more than the well known “substructure crisis” of the Cold Dark Matter (CDM) paradigm (Klypin et al. 1999; Moore et al. 1999): the fact that the number of dark matter halos in the Local Group predicted by CDM simulations is much larger than the number of observed Galactic satellites. Several explanations have been suggested so far for resolving the “crisis”.
The hypothesis of Bullock, Kravtsov, & Weinberg (2000) - we will call it hereafter the “reionization scenario” - proposed that dwarf spheroidal (dSph) galaxies in the Local Group formed during the pre-reionization era and processes of photo-ionization feedback (Babul & Rees 1992; Efstathiou 1992; Shapiro, Giroux, & Babul 1994; Haiman, Rees, & Loeb 1996; Thoul & Weinberg 1996; Quinn, Katz, & Efstathiou 1996; Weinberg, Hernquist, & Katz 1997; Navarro & Steinmetz 1997; Gnedin 2000b; Dijkstra et al. 2004; Shapiro, Iliev, & Raga 2004, Susa & Umemura 2004) resulted in the suppression of star formation below the observable level in 90% of the low mass dark matter halos populating the Local Group. The “reionization scenario” is prompted by the fact that almost all Local Group dwarf Spheroidals exhibit a prominent old population and a decline of their star formation rates about ago. While in the standard -CDM theory (Spergel et al. 2003, Tegmark et al. 2004) stellar reionization took place ago, current observational techniques for measuring absolute stellar ages are not able to differentiate between and (e.g., Krauss & Chaboyer 2003). Although the observed drop of star formation rate is consistent with reionization at redshift , as noted by Grebel & Gallagher 2004, the metallicity spreads observed in the old populations may imply a star formation history protracted over about , to redshift . In this paper we critically discuss this important issue. We will show that our simulations reproduce the observed metallicity spreads without a protracted period of star formation. The metallicity spreads observed in our simulated dwarfs can be understood in terms of hierarchical accretion of sub-halos containing stars with different metallicities.
An alternative explanation to the “substructure crisis” was proposed by Stoehr et al. (2002). According to their hypothesis, dwarf galaxies are hosted in more massive dark matter halos ( M⊙) than in the reionization scenario. While this idea resolves the “crisis”, it does not provide an explanation for the origin of dwarf galaxies.
A more comprehensive and complex picture has been recently proposed by Kravtsov, Gnedin, & Klypin (2004). Under their hypothesis - which we will hereafter call the “tidal scenario” - most dwarf galaxies used to be much (up to a factor of 100) more massive during the formation episodes of the Milky Way and Andromeda, and so were not affected by photo-ionization feedback. They formed most of their stars at but later most of the dark matter was tidally stripped during their evolution within the Milky Way and Andromeda halos. Kravtsov et al. (2004) emphasize that in their model a large variety of star formation histories is observed, and some of dwarf galaxies do indeed follow the “reionization track”, but the bulk of stars in the Local Group dwarfs are formed after reionization.
Thus, the key difference between the reionization and tidal hypotheses is whether most of the stars in a given dwarf galaxy formed in halos of mass M⊙ before reionization (, ago) or in more massive halos after reionization, during the epoch of formation of the Milky Way and Andromeda (, ago).
In this paper we propose that dSphs are fossils of galaxies with mass M⊙ that formed before reionization while dIrr formed later in more massive halos. The original contribution of our study is that for the first time we have been able to simulate the first population of galaxies including the relevant feedback processes that are known to self-limit their formation. Before our work (Ricotti, Gnedin, & Shull 2002a, 2002b) the mainstream wisdom was that negative feedback effects (namely the rapid photo-dissociation of H2) suppress the formation of all galaxies with mass smaller than solar masses. We find instead that these galaxies do form and, at the epoch of their formation, they closely resemble dSph galaxies. This second result is the one we emphasize in the present paper. We also show that reionization feedback is not the dominant mechanism that suppresses star formation in most small mass halos. Negative feedbacks such as photo-heating by the stars inside each galaxy and inefficient cooling produce the observed properties of dSphs well before reionization of the IGM is complete.
It is quite surprising that we find such an astonishing agreement between all properties of simulated dwarf galaxies at and dSphs. Our simulations did improve on previous ones but are still far from a complete treatment of the problem that, as we will briefly illustrate, is non-trivial. The efficiency of star formation in the first mini-halos with masses M⊙ (i.e., virial temperature K) is determined by many competing feedback processes, including the formation and disruption of H2, metal enrichment, photoevaporation and SN explosions. Since small mass proto-galaxies cannot cool by Lyman-alpha emission, the presence of H2 molecules is essential to trigger their initial collapse. We know that H2 is easily destroyed by FUV radiation emitted by the first stars (negative feedback). On the other hand ionizing radiation and dust production are known to enhance the formation rate of H2 (positive feedbacks). Whether or not efficient star formation is possible in these mini-halos depends on which feedback (positive or negative) is dominant. By including 3D radiative transfer of ionizing radiation (Ricotti et al 2002a) in the simulations we are able to model two additional feedbacks: the positive feedback for H2 formation and the photoevaporation of dwarfs from internal sources. As already mentioned, contrary to previous studies we find that low surface brightness galaxies do form in a fraction of the first mini-halos. Reionization does not affect substantially their properties because they have already lost most of their gas due to internal ionizing sources. After reionization we expect that the formation of small mass galaxies will stop and their stellar populations will evolve only passively. Only the few most massive dwarfs in our simulation retained some of their gas and may continue to form stars after reionization.
In summary the goal of this paper is to provide evidences in support of the primordial origin of dSphs by comparing the abundant observational data on Local Group dwarfs with the results of detailed numerical simulation of formation of dwarf galaxies in the pre-reionization era. Aside for the origin of dSph galaxies the aim of study is to improve our understanding on theories of the formation of the first galaxies and answer a longstanding question: how massive were the first galaxies?
2 Simulation
The results shown in the present work are based on a detailed analysis of the galaxies found in high-resolution cosmological simulations of a cosmological volume during the pre-ionization era. The simulations include dark matter, gas, stars and the feedback of star formation on the gas chemistry and cooling. The main addition with respect to other works (e.g., Machacek et al. 2001, Tassis et al. 2003) is a self-consistent treatment of the spatially-inhomogeneous and time dependent radiative transfer of photons in four frequency bands (H Iionizing radiation, He I and He II ionizing radiation and optically thin radiation). This allows us to study in addition to the global feedback effects of the background radiation, also the role of internal and local feedback effects. Partially because of the inclusion of a more realistic treatment of radiative feedback, we find that the H2 photodissociating background is not the dominant feedback and does not stop star formation in mini-halos.
The simulation we use in this paper has been thoroughly described in Ricotti et al. (2002a, 2002b) as run “256L1p3”. Here we just remind the reader that the simulation included dark matter particles, an equal number of baryonic cells, and more than 700,000 stellar particles. The mass resolution of our simulation is 900 solar masses in baryons, and real comoving spatial resolution (twice the Plummer softening length) is (which corresponds to a physical scale of 24 parsecs at ). This unprecedented resolution allows us to resolve the cores of all simulated galaxies that would correspond to the observed Local Group dwarfs. The simulation includes most of the relevant physics, including time-dependent spatially-variable radiative transfer, detailed radiative transfer in Lyman-Werner bands, non-equilibrium ionization balance, etc.
In this work, however, we also include the effect of reionization in that simulation. Because the size of the simulation box has been fixed at comoving Mpc, the simulation volume is too small to model the process of cosmological reionization with sufficient accuracy. We, therefore, assume that the simulation volume is located inside an H II region of a bright galaxy at a higher redshift. Specifically, we introduce a source of ionizing radiation within the computational box, properly biased, which corresponds to a star-forming galaxy with the constant star formation rate of 1 solar mass per year (similar to star formation rates of observed Lyman Break Galaxies at , Steidel et al. 1999). The source is switched on at , and by the whole simulation box is completely ionized, and star formation in dwarf galaxies has ceased. Because of the computational expense, we have not continued our simulation beyond . As mentioned in the introduction the photoevaporation of dwarf galaxies after reionization has been studied extensively. Recent works include those of Shapiro, Iliev, & Raga (2004) and Susa & Umemura (2004) that addressed the importance of self-shielding using 3D simulations coupled to 1D radiative transfer (i.e., they assume that the ionizing source is very far from the dwarf galaxy).
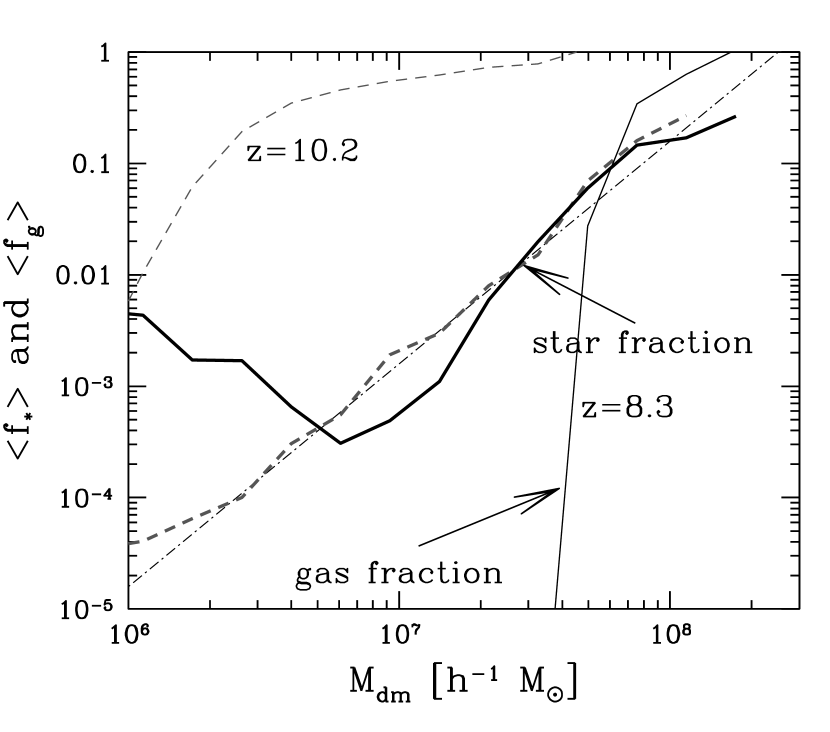
Figure 1 shows the mean gas (thin lines) and stellar (thick lines) fractions as a function of the dark matter mass for the objects in our simulation. We show these quantities at redshift (dashed lines) and (solid lines). Notice that the objects with masses below about contain no gas at the end of our simulation. Most of the small mass galaxies loose all their gas well before reionization that in our simulation happens between redshift and . This is the result of gas photo-heating by massive stars inside the galaxy and not by the external ionizing background. A remarkable result is that the mean stellar fraction is a time-independent quantity. It is apparent from the figure that the mean stellar fraction as a function of halo mass is well approximated by power law that does not evolve with redshift (the increase in the stellar fraction for the lowest mass objects is probably an artifact of the limited mass resolution).
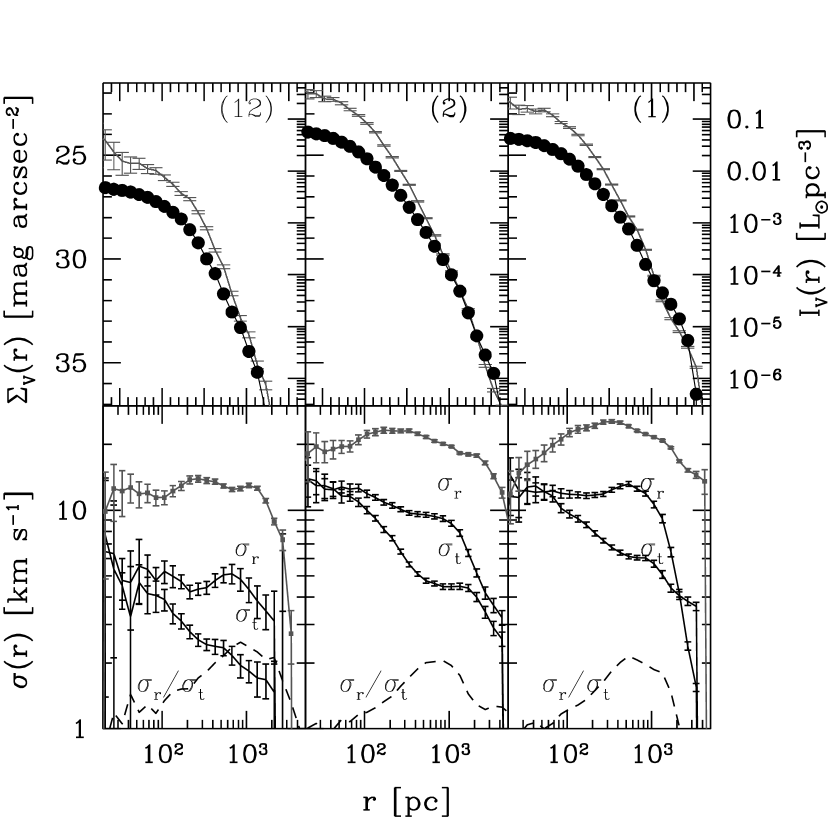
Figure 2 shows radial profiles for three representative and well resolved objects. In the top panels we show surface (filled circles) and volume (gray lines) luminosity densities in the V band. The bottom panels show the velocity dispersions for both the dark matter (about particles per halo) and stars (about particles per halo). Notice that stellar velocity dispersions (black points) are below that of the dark matter (gray triangles), and that stellar orbits are mildly anisotropic in the outer parts. The dashed lines in the bottom panels show , where and are the radial and tangential velocity dispersions, respectively.
Clearly, it is a long way to go from to the present day. Therefore, in the rest of this paper, we are assuming that the stellar component of our galaxies does not change after except due to passive stellar evolution. This hypothesis, obviously, does not apply to all observed dwarfs, but it may apply to some of them - as we discuss later. The probability, , of a galaxy collapsed at redshift to survive to redshift without being incorporated into a larger object is approximately (Sasaki 1994). We can therefore estimate that about 10% of the galaxies present in our simulation at may have survived almost unspoiled until today. With this approach, we cannot determine what dark matter mass these galaxies would have by : they can continue accreting111Note that a dark matter halo that virializes at by the time it reaches redshift is about ten times larger in size and in mass even if it did evolve passively without accreting any satellite (i.e., in isolation). This is a consequence of the cosmological evolution of the Hubble constant and mean density of the IGM in which it is embedded (see Gunn & Gott 1972; Ricotti & Wilkinson 2004). the dark matter and then lose a significant fraction of it during their orbital evolution within the parent galaxy halo (in this case - Milky Way or Andromeda). It is therefore important to keep in mind throughout this paper that we only use the properties of the stellar components of simulated galaxies. Thus, we cannot make a direct test of the tidal scenario, and have to rely on stars to tell us the story of the dark matter.
In order to predict the luminosities and stellar densities of simulated galaxies at , we need to take into account stellar mass-to-light ratios and stellar evolution. Since the simulated stars would be old by , we adopt a value for the mass-to-light ratio as measured in old galactic globular clusters, (e.g., Mandushev et al. 1991, Pryor & Meylan 1993). In addition, after some of stellar evolution, assuming Kroupa IMF we estimated (using Starburst99, Leitherer et al. 1999) that our stars will loose about 50% of their mass. The exact value depends on the assumed lower mass cutoff of the IMF. Thus, in order to compute the luminosities of the simulated galaxies at , we adopt a fiducial ratio of . However, our results are not immensely sensitive to that number - changing it to 2 or 10 would not change our conclusions (see Fig. 3 and Fig. 4).
3 Results
The core of the reionization scenario is that some of the Local Group dwarfs are true fossils of the pre-reionization era. Clearly, not all dwarfs fall into this category, since many of them had recent episodes of star formation. But is there a subset of Local Group dwarfs that formed before reionization? We can attempt to answer this question by comparing our simulated dwarfs as they would appear at with the real observed galaxies. Figure 3 presents such a comparison for the basic structural parameters: the luminosity , the core radius , and the central luminosity density , defined as , where is the surface brightness. From the top panel of that figure it is clear that the simulated galaxies, shown by the gray squares without error-bars, do not exceed about . Moreover, it appears that the observed galaxies (shown by squares with error-bars, open circles, and filled circles - the different symbols will be explained later in the text) also fall into two groups - those with luminosities on the order of and below, and those with luminosities in excess of . In addition, these two groups are also clearly separated in plane. The low luminosity dwarfs appear to trace the same distribution as the simulated galaxies, having smaller core radii as the central luminosity density increases. This observation can be understood in terms of the less efficient cooling of the gas in dark matter halos of smaller mass.
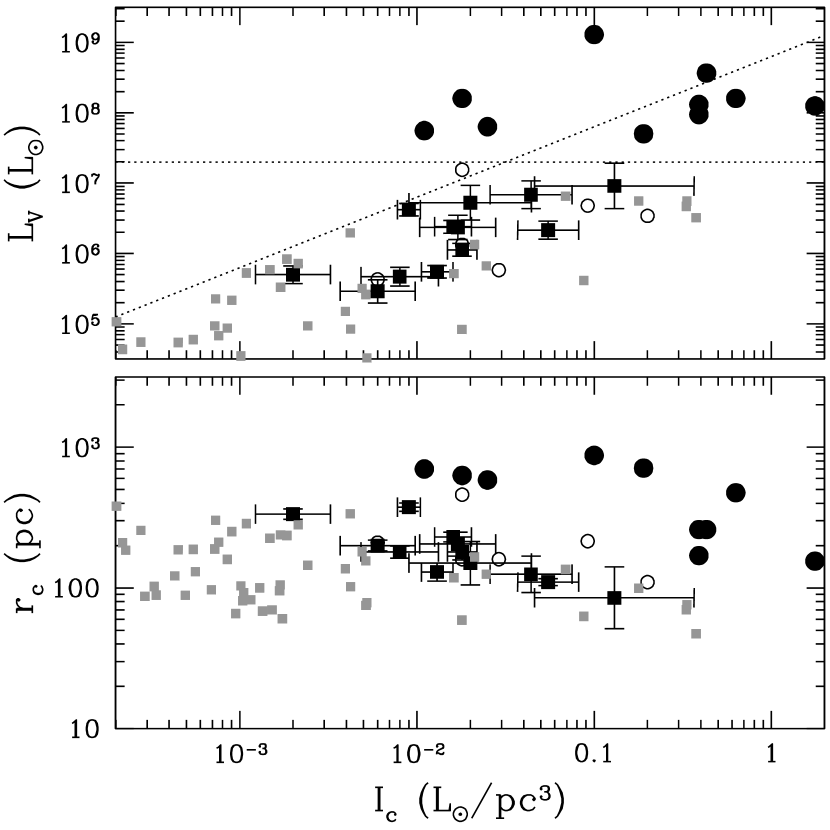
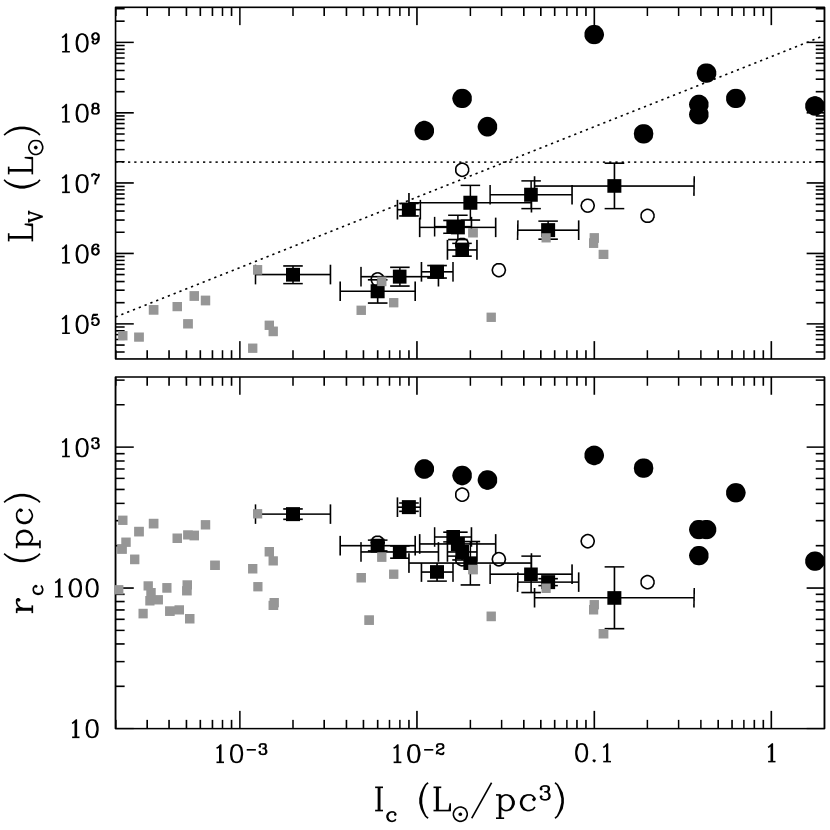
Since our simulation has a finite size of the computational box, it is clear that we miss most luminous galaxies forming at the same time as our simulated dwarfs. The tilted dotted line roughly traces the upper envelope of the simulated galaxies, so brighter galaxies that trace the same distribution in the plane would fall below that line. Some of the observed dwarfs are indeed in this region, but, as the bottom panel of Figure 3 shows, their core radii are somewhat larger than those of the simulated galaxies. Thus, we can be confident that we do not miss a large fraction of more luminous dwarfs in our simulation that follow the same distribution as the faint ones. It does not, of course, mean that there should be no more luminous galaxies in a simulation with a larger volume - they will be present, but most of them will have masses in excess of . Therefore, because they will collapse via atomic line cooling, they should have a very different internal structure and be much less susceptible to losing their gas after reionization. Figure 4 is the same as Figure 3 but we assume instead of the fiducial value . The purpose of this figure is to show that our results are robust and almost independent on the assumed ratio.
It is tempting, therefore, to hypothesize that the two groups of low and high luminosity dwarfs correspond to two distinct formation tracks - the low luminosity ones are the “fossils” of the pre-reionization era, and high luminosity ones formed their stars via atomic line cooling perhaps via Kravtsov et al. (2004) scenario, as tidally stripped more massive halos (in the absence of a better name, we will call them “survivors” of reionization era).
We can now see how our separation in these two groups (based only on the luminosity) compare with the available data on the star formation history of observed dwarfs. Hereafter we will adopt the star formation histories compiled by Grebel & Gallagher (2004). It is well known that almost all dwarfs in addition to a more or less prominent old population clearly show some more recent star formation. Therefore taken at face value, our hypothesis does not hold in comparison with the data. However, it is unreasonable to assume that all of the galaxies that formed during the pre-reionization era formed absolutely no stars afterwards. Some of them should surely continue accreting dark matter, becoming more massive and switching from the “reionization” track to the “tidal” track. To be more specific, the ability of a dark matter halo to accrete fresh intergalactic gas is controlled by the filtering mass (Gnedin 2000b). In the standard CDM theory the filtering mass increases with time, as does the mass of an individual dark matter halo. Thus, the question of whether a given halo is able to accrete fresh gas after reionization (and, presumably, form new stars) depends on whether its mass grows faster or slower than the filtering mass. We can, therefore, expect that some of galaxies that formed before reionization will form no new stars, and some of them will form more stars as they fall into the Milky Way or Andromeda halo and their local filtering mass and accretion history vary. The specific rate with which the gas is re-accreated must depend on the details of a satellite orbit, as has been emphasized by Kravtsov et al. (2004), and so a large variety of possible star formation histories is expected, in a qualitative agreement with the observational data. A much more advanced simulation than the one presented here will be required, however, to check whether a quantitative agreement between the theory and the data holds - for example, whether the relative fractions of dwarfs with different star formation histories are consistent with the data.
As mentioned in the introduction another problem faced by the “fossil” hypothesis is the large metallicity spreads observed in dwarfs with a dominant old population. Grebel & Gallagher (2004), have suggested that these large spreads are not compatible with star formation protracted over a period of less than 1 Gyr (the time elapsed before reionization). They conclude therefore that star formation in old dwarfs was not affected by reionization. In defense of the “fossil” hypothesis we will show as part of our analysis that the metallicity spreads in our simulated dwarfs are consistent with observations. Note that star formation in these dwarfs was protracted for less than 1 Gyr. Our result is probably due to accretion of stars from satellites with different metallicities and wouldn’t be captured by any standard chemical evolutionary model.
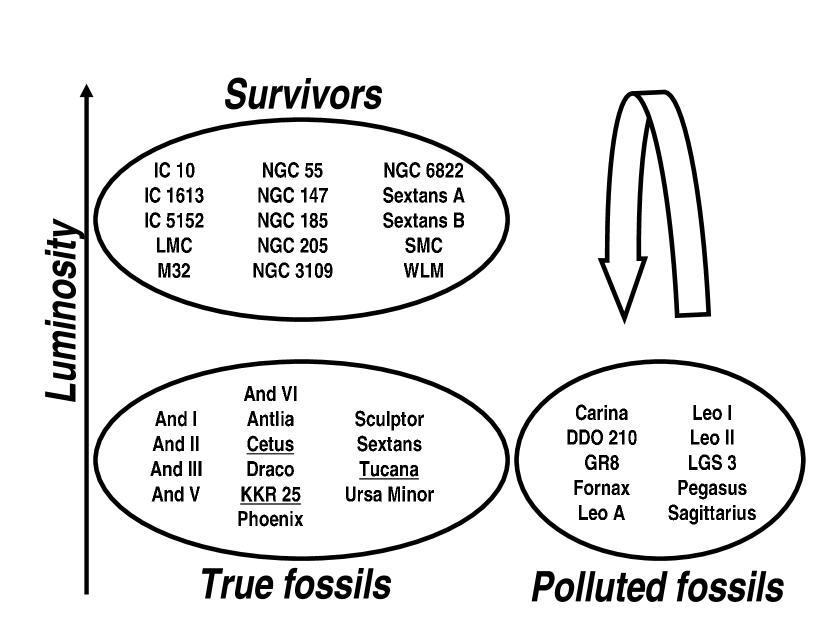
In order to schematically separate the observed dwarfs in groups according to their star formation histories, we call those dwarfs that formed few (say, less than 30%) stars after reionization “true fossils”, and those that did form a substantial amount of stars “polluted fossils”. The various symbols in Figure 3 and the following ones correspond to these classes: “true fossils” are shown with filled squares with error bars, “polluted fossils” are shown with open circles. Galaxies with dominant younger stellar populations (they mostly are dIrrs) are shown with larger filled circles and we call them “survivors”. For the last two groups the error bars are not shown for the sake of clarity. All the galaxies in our simulation have almost identical properties to the “true fossils” and most “polluted fossils”. All these galaxies have a prominent old stellar population as expected. Instead all the galaxies with a prominent young population (filled circles) are part of a distinct population that is not present in our simulation.
Figure 5 presents a separation of the Local Group dwarfs into these three types. Galaxies identified as “survivors” can be thought of as those dwarfs which formed after reionization (or mostly after reionization), and for which the total mass exceeded the local filtering mass at some moment during their evolution. Polluted fossils formed a significant fraction of their stars in the pre-reionization era, but also exceeded the local filtering mass at some point in their history. The “true fossils” formed most of their stars in the pre-reionization era. As a weak argument in favor of this hypothesis, we notice that “polluted fossils” are on average brighter than the “true” ones.
This separation of galaxies into individual classes is in some cases rather artificial. For example both Sextans and Fornax had some recent star formation. We labeled Sextans a “true fossil” because this recent episode was very small, while Fornax had a factor of 3 to 4 more stars formed after reionization, and so is labeled a “polluted fossil”. Based on their star formation history Leo A and Leo I could also be classified as low luminosity “survivors”.
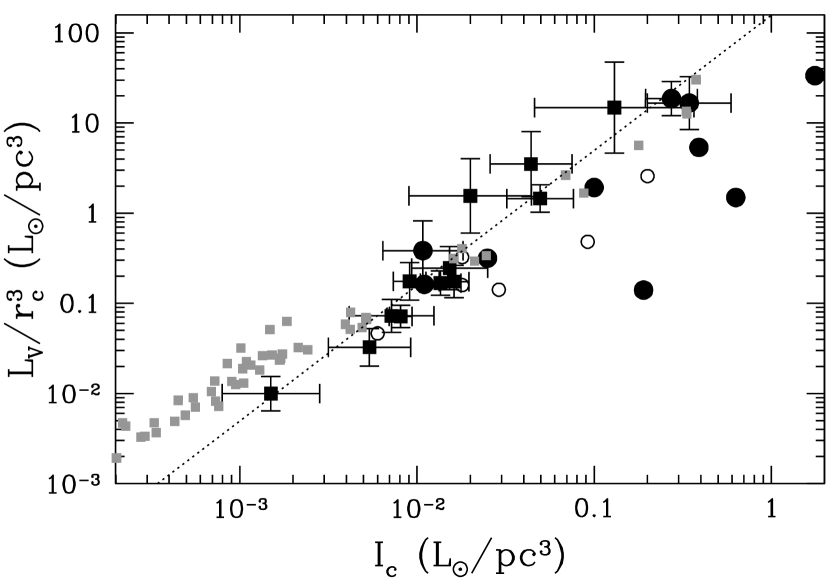
In order to support our conclusion, we consider other properties of the simulated and real galaxies. Figure 6 shows the comparison between the data and the simulation for the relation between and , discussed in Gnedin (2000a). We find a scaling relationship
shown by the dotted line. If the interpretation of Gnedin (2000a) of this relation is correct, then it simply reflects the Schmidt law for star formation on scales of hundreds of parsecs - in that case the agreement between the data and the simulation is by construction, rather than a success of the model: the star formation in the simulation is assumed to follow the Schmidt law (1.5 slope in the relation between the star formation rate and gas density), and the amplitude is fixed by observational constraints. On the other hand, this agreement does support the reionization scenario, because “survivors” do not follow this tight relation, which could be expected if their stars formed in several independent bursts.
Note that is the ratio of the total luminosity to the core luminosity and is therefore a measure of how concentrated the light of the dwarf galaxy is. This ratio is less than 10 for dSph galaxies like Draco and Ursa Minor () and is almost 100 for dEs like NGC205 and NGC147 (). The galaxies that we classified as “survivors” have generally central luminosity density comparable to dEs but less concentrated light profiles. We do not observe such objects in our simulation - despite the fact that cores of these galaxies, if they were present in the simulation, would be completely resolved.
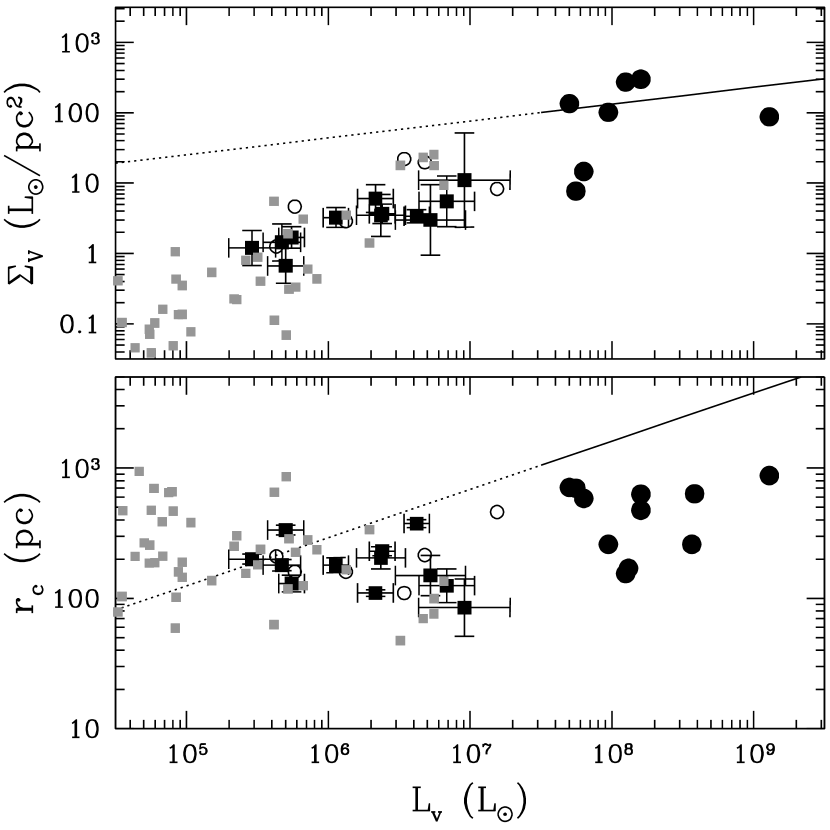
Figure 7 compares the surface brightness and the core radii of simulated and observed galaxies as a function of the luminosity. The simulation reproduces very well the structural properties and scaling relations of the galaxies that we classified as “true fossils”. The lines show, for comparison, the scaling relations derived by Kormendy & Freeman (2004) for more luminous late-type galaxies (Sc-Im) with luminosities in the range .
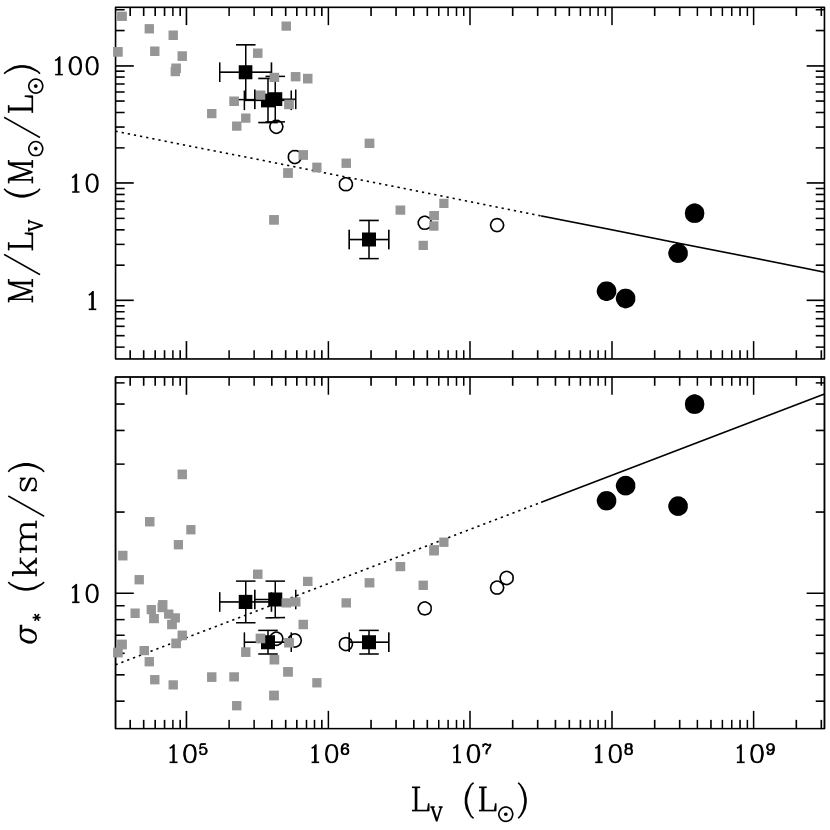
Figure 8 compares the dynamical state of these galaxies: the stellar velocity dispersion and the total mass-to-light ratio. The latter quantity for the simulated galaxies is computed in the same way as for the observed ones (, see Mateo 1998), and is not taken from the simulations, because, as we have mentioned above, there is no simple way to relate the dark matter mass of simulated galaxies at with their dark matter masses at . For a comparison, the solid lines show the same scaling relations for late-type galaxies (Kormendy & Freeman 2004). Within the errors the relation seems to be the same power law for all the galaxy types, but “true fossils” obey a steeper relationship between the mass-to-light ratio and luminosity than dIrr and Sc-Im galaxies.
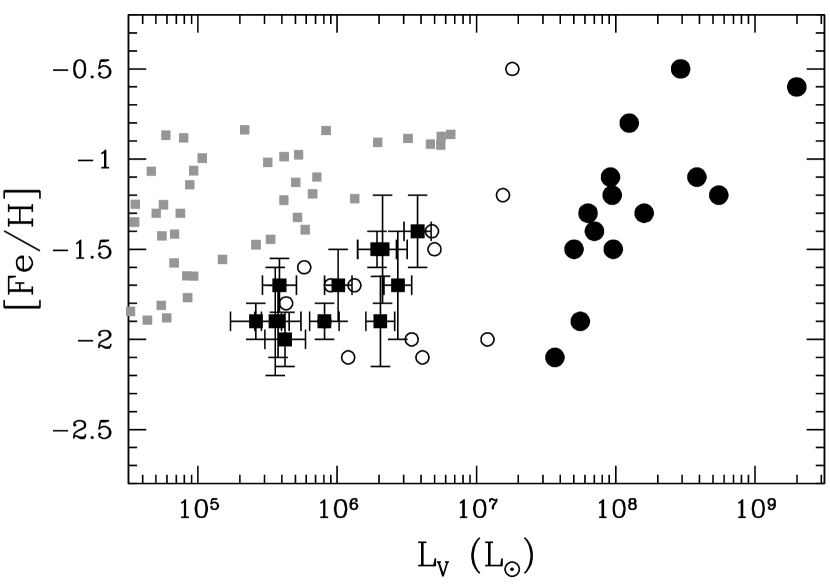
Figure 9 gives yet another comparison between the simulation and the data: the metallicity as a function of stellar luminosity. The agreement between stellar metallicities in the simulation and the data is somewhat worse: while the spread in the distribution is consistent with the data, simulated galaxies are more metal-rich by about a factor of . At this point we are not worried by this disagreement as our simulation is not sophisticated enough to predict the stellar metallicities to within a factor of two. There are several physical and numerical effects that will lead to overestimated stellar metallicities in the simulations, such as preferential ejection by supernovae of metal-enriched gas (MacLow & Ferrara 1999), imperfect mixing of the supernova ejecta on scales not resolved by a simulation, reduced gas accretion on the simulated galaxies due to a limited size of the computational box, etc.
Low metallicity stars can be produced in two different ways: either by inefficient star formation combined with continuous gas loss, or in a single short burst. The first scenario is consistent with the properties of dSph galaxies which have an extended low surface brightness stellar component. The second scenario is usually associated with a higher efficiency of star formation, which results in a more concentrated light profile than the one observed in dSph, and is probably more appropriate to explain the metal enrichment of globular cluster and dwarf Elliptical galaxies.
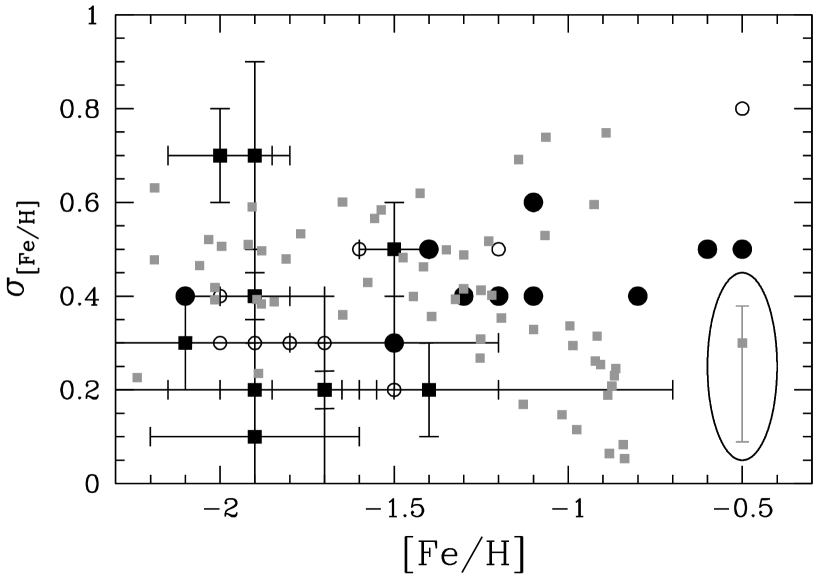
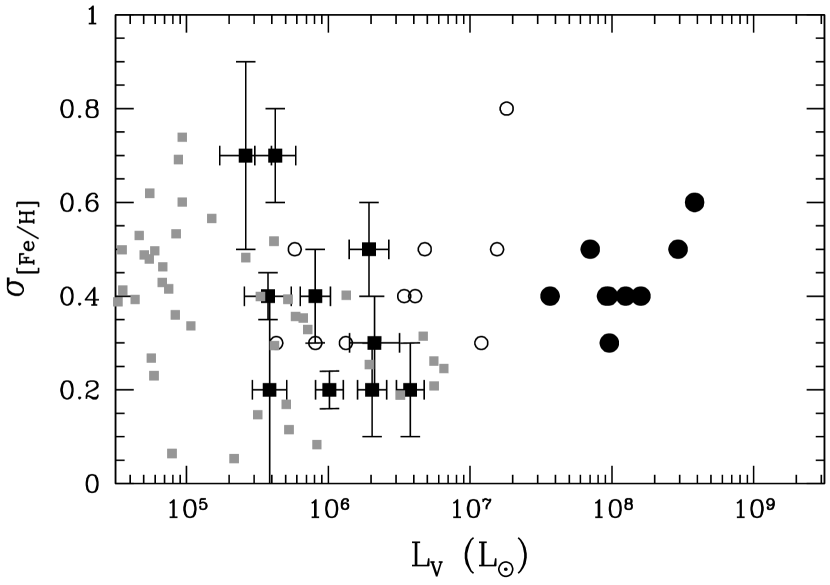
We have already anticipated that our simulation reproduce the large metallicity spreads observed in dSphs. In Figure 10 we show a comparison between the simulated and the observational data for the metallicity spreads, , both as a function of the mean metallicity [Fe/H] (left panel) and as a function of luminosity (right panel). We find that the typical metallicity variance in each dwarf is about 0.5 dex, in good agreement with observations. The star formation history in simulated dwarfs is characterized by multiple instantaneous starbursts extended over a period of 0.5-1 Gyr. The starbursts often do occur almost the same time but in distinct dark matter sub-halos that are in the process of merging to form a more massive dwarf. The accretion of stars from the hierarchical distribution of sub-halos partially explains the large metallicity spread that we find in our simulation.
Thus we conclude that the large metallicity spread observed in the old stellar population of dSphs is not a definite signature of star formation extended over 2-4 Gyrs (Ikuta & Arimoto 2002; Grebel & Gallagher 2004). Neither the argument based on the long timescale (e.g., 1-4 Gyr) needed to have a substantial iron production by Type Ia SN is a strong argument in favor of prolonged star formation. The typical time scale for iron enrichment by Type Ia SN is uncertain and very likely is dependent on the mode of star formation. Matteucci & Recchi (2001) estimated that this time scale varies from 40-50 Myr for an instantaneous starburst to 0.3 Gyr for a typical elliptical galaxy to 4-5 Gyr for a disk of a spiral galaxy like the Milky Way. The often quoted 1 Gyr time scale is based on observations of [/Fe] versus [Fe/H] in the solar neighborhood stars and is not an universal value. A more detailed study would be needed to derive accurate metal abundance ratios based on the star formation and merger histories found in the simulations. This is beyond the aim of the present paper but it is worth pursuing in a separate study.

We can also study the stellar metallicity distribution in each one of our simulated dwarfs. Figure 11 show such an example. The solid and dashed lines show the number and mass weighted distributions respectively. The metallicity distribution is skewed toward low metallicities but only a small fraction of the stars, having metallicities Z⊙, could be defined as Population III stars.
4 Discussion
In this paper we have proposed that dwarf galaxies of the Local Group (and, by implication, all other dwarf galaxies in the universe) formed in three different evolutionary paths:
- “true fossils”
-
formed most of their stars in the pre-reionization era, and have had little (say, less than 30%) star formation since then;
- “polluted fossils”
-
started as true fossils, but had substantial episode(s) of subsequent star formation as they continued accreting mass and were tidally shocked during the formation of the parent galaxy halo; finally
- “survivors”
-
started forming stars mostly after reionization.
This conclusion is motivated by considering star formation histories of Local Group dwarfs and by comparing their properties with properties of simulated galaxies that formed all their stars before cosmological reionization. The fact that our simulated galaxies are remarkably similar to the subset of the Local Groups dwarfs that we identified as “true fossils” in Figure 5 renders support to our conclusions. This subset includes about all known dSphs.
To avoid confusion it is worth noting that the structural properties of the galaxies that we call “true fossils” are the result of feedback processes in action prior to reionization. The effect of reionization is simply to preserve those properties by suppressing the star formation rate in halos with masses that remain smaller than the filtering mass in the IGM. In this sense our model differs from the standard “reionization” scenario for the formation of dwarf galaxies.
How would one test this hypothesis? For example, the main argument of Kravtsov et al. (2004) for the tidal origin of the majority of Local Group dwarfs is their preferential location close to the parent galaxy. However, true fossils, living in the oldest dark matter halos of their mass, are highly biased, and are also preferentially located closer to the center of the parent halo. Moreover there are at least two examples of dSph galaxies that are quite far from massive galaxies: Cetus and Tucana, and perhaps the newly discovered Apples1 (Pasquali et al. 2005).
A more powerful test is based on our conclusion that “survivors” form later than the “true fossils”. While measuring absolute ages of dwarf galaxies to precision is not possible at the moment, determining the relative difference of about in age between two galaxies observed by a uniform technique may, in fact, be possible for a specific range of metallicities and ages using the so-called “horizontal branch index” (G. Gilmore, private communication; also see Zinn 1993; Harbeck et al. 2001; Makey & Gilmore 2004): younger galaxies have redder horizontal branch for the same metallicity, although, how precise the horizontal branch index method is and the role of the so-called “second parameter effect” is still a matter of debate (the anonymous referee, private communication).
Luckily, some of the Local Group dwarfs fall into that range of parameters. For example, two galaxies of our “true fossil” group - And I and And II - have , similar to the iron abundance in two of “survivors” - WLM and NGC3109 (having pairs of galaxies with the same metallicity is absolutely crucial as even small differences in metallicities can obscure large differences in age). Thus, we can make a prediction that most of the stars that formed in the first burst of star formation in WLM and NGC3109 should be about younger than most of stars in And I and And II. The color-magnitude diagrams of And I, And II, and WLM are measured down to , well below the horizontal branch (Da Costa, Armandroff, & Caldwell 2002; Rejkuba et al. 2000), although, to the best of our knowledge, no photometry down to that levels exists for NGC3109. Visual comparison of the horizontal branch morphologies for the first three galaxies indicate that And I and And II are indeed substantially older than WLM, also a more rigorous, quantitative test is required to confirm the visual impression. Such a comparison would be a crucial test of our hypothesis - if it is found that And I and And II are not substantially older than WLM and NGC3109, that would imply that they are not “true fossils”, and by inference, few other dwarf spheroidals are. The main problem that affects this method when comparing the old populations of dSphs to dIrrs is that normally dIrrs have mixed populations and the overlap between the blue horizontal branch and the young main sequence make it difficult to derive reliable horizontal branch morphology indices in dIrrs. Perhaps a more reliable and accurate relative age indicator is the main sequence turn-off. The internal accuracy can be better than 1 Gyr in few nearby dwarfs with photometric data that extends below the main-sequence turnoff.
Using available data, Grebel & Gallagher (2004) address the impact of reionization on the star formation histories of dwarf galaxies. They conclude that most or all dwarf galaxies present an old population that is coeval with the oldest Milky Way populations. They also find that all of the Local Group dwarf galaxies exhibit considerable abundance spreads even within their old populations indicating that star formation did not occur in a single burst, but in episodes that must have extended over several Gyr, well beyond reionization. In this paper we have argued that the observed metallicity spreads are not necessarily an indication of star formation extended over several Gyr. In our simulations all the dwarfs that form before reionization have metallicity spreads consistent with observations. The large iron abundances in dSphs have also been used as an argument in favor of an extended star formation. This is because the time-scale for iron enrichment is often assumed to be longer than 1 Gyr. But we point out that this assumption may be true for a continuous mode of star formation, but is not necessarily universally true. The time scale depends on the star formation history and could be as short as for a bursting mode of star formation (Matteucci & Recchi 2001).
In principle, ratio could be used to discriminate between star formation histories consisting of a single burst or a more prolonged episode of star formation. At the moment it is not clear how much this test could distinguish “true fossils” from “survivors”, since both are expected to have the main burst of star formation for a relatively short period of time. The star formation rate in the “true fossils” should decrease substantially after reionization. In addition our simulations show that they have a very peculiar mode of star formation characterized by multiple short bursts (about long). It is unclear to us how this mode of star formation may affect their ratio and be used as a discriminant. Using existing data on ratios in dSphs (Tolstoy et al. 2003, Venn et al. 2004) it might be possible to distinguish between different star formation and enrichment histories but this would require a more detailed modelling that is beyond the aim of the present paper.
In addition, we find that the most massive end of the “true fossils” population in our simulation (with mass ) retain a fraction of their gas even after reionization (see Fig. 1). These few “transition” objects may continue forming stars for a while after reionization and have a more extended period of star formation with respect to the rest of the “fossil” population.

To conclude, we would like to emphasize another exciting possibility. From the results of our simulations, we feel quite confident in predicting the existence of fainter and lower surface brightness galaxies than the one currently discovered (see the gray squares at the extreme left corners in Figs. 3, 6 and 7). Two promising candidates for such a class of dwarf galaxies were recently discovered in M31 and near the Milky Way (Zucker et al. 2004, Willman et al. 2005).
As we mentioned above, it is mostly likely that the majority of reionization fossils will merge into larger objects by , and only a small fraction of them will survive. Thus, we can introduce a “survival probability” (which can be a function of other parameters, in particular the luminosity) of a reionization fossil to remain intact by the present time. This probability can be estimated by comparing the number of observed dwarfs in the Local Group (the total mass is about ) with the number of simulated galaxies in our volume (with the total mass of ). If we assume that both the observations and our simulation are complete for galaxies with between and , we find a value of for the survival probability in this luminosity range.
Figure 12 shows our predictions for the abundance of these “ultra-dwarfs” in the Local Group. The solid line in Fig. 12 refers to the case in which the survival probability of reionization fossils is kept constant at - in this case the observations may be missing about half of the satellites with luminosities in the range (due to a small size of the computational box, out simulation is incomplete for , as we discussed above). Alternatively, we can assume that the observations are complete in this luminosity range, in which case the survival probability must be a weak function of luminosity. Fitting the power-law dependence (as an example) to the abundance of observed dwarfs in the three lowest luminosity bins (), we find (this fit reaches for the Milky Way luminosity, and so, at least, makes sense). This case is shown with the dashed line in Fig. 12. As one can see, a modest change in the survival probability makes a large change in the predicted numbers of dwarf galaxies in the luminosity range, and, thus, predicting the precise abundance of “ultra-dwarfs” will be difficult. On the other hand, measuring the abundance of dwarf galaxies in this luminosity range will put non-trivial constraints on the luminosity dependence of the survival probability, and, therefore, on the hierarchical merging process and galaxy clustering on extremely small mass scales.
Although the detection of such objects in the Milky Way is very difficult if not impossible using photometric techniques (due to contamination from foreground stars), in the future it might become possible to search for these objects using spectroscopic techniques by measuring the radial velocities of many stars. Any observation able to put constraints on properties of the faintest bound object in the Local Group would be of extreme interests not only for understanding galaxy formation in the early universe, but, more importantly, for uncovering the properties of the elusive dark matter particles.
References
- (1)
- (2) Babul, A., & Rees, M. J. 1992, MNRAS, 255, 346
- (3)
- (4) Bullock, J. S., Kravtsov, A. V., & Weinberg, D. H. 2001, ApJ, 548, 33
- (5)
- (6) Da Costa, G. S., Armandroff, T. E., & Caldwell, M. 2002, AJ, 124, 332
- (7)
- (8) Dijkstra, M., Haiman, Z., Rees, M. J., & Weinberg, D. H. 2004, ApJ, 601, 666
- (9)
- (10) Dolphin, A. E. 2002, MNRAS, 332, 91
- (11)
- (12) Efstathiou, G. 1992, MNRAS, 256, 43P
- (13)
- (14) Gnedin, N. Y. 2000a, ApJ, 535, L75
- (15)
- (16) Gnedin, N. Y. 2000b, ApJ, 542, 535
- (17)
- (18) Grebel, E. K. 1999, in Proceedings of the 192 symposium of the International Astronomical Union, The stellar content of Local Group galaxies, eds. P. Whitelock, R. Cannon, (San Francisco: Astronomical Society of the Pacific), 17
- (19)
- (20) Grebel, E. K., Gallagher, J. S., & Harbeck, D. 2003, AJ, 125, 1926
- (21)
- (22) Grebel, E. K., & Gallagher, J. S. 2004, ApJL, 610, L89
- (23)
- (24) Gunn, J. E., & Gott, J. R. I. 1972, ApJ, 176, 1
- (25)
- (26) Haiman, Z., Rees, M. J., & Loeb, A. 1996, ApJ, 467, 522
- (27)
- (28) Harbeck, D., et al. 2001, AJ, 122, 3092
- (29)
- (30) Harbeck, D., Gallagher, J. S., & Grebel, E. K. 2004, AJ, 127, 2711
- (31)
- (32) Hernandez, X., Gilmore, G., & Valls-Gabaud, D. 2000, MNRAS, 317, 831
- (33)
- (34) Ikuta, C., Arimoto, N. 2002, A&A, 391, 55
- (35)
- (36) Karachentsev, I. D., et al. 2001, A&A, 379, 407
- (37)
- (38) Klypin, A., Kravtsov, A. V., Valenzuela, O., & Prada, F. 1999, ApJ, 522, 82
- (39)
- (40) Kormendy, J. & Freeman, K. C. 2004, in Proceedings of the 220 symposium of the International Astronomical, eds. S. D. Ryder, D. J. Pisano, M. A. Walker, K. C. Freeman, (San Francisco: Astronomical Society of the Pacific), 377
- (41)
- (42) Krauss, L. M., & Chaboyer, B. 2003, Science, 299, 65
- (43)
- (44) Kravtsov, A. V., Gnedin, O. Y., & Klypin, A. A. 2004, ApJ, 609, 482
- (45)
- (46) Machacek, M. E., Bryan, G. L. & Abel, T. 2001, ApJ, 548, 509
- (47)
- (48) Mandushev, G., Staneva, A., & Spasova, N. 1991, AAP, 252, 94
- (49)
- (50) Mac Low, M., & Ferrara, A. 1999, ApJ, 513, 142
- (51)
- (52) Mackey, A. D., & Gilmore, G. F. 2004, MNRAS, 355, 504
- (53)
- (54) Mandushev, G., Staneva, A., & Spasova, N. 1991, A&A, 252, 94
- (55)
- (56) Mateo, M. 1998, ARAA, 36, 435
- (57)
- (58) Matteucci, F. & Recchi, S. 2001, ApJ, 558, 351
- (59)
- (60) Moore, B., Ghigna, S., Governato, F., Lake, G., Quinn, T., Stadel, J., & Tozzi, P. 1999, ApJ, 524, L19
- (61)
- (62) Navarro, J., & Steinmetz, M. 1997, ApJ, 478, 13
- (63)
- (64) Pasquali, A., Larsen, S., Ferreras, I., Gnedin, O. Y., Malhotra, S., Rhoads, J. E., Pirzkal, N., & Walsh, J. R. 2005, AJ, 129, 148
- (65)
- (66) Pryor, C., & Meylan, G. 1993, in Astronomical Society of the Pacific Conference Series, vol. 50, Structure and Dynamics of Globular Clusters, eds. S. G. Djorgovski, G. Meylan, (San Francisco: Astronomical Society of the Pacific), 357
- (67)
- (68) Quinn, T., Katz, N., & Efstathiou, G. 1996, ApJ, 278, 49P
- (69)
- (70) Rejkuba, M., Minniti, D., Gregg, M. D., Zijlstra, A. A., Alonso, M. V., & Goudfrooij, P. 2000, AJ, 120, 801
- (71)
- (72) Ricotti, M., Gnedin, N. Y., & Shull, J. M. 2001, ApJ, 560, 580
- (73)
- (74) Ricotti, M., Gnedin, N. Y., & Shull, J. M. 2002a, ApJ, 575, 33
- (75)
- (76) Ricotti, M., Gnedin, N. Y., & Shull, J. M. 2002b, ApJ, 575, 49
- (77)
- (78) Ricotti, M., & Wilkinson, M. I. 2004, MNRAS, 353, 867
- (79)
- (80) Sasaki, S. 1994, PASJ, 46, 427
- (81)
- (82) Shapiro, P. R., Giroux, M. L., & Babul, A. 1994, ApJ, 427, 25
- (83)
- (84) Shapiro, P. R., Iliev, I. T., & Raga, A. C. 2004, MNRAS, 348, 753
- (85)
- (86) Shetrone, M. D., Côté, P., & Sargent, W. L. W. 2001, ApJ, 548, 592
- (87)
- (88) Siegel, M. H. & Majewski, S. R. 2000, AJ, 120, 284
- (89)
- (90) Spergel, D. N., et al. 2003, ApJS, 148, 175
- (91)
- (92) Steidel, C. C., Adelberger, K. L., Ciavalisco, M., Dickinson, M., & Pettini, M. 1999, ApJ, 519, 1
- (93)
- (94) Stoehr, F,. White, S. D. M., Tormen, G., & Springel, V. 2002, MNRAS, 335, L84
- (95)
- (96) Susa, H. & Umemura, M. 2004, ApJ, 600, 1
- (97)
- (98) Tassis, K., Abel, T., Bryan, G. L. & Norman, M. L. 2003, ApJ, 587, 13
- (99)
- (100) Tegmark, M., et al. 2004, PRD, 69, j3501
- (101)
- (102) Thoul, A. A., & Weinberg, D. H. 1996, ApJ, 465, 608
- (103)
- (104) Tolstoy, E., Venn, K. A., Shetrone, M., Primas, F., Hill, V., Kaufer, A., & Szeifert, T. 2003, AJ, 125, 707
- (105)
- (106) van den Bergh, S. 2000, PASP, 112, 529
- (107)
- (108) Venn, K. A., Irwin, M., Shetrone, M. D., Tout, C. A., Hill, V., & Tolstoy, E. 2004, AJ, 128, 1177
- (109)
- (110) Weinberg, D. H., Hernquist, L., & Katz, N. 1997, ApJ, 477, 8
- (111)
- (112) Wilkinson, M. I., Kleyna, J. T., Evans, N. W., Gilmore, G. F., Irwin, M. J., & Grebel, E. K. 2004, ApJ, 611, L21
- (113)
- (114) Willman, B., et al. 2005, ApJL, submitted (astro-ph/0503552)
- (115)
- (116) Woosley, S. E., & Weaver, T. A. 1995, ApJS, 101, 181
- (117)
- (118) Zinn, R. 1993, in Astronomical Society of the Pacific Conference Series, vol. 48, The globular clusters-galaxy connection, eds. G. H. Smith, J. P. Brodie, (San Francisco: Astronomical Society of the Pacific (ASP), 302
- (119)
- (120) Zucker et al. 2004, ApJ, 612, L121