XMM-Newton study of the lensing cluster of galaxies CL002417 ††thanks: This work is based on observations made with the XMM-Newton, an ESA science mission with instruments and contributions directly funded by ESA member states and the USA (NASA). ††thanks: Based on observations made with the European Southern Observatory telescopes obtained from the ESO/ST-ECF Science Archive Facility.
We present a detailed gravitational mass measurement based on the XMM-Newton imaging spectroscopy analysis of the lensing cluster of galaxies CL002417 at . The emission appears approximately symmetric. However, on the scale of some indication of elongation is visible in the northwest-southeast (NW-SE) direction from the hardness ratio map (HRM). Within , we measure a global gas temperature of keV, metallicity of , and bolometric luminosity of erg s-1. We derive a temperature distribution with an isothermal temperature of 3.9 keV to a radius of and a temperature gradient in the outskirts (). Under the assumption of hydrostatic equilibrium, we measure gravitational mass and gas mass fraction to be and at Mpc using the observed temperature profile. The complex structure in the core region is the key to explaining the discrepancy in gravitational mass determined from XMM-Newton X-ray observations and HST optical lensing measurements.
Key Words.:
galaxies: clusters: individual: CL002417 – cosmology: dark matter – cosmology: gravitational lensinge-mail: yyzhang@mpe.mpg.de
1 Introduction


One of the optically most prominent, but also most puzzling distant lensing galaxy clusters, is CL002417 at a redshift of (Gunn & Oke 1975). Its high galaxy density led to the early discovery by Humason & Sandage (1957), and the cluster has since been the subject of many studies. It was one of the first clusters to display the so-called Butcher-Oemler effect (Butcher & Oemler 1978; Dressler & Gunn 1982; Dressler et al. 1985), and Schneider et al. (1986) described it as a very rich optical cluster.
Koo (1988) discovered gravitational arcs in CL002417, and it was subsequently studied extensively (Mellier et al. 1991; Kassiola et al. 1992; Kassiola et al. 1994; Wallington et al. 1995; Colley et al. 1996; Smail et al. 1997; Tyson et al. 1998; Broadhurst et al. 2000; Shapiro & Iliev 2000; Treu et al. 2003; Kneib et al. 2003). A total of eight arc-like lensed images from the same background galaxy were identified (e.g. Tyson et al. 1998). The redshift of the lensed galaxy was determined by Broadhurst et al. (2000) to be . Bonnet et al. (1994) detected a weak shear signal in this cluster out to a radius of Mpc and inferred a high gravitational mass of about 1.4–2.9. Recently Kneib et al. (2003) revised this lensing mass estimate downward on the basis of a very detailed Hubble Space Telescope (HST) mapping of the cluster which yielded a gravitational mass of out to Mpc. In spite of the massive appearance of CL002417 at optical wavelengths, the cluster is relatively faint in X-rays with a ROSAT determined luminosity of erg s-1 in the 0.1–2.4 keV band (Böhringer et al. 2000), an ASCA determined temperature of keV (Soucail et al. 2000), and a Chandra temperature of keV (Ota et al. 2004; to Mpc). In addition to the surprisingly low X-ray luminosity in comparison to its optical prominence, the detailed analysis of the X-ray observations yield a total cluster mass in the range – that is 1.3–3 times lower than the weak lensing determined mass (Soucail et al. 2000; Böhringer et al. 2000; Ota et al. 2004). The discrepancy is even larger at the arc radius Mpc (e.g. Broadhurst et al. 2000).
A hint of the explanation for this mass discrepancy came from the detailed analysis of the galaxy dynamics in CL002417 based on redshifts of galaxy members (Czoske et al. 2001; 2002). Czoske et al. (2001; 2002) found that the line-of-sight velocity distribution is not that of a relaxed cluster and is at least bimodal. They also demonstrated that the redshifts can approximately be explained by a line-of-sight merger of two systems with a mass ratio of the order of 1:2. Also the weak lensing analysis shows a mass distribution with substructure, modeled as a bimodal distribution of two systems with slightly different central positions in the plane of the sky (Kneib et al. 2003). The infrared observations imply significant star forming activity with Star Formation Rates (SFRs) one to two orders of magnitude higher than those computed from the optical. The underestimation of the SFRs in the optical is due to absorption by dust (Coia et al. 2003).
Using the capability of XMM-Newton to perform imaging spectroscopy at high angular resolution and thus allowing us to study the density and temperature structure of the intracluster medium (ICM), we performed an XMM-Newton observation of CL002417 to shed new light on this enigmatic system.
This paper is structured as follows. In Sect. 2, we describe a double background subtraction method, which is developed to provide precise spectral background removal. In Sect. 3, we analyse the properties of the hot gas in the galaxy cluster CL002417, then determine the total mass, projected gravitational mass, and gas mass fraction based on precise temperature and gas density profiles. In Sect. 4, we discuss the structures in the cluster and possible solutions for the discrepancy between the X-ray and HST lensing measurements in the gravitational mass. In Sect. 5, we present our conclusions. We adopt a flat CDM cosmology with density parameter and Hubble constant km s-1 Mpc-1. Thus Mpc. All coordinates are given in epoch J2000. We adopt the solar abundance values of Anders & Grevesse (1989). Error bars correspond to the 68% confidence level, unless explicitly stated otherwise.
2 Method
2.1 Data preparation
CL002417 was observed on Jan 6th, 2001 for a total exposure of 52.1 ks, 52.1 ks and 48.3 ks for MOS1, MOS2 and pn, respectively, by XMM-Newton with the European Photon Imaging Camera (EPIC) in standard Full Frame (FF) mode and Extended Full Frame (EFF) mode for MOS and pn, respectively. For all detectors, the thin filter was used. Data reduction and calibration was carried out using the XMM-Newton Science Analysis System (SAS5.4.1). The central position of the observation is , .
Above 10 keV, there is little X-ray emission from the cluster due to the low telescope efficiency. The particle background therefore completely dominates. The cluster emission is not variable, so any spectral range can be used for temporal variability studies of the background. The 10–12 keV (12–14 keV) energy band (binned in 100 s intervals) was used to monitor the particle background and to excise periods of high particle flux for MOS (pn). In this screening process we use the settings and () for MOS (pn).
We reject those time intervals affected by flares in which the detector countrate (ctr) exceeds a threshold of above the average ctr, where the average and the variance have been iteratively determined from the ctr histogram below the rejection threshold. We screened the data using the thresholds of 21.4, 22.3 and 56.2 for MOS1, MOS2 and pn. The net exposure time is 46.6 ks, 46.0 ks and 42.9 ks for MOS1, MOS2 and pn, respectively.
2.2 Background analysis
We do not expect any cluster emission outside , the virial radius estimated from the redshift (z=0.395; Gunn & Oke 1975) and the Chandra average temperature measurement (4.47 keV, Ota et al. 2004). Thus the cluster emission covers less than half of the field of view (FOV) of the XMM-Newton telescope detectors. Actually the significant cluster emission extends only to in the surface brightness of the XMM-Newton observations. Thus we use the region in detector coordinates to compare the background conditions of the XMM-Newton pointing of the Chandra Deep Field South (CDFS, which we use as background field for the spectral analysis) with that of CL002417. The background of CL002417 is higher than that of the background field (CDFS) by for MOS and for pn on average in the complete energy band, in which the difference is mainly produced in the low energy band below 1 keV.
In the spectral analysis, the regions not affected by cluster emission, enable us to study the residual background in the source observation compared to the background observation. We applied a double background subtraction method as described in Zhang et al. (2004a) using the results of the residual background modeling. In summary the spectral analysis is performed in two steps using the software package XSPEC11.3.0: (i) A power law model for the residual background (background difference) is obtained in XSPEC from a comparison of the outer region (5–5.5′) of the target and background fields (cf. Table 1). (ii) The spectral modeling is performed in XSPEC with the cluster region of the target field as source data, the region in the same detector coordinates in the background field as background and the residual background as a second model component with model parameters fixed to the values found in step (i). The overall spectra were fitted by a “mekal” model (Mewe et al. 1985; Mewe et al. 1986; Kaastra 1992; Liedahl et al. 1995; Arnaud & Rothenflug 1985; Arnaud & Raymond 1992) with Galactic absorption (Dickey & Lockman 1990; ). The results with and without introducing a residual background are consistent within 1 , e.g. the temperature (metallicity) of the region are () and ().
| Instrument | Index | Normalization |
|---|---|---|
| MOS1 | 1.95 | 1.00 |
| MOS2 | 2.21 | 0.64 |
| pn | 1.95 | 2.25 |
In the image analysis for the surface brightness we carry out a vignetting correction for CDFS and CL002417, respectively. We derive the CDFS surface brightness in the same detector coordinates as CL002417 and scale it using the ctr ratio of CL002417 and CDFS in the 10–12 keV (12–14 keV) band for MOS (pn). After subtracting the scaled CDFS as a background from CL002417, we use a constant model to fit the residual soft X-ray background which is quite flat in the outer region ().
For comparison, we also used the blank sky background from Lumb et al. (2002) and found that the parameters change less than 1 for both spectral and surface brightness analyses.
2.3 Point source subtraction
In a preliminary spectral analysis without subtracting the point sources we found contamination in both the soft and hard bands, especially for pn.
Therefore we generated a list of the bright point sources using SAS task “edetect_chain” applied to five energy bands: 0.3–0.5 keV, 0.5–2 keV, 2–4.5 keV, 4.5–7.5 keV, 7.5–12 keV. The sources detected include fourteen of sixteen sources which were found in ROSAT HRI observations (Soucail et al. 2000) except that S14 and S15 are out of the FOV of XMM-Newton. Since we carried out analyses only in the region, only the brightest fourteen point sources within this region (including nine ROSAT HRI sources, S1, S2, S3, S4, S5, S6, S8, S9 and S10 in Soucail et al. 2000) were subtracted from the source events using a radius of , which is comparable to the XMM-Newton Point Spread Function (PSF) cutoff radius of , for each source that encloses nearly 90% of the flux of the point sources in both the spectroscopic and image analyses (cf. Table 2).
| No. | Flux | ||
|---|---|---|---|
| () | |||
| 1 | 00 26 12.8 | 17 03 46.8 | 1.317 |
| 2 | 00 26 30.9 | 17 10 14.9 | 0.933 |
| 3 | 00 27 00.0 | 17 04 22.4 | 0.890 |
| 4 | 00 26 31.0 | 17 16 54.2 | 0.760 |
| 5 | 00 26 20.1 | 17 17 03.1 | 0.677 |
| 6 | 00 27 05.3 | 17 06 40.6 | 0.671 |
| 7 | 00 26 44.2 | 17 02 29.4 | 0.581 |
| 8 | 00 26 26.1 | 17 09 37.3 | 0.558 |
| 9 | 00 27 07.5 | 17 07 48.6 | 0.542 |
| 10 | 00 26 17.2 | 17 03 06.1 | 0.400 |
| 11 | 00 26 45.8 | 17 12 30.5 | 0.391 |
| 12 | 00 26 17.9 | 17 09 45.8 | 0.259 |
| 13 | 00 27 03.7 | 17 07 21.5 | 0.224 |
| 14 | 00 26 42.8 | 17 08 30.9 | 0.060 |
3 Results
3.1 Image analysis
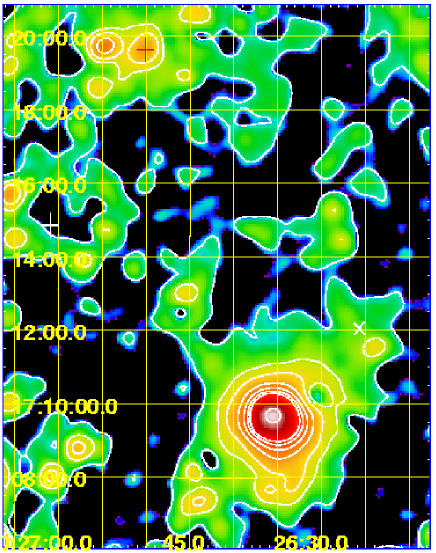
The images in the 0.5–2 keV band for MOS and pn were corrected for vignetting using their weighted exposure maps and were then combined. We created an adaptively-smoothed image from the combined image with a maximum sigma (the width of the smoothing Gaussian) of and a signal-to-noise of 5.0 (see Fig. 1). Superposed XMM-Newton X-ray contours indicate an elongation in the northwest-southeast (NW-SE) direction and substructure in the NW (, , from the center).
We found no sign of the substructure described in Bonnet et al. (1994) which is from the cluster center (, ) to the northeast (NE). However, we observed the substructure, described in Kneib et al. (2003) and Czoske et al. (2001; 2002), located NW from the cluster center covering with a temperature of keV fixing the metallicity to and a bolometric X-ray luminosity of erg s-1, 2% of the total emission of the cluster. We also observed emission from a pair of background groups in the NE which were decribed in Czoske et al. (2002) at based on a wide-field spectroscopic survey. The northern group centered at , is more compact and X-ray luminous ( erg s-1, ). The southern group centered at , is too faint for spectral analysis. If we assume a gas temperature in the range 1–4 keV, then the bolometric luminosity of this group lies in the range 0.076–0.079 erg s-1 ().
3.2 Chandra observation of the center
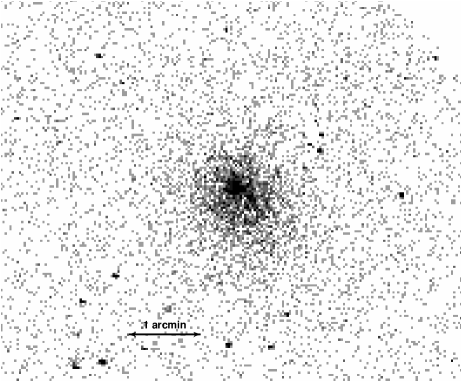
CL002417 was also observed by Chandra (ID: 929). Ota et al. (2004) showed an adaptively smoothed image of the cluster with a rather symmetric appearance.
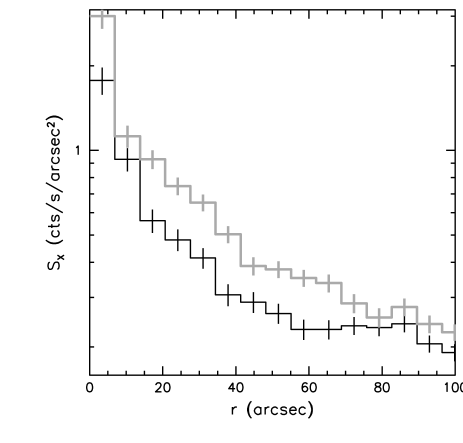
A closer inspection reveals asymmetries, however. Fig. 2 shows an unsmoothed image (0.5–2.5 keV, 2′′ pixels) and surface brightness profiles in annuli using the 0.5–2.5 keV image with azimuths 30∘–120∘ (counter clockwise) from north to east and from south to west, respectively. There is a clear asymmetry between the northeast and southwest. To the northeast, we note a sharp decrease at a radius of about . The profile to the southwest displaying a more gradual decline. In Fig. 6, we show the azimuthally averaged Chandra temperature profile from a more detailed spectral study (kindly provided by Alexey Vikhlinin) fixing the metallicity to . We note a corresponding temperature decrease approximately at the same radius as the surface brightness decline. This complex structure including a possible indication of a “shock front” might provide further support to the cluster merger scenario.
3.3 Optical observations
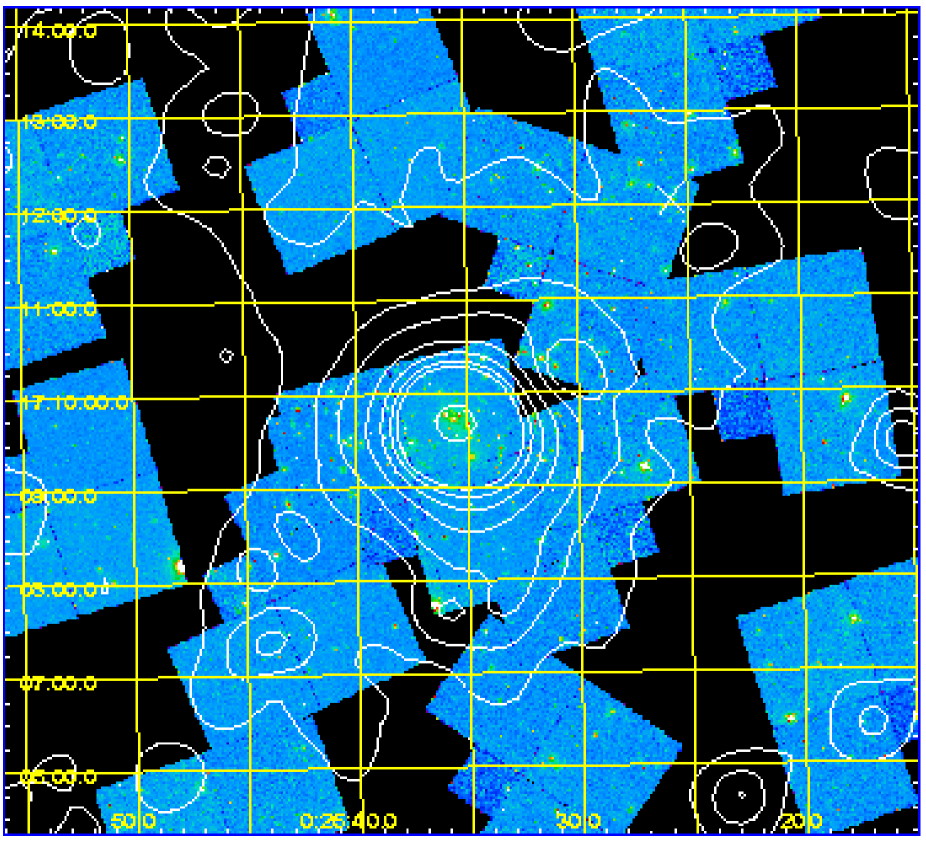
To compare the X-ray morphology with the optical image in the central region of CL002417, we retrieved 15 HST WFPC2 observations including 11 from PI: Ellis (ID: 8559) and 4 from PI: Turner (ID: 5453). They are block 0, 11, 12, 13, 18, 19, 23, 24, 25, 36, 37 and 38 in Treu et al. (2003). All images were taken in the F814W filter (I band). We use the IRAF STSDAS and IMAGES packages to obtain the mosaic image from the calibrated science images.
The X-ray contours of the XMM-Newton observations were plotted on the merged HST image (shown in Fig. 3). We note the overlapping cluster centers and galaxy concentrations in the NW () of the X-ray and optical images.
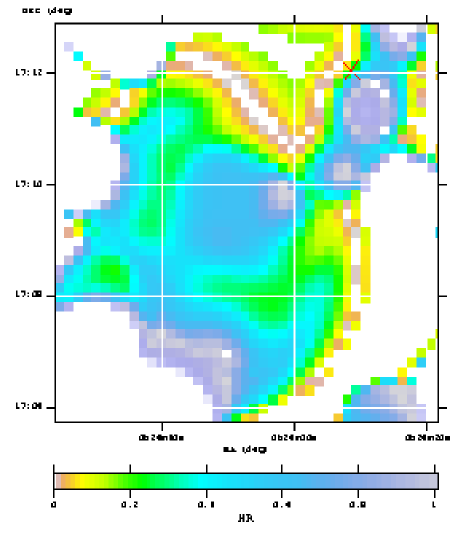
3.4 Hardness ratio maps
To further study the substructure in CL002417 we produced hardness ratio map (HRM) of the cluster, which primarily reflects the temperature distribution. The hardness ratio is the photon flux ratio of the hard band of 2–7.5 keV to the soft band of 0.5–2 keV, (2–7.5 keV)(0.5–2 keV). An indication of an elongation in the NW-SE direction is visible in the HRM (see Fig. 4) on a scale of . The HRM shows a complicated structure with an average of in the central region. The substructure in the NW () has an average of within . We note two peaks: one is at (, ) that is marginally coincident with the NW substructure; the other is close to the center at , .
3.5 Temperature and metallicity profiles
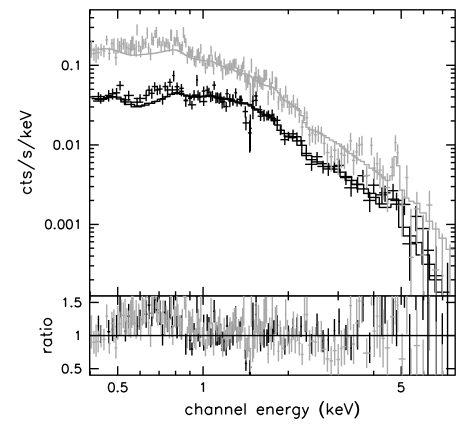
We first derive global X-ray properties of CL002417 from the spectra extracted from the region, covering radii up to a spherical overdensity of , i.e. the ratio of the mean density of the dark halo with respect to the redshift-dependent critical density . We measure an emission weighted temperature of keV, metallicity of and bolometric luminosity of erg s-1 (). We confirm the estimates of 3–4.5 keV and erg s-1 in Böhringer et al. (2000) from the ROSAT observation and a estimate of keV in Soucail et al. (2000) from the ASCA observations. The Chandra observations yield a comparable temperature of keV and a bolometric luminosity of erg s-1 (Ota et al. 2004). The source spectra for and the fitted model are shown in Fig. 5. A lower luminosity of erg s-1 is predicted from the – relation in Arnaud & Evrard (1999) and the XMM-Newton temperature measurement. The high luminosity might indicate the complex cluster center which will be discussed in Sect. 4.
For a more detailed spectral study we divide the cluster region into five annuli: 0–0.4′, 0.4–0.8′, 0.8–1.3′, 1.3–2′, and 2–3′. We investigate the dependence of the temperature and metallicity measurements on the low energy (low-E) cut-off (0.4 keV or 1 keV) as we did in our earlier study (Zhang et al. 2004a) to test the robustness of the spectral data fitting. We find that in the region the derived temperatures increase by 15% if the low-E cut-off is increased from 0.4 keV to 1 keV. With the decreasing signal-noise-ratio (S/N) in the region the derived temperatures increase by up to 40% if the low-E cut-off is increased from 0.4 keV to 1 keV. As in our earlier work (see also Pratt & Arnaud 2002) we attribute this change in the best fit temperature with energy range to the influence of a contaminating soft spectral component. To minimize its effect, we use the higher energy cut-off at 1 keV above which the results are stable.
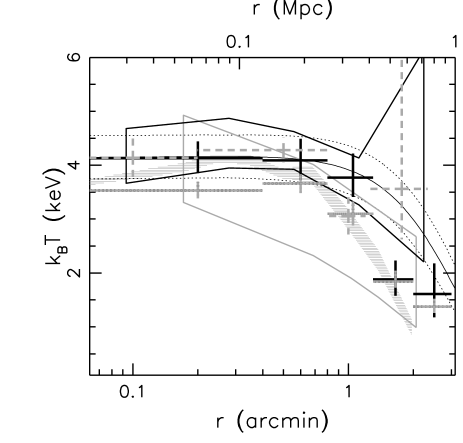
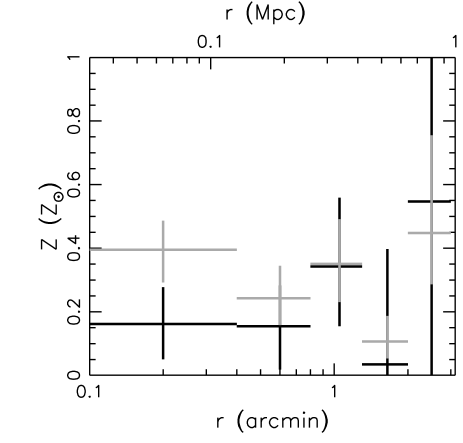
The radial metallicity distribution is very flat which is expected from simulations where merging efficiently flattens the metallicity profile (Kobayashi 2003). The deprojection correction does not provide a significant change in the results. In the () region the temperature measurements vary by a factor of 5% (50%), which is approximately within the error bars. The temperature and metallicity profiles determined from the spectra in the 5 annuli ( from the inner to the outer annulus) are shown in Fig. 6. A variation of the temperature with radius is found here for the first time for CL002417. The inner three bins covering the radial range to a radius of ( kpc) are consistent with an isothermal profile. This agrees with the Chandra results by Ota et al. (2004) who found an isothermal temperature profile to an outer radius of ( kpc). The form of the temperature profile is very similar to the profile we obtained for the sample of REFLEX-DXL (ROSAT-ESO Flux-Limited X-ray cluster survey, Distant X-ray Luminous) clusters (Zhang et al. 2004b). We scaled the temperature profile in Markevitch et al. (1998) to CL002417 using a radius of Mpc (obtained in Sect. 3.9) and an emission weighted global temperature of 3.52 keV. We find good overall agreement as found for the REFLEX-DXL clusters except that the flat part of the temperature profile extends to a larger radius than the average profile of Markevitch et al. (1998). We also scaled the temperature profile for Sersic 15903 in Kaastra et al. (2001) to CL002417, and found a similarly rapid temperature drop as a function of radius as CL002417.
We found an isothermal temperature of keV to a radius of ( kpc) and a power law model with an index outside this radius. We approximate the temperature profile with two analytical models: (a) an isothermal model using the global temperature of keV; (b) a function with the shape of a Gaussian of (see Table 5) which approximately fits the observed temperature profile.
3.6 Surface brightness
We obtained an azimuthally averaged surface brightness profile for CL002417 in the 0.5–2 keV band for each instrument, in which the central position is , . This energy band is selected because it provides an almost temperature-independent X-ray emission coefficient over the expected temperature range. After the vignetting correction and double-step background subtraction described above, we find that a -model (e.g. Cavaliere & Fusco-Femiano 1976; Jones & Forman 1984)
| (1) |
convolved with the XMM-Newton PSF provides an adequate fit to the surface brightness profile (Fig. 7). A PSF at each position for each instrument is determined from an empirical calibration (Ghizzardi 2001) according to a mean energy keV of the 0.5–2 keV band and its off-axis radius.
We compare the PSF convolved and unconvolved -model parameters in Table 3, and find that the core radii are overestimated and the slope parameters are underestimated in the latter case. The combined 90% confidence contours (see Fig. 8) of the three instruments provide a narrow range for and (; ) at the 90% confidence level. Böhringer et al. (2000) obtained – and – from the ROSAT HRI data corrected for PSF. Ota et al. (2004) obtained and from the Chandra observations. Our result confirms the results from previous X-ray observations with a higher accuracy because of the improvement of the image quality of XMM-Newton compared to previous observations.
The surface brightness profile approximated by a -model can be analytically deprojected to yield the emission per volume element, . With the given emissivity, , from the applied plasma model, one can derive the electron density profile with the parameters given in Table 3 combining the three detectors. We studied the influence of the central emission in the beta model analysis and found that the parameters like and change within 2% if the central bins are masked.
| PSF | |||||
|---|---|---|---|---|---|
| MOS1 | Y | ||||
| N | |||||
| MOS2 | Y | ||||
| N | |||||
| pn | Y | ||||
| N |
We obtain the pressure distribution as a function of radius directly from the temperature and electron density measurements. Thus a -model is applied to fit the pressure with results shown in Table 5.
Furthermore, we simulated a symmetric, background subtracted and flat fielded image using the parameters of the -model in Table 3. The residual map, which contains the background, is obtained by extracting the simulated image from the adaptively-smoothed image. We confirm the existence of excess emission in the substructure in the NW, while the negative residual surface brightness in the cluster center shows that the elongation flattens the surface brightness compared to a symmetric structure.
To further test if the cluster mass profile can be described by a NFW profile (Navarro et al. 1997; NFW), we fit the observed surface brightness profile by the model computed from the NFW model described dark matter halo (e.g. Makino et al. 1998). A model that fits the data well over a large range of radii shows an inner cusp in the surface brightness. The central surface brightness model at the given resolution is about a factor of two to three higher and thus inconsistent with our observations. Since we detect signatures of a cluster merger in the central region. We are not surprised to find deviations from the NFW model. Also Tyson et al. (1998) found a core in the mass profile in their lensing analysis.
3.7 Cooling time of the gas
The cooling time is the total energy of the gas divided by the energy loss rate (e.g. Zhang & Wu 2003)
| (2) |
where and are the electron number density and temperature, respectively, and is the Gaunt factor (a function of ). The resulting cooling time as a function of radius is shown in Fig. 9. The central cooling time of 4.5 Gyr is smaller than the age of the Universe and probably smaller than the age of the cluster if we assume that the age of the cluster mass concentraion is longer than two crossing time because the merger frequency is expected to be a few Gyr (e.g. Schuecker et al. 2001). An even smaller central cooling time is implied by the Chandra data (Ota et al. 2004) due to the higher angular resolution of the central region. The data thus correspond, in the classical interpretation, to a small or moderate cooling flow (Fabian & Nulsen 1977).
3.8 Gas entropy
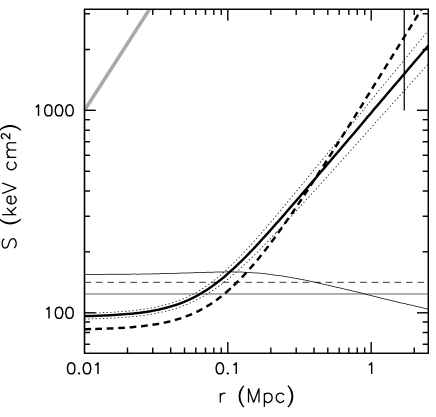
The main part of the observed entropy, defined as (e.g. Ponman et al. 1999), results from shock heating of the gas during cluster formation and it scales with the cluster critical temperature. An excess above this scaling law indicates the effect of an additional, non-gravitational heating source (e.g. Lloyd-Davies et al. 2000). While a low central entropy indicates significant radiative cooling. We show the entropy profile derived for CL002417 from the XMM-Newton observations in Fig. 10.
The entropy of the Mpc region derived from temperature measurements of CL002417 has a similar slope as that predicted from a spherical accretion shock model, (Kay 2004; thick grey line in Fig. 10). The entropy under the assumption of isothermality becomes steeper than the entropy derived from temperature measurements, especially in the outer region.
The entropy of the gas in the center ( Mpc) lies below the entropy floor, , derived for clusters by Lloyd-Davies et al. (2000). This indicates some effect from radiative cooling.
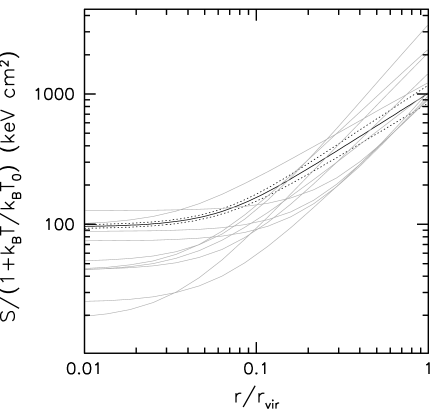
We scale the entropy of CL002417 by , where keV is a constant related to the degree of preheating. In Fig. 10, we compare it to the entropy of the Birmingham-CfA clusters in the temperature range of 2.9–4.6 keV (Ponman et al. 2003) scaled also by . The entropy of CL002417 agrees with the self-similarly scaled entropy described by Ponman et al. (2003) within the observed dispersion of their cluster sample.
Eq.(2) can be rewritten as
| (3) |
If the cooling time is chosen approximately to be the age of the Universe, the above equation would allow us to determine the critical entropy floor of the gas in the cluster before the onset of significant cooling and possible mass deposition. In the center of CL002417 the observed entropy is slightly below this value ( 154 keV cm2) which implies a insignificant radiative cooling.
3.9 Mass modeling
We assume the intracluster gas to be in hydrostatic equilibrium within the gravitational potential dominated by dark matter. Neglecting the cosmological constant, , at these high overdensities (a less than 1% effect, see Zhang et al. 2004a), we have
| (4) |
where is the mean molecular weight per hydrogen atom.
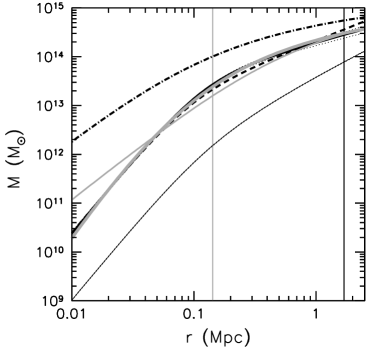
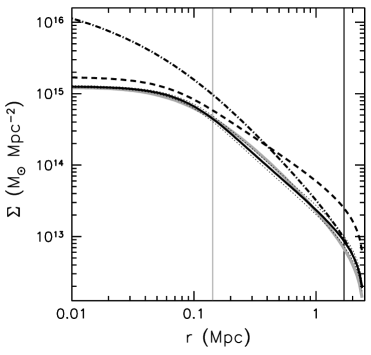
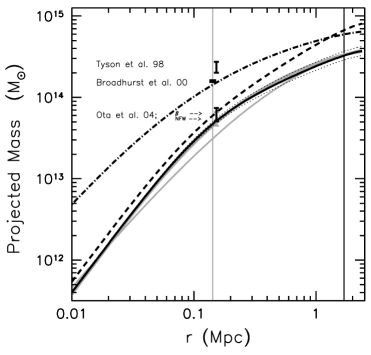
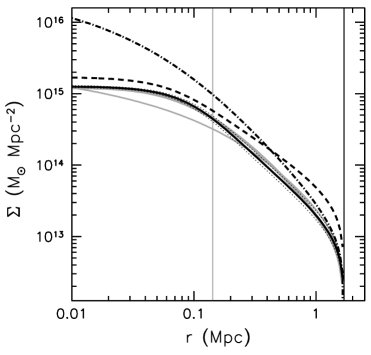
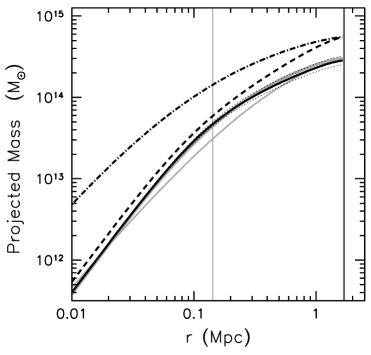
Analytic models of the gas density and pressure profiles derived above can be easily combined with Eq.(4) to obtain the mass profile (Fig. 11). The virial radius (not ) is defined to be a radius with overdensity (the average density with respect to at the cosmic epoch ) of for a flat universe. is the cosmic density parameter (e.g. Zhang & Wu 2003). Therefore the mass profiles in Fig. 11 combined with the expression for the overdensity yield Mpc using the global temperature and Mpc using the observed temperature distribution.
We compare the XMM-Newton results with the recent measurements from Chandra and HST in Table 4 and Fig. 11. The XMM-Newton measurements using the measured temperature profile are slightly lower than Chandra values derived under the assumption of isothermality. As shown in Table 4 and Fig. 11, the discrepancy between the X-ray measured total mass and strong lensing mass at the radii of Mpc (Broadhurst et al. 2000) and Mpc (Tyson et al. 1998) remains large, about a factor of 4.
| Observation | XMM-Newton a | Chandra b | HST | |||
|---|---|---|---|---|---|---|
| ( Mpc) | 1.11 | 1.05 | 1.4 | 1.7 | c | |
| () | c | |||||
| () | — | d | ||||
| () | e | |||||
| () | — | |||||
| () | — | c | ||||
a XMM-Newton results using
the global temperature and using the observed temperature profile in which
projected masses use the truncation radius of Mpc;
b Ota et al. (2004); c Kneib et al. (2003);
d Broadhurst et al. (2000); e Tyson et al. (1998).
Under the assumption of isothermality, the XMM-Newton measurements are more consistent with the observationally determined – relation,
| (5) |
which is based on the conventional model for the X-ray surface brightness profile and hydrostatic equilibrium for 22 nearby clusters from Xu et al. (2001). For CL002417, Eq.(5) provides using the X-ray temperature. The masses obtained from the X-ray temperature measurement via the – relations in Finoguenov et al. (2001) and in Bryan & Norman (1998) are and in which the former is more consistent with the HST optical lensing estimate.
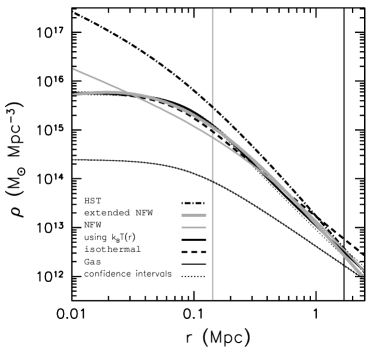
Navarro et al. (1997; NFW) describe a universal density profile from numerical simulations in hierarchical clustering scenarios
| (6) |
where and are the characteristic density and scale of the halo, respectively, is the critical density of the Universe at the cosmic epoch and . is related to the concentration parameter of a dark halo by
| (7) |
We fit the X-ray determined mass profile with a NFW model, and found that the NFW model does not provide a good fit to our data in the Mpc region (Fig. 11). However the NFW model fit provides a virial radius of Mpc which is consistent with the virial radii of Mpc and Mpc derived from the mass profiles using the global temperature and using the observed temperature distribution, respectively, in Fig. 11 combined with the expression for the overdensity. We derive a radius of Mpc from the empirical relation Mpc (Navarro et al. 1995), which is slightly lower than Mpc using the global temperature and Mpc using the observed temperature distribution.
Furthermore, we apply an extended NFW model (e.g. Hernquist 1990; Zhao 1996; Moore et al. 1999),
| (8) |
to fit the data (Table 5) which provides a negative index. This indicates that the dark matter density has a flat core for CL002417.
| Model | parameter | |
|---|---|---|
| Gaussian | (keV) | |
| (Mpc) | ||
| (Mpc) | ||
| () | ||
| (Mpc) | ||
| NFW | (Mpc) | |
| () | ||
| c | ||
| extended NFW | (Mpc) | |
| () | ||
We also present a comparison of the projected mass density and projected mass using the truncation radius of either Mpc, predicted from the lensing data in Kneib et al.(2003) or a larger radius of Mpc (Fig. 11). The discrepancy is larger between the X-ray and strong lensing measurements than between the X-ray and weak lensing measurements.
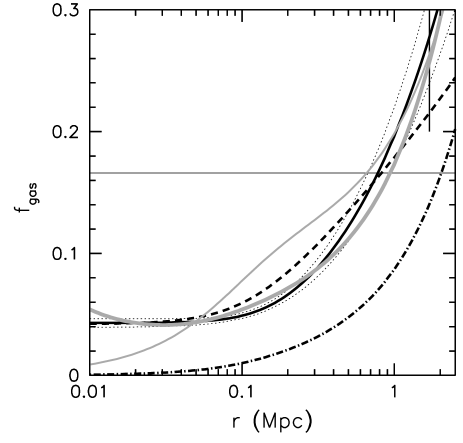
3.10 Gas mass fraction
The gas mass fraction distribution according to the definition is shown in Fig. 12. We found at Mpc using the global temperature and at Mpc using the observed temperature profile, respectively. This result is comparable with the Chandra results at Mpc (Ota et al. 2004), and agrees with the WMAP measured baryon fraction of the Universe , where and (Spergel et al. 2003). We obtain a gas mass fraction of using the global temperature at Mpc and using the observed temperature profile at Mpc, which agrees with the measurements of Allen et al. (2002) based on Chandra observations of seven clusters yielding –. However, this gas mass fraction at is slightly higher than the measurements of Sanderson et al. (2003) based on ASCA/GIS, ASCA/SIS and ROSAT/PSPC observations of 66 clusters yielding , the measurements of Ettori et al. (2002) based on BeppoSAX observations of 22 nearby clusters, and the gas mass fraction for A1413 (Pratt & Arnaud 2002) at based on XMM-Newton observations yielding .
The global parameters based on the XMM-Newton observations for CL002417 are given in Table 6.
| Parameter | Value | |
|---|---|---|
| (keV) | ||
| () | ||
| ( erg s-1) | ||
| ( Mpc) | 1.11 | 1.05 |
| () | ||
| () | ||
4 Discussion
4.1 Metallicity
We measure a global metallicity of Z⊙ which is typical for a cluster with an insignificant cooling flow (Fabian & Nulsen 1977). This metallicity value is in good agreement with the averaged metallicity Z⊙ for 18 distant clusters with redshift in Tozzi et al. (2003). However, Ota et al. (2004) obtain a much higher metallicity of 0.61–0.95 Z⊙. We use the images in the 5–6 keV and 6–7 keV bands as indicators of the iron K line and continuum emission, respectively, and obtain an iron to continuum map. We extracted the spectra from a suggested high metallicity region in the iron-to-continuum map at , covering a radius of . No significant high metallicity was obtained by either setting a free temperature ( keV) or setting the temperature to the emission weighted temperature (4.09 keV) of the zone covering radii of . For the same radius of as used by Ota et al. (2004), we measure a metallicity of and a temperature of keV (see Table 7) using the XMM-Newton data. Therefore the XMM-Newton data with higher significance provide no explanation for the high metallicity value obtained by Ota et al. (2004). The difference between XMM-Newton and Chandra metallicity measurements is an about 2 sigma effect, and may be due to the limited photon statistics in the Chandra data.
4.2 Temperature gradient
We derive an isothermal temperature of keV to a radius of ( kpc) and a power law model with an index of outside this radius. The XMM-Newton temperature in the center is in good agreement with the Chandra measurement which extends to 1.5′ in the Chandra observation of CL002417, covering the almost isothermal center () in the XMM-Newton observations. We provide a more extended temperature profile based on the XMM-Newton observations in which the temperature profile decreases in the 1.3–3′ region. The strong temperature gradient at large radii makes the gravitational mass lower by a factor of 20–25% compared to the isothermal results. We found that the temperature gradient is not a sudden drop at a radius of 1.3′ by measuring the temperature in different bin sizes (see Table 7).
| Region | (keV) | () | |
|---|---|---|---|
Within a radius of for CL002417, we derived a polytropic index of 1.17 for the ICM in the outskirts which is lower than the adiabatic index of 5/3. This implies that the outskirts are still convectively stable. We consider the uncertainty in the mass estimate caused by the temperature gradient by artificially increasing the slope parameter of the temperature distribution by a factor of 20%, and find a decrease of the total mass by a factor of 10%.
Since the soft band (0.5–2 keV) is not so sensitive to the temperature map as the hard band (2–7.5 keV), the HRM can be used as an indicator of the temperature distribution. Therefore the temperature map can be obtained from the HRM (e.g. Sanders & Fabian 2001; Sanders et al. 2003; Akimoto et al. 2003). The is also a reflection of absorption measure which affects the temperature (e.g. Akimoto et al. 2003). Thus we study the further properties of the features in the HRM by performing a spectral analysis. For the statistic reason, we extracted the spectra from one of the peaks suggesting high temperature in the HRM at , covering a radius of , and obtained a temperature of keV with metallcity fixed at 0.3 and keV with the metallicity free (, erg s-1). This supports the indication in the HRM of a high temperature region and not an artifact due to metallicity variations. However, the spectra can also be fitted by a power law with an index of , which could then be attributed to some contamination from an AGN. This hot region is located exactly at the position of the substructure described in Czoske et al. (2001; 2002).
4.3 Complex structure
The Chandra image of the cluster core displays an indication of complex structure. The projection of the counts as a function of radius using the high spatial resulotion image from Chandra shows an asymmetric structure and a surface brightness “edge” in the central region. The galaxy alignment in the HST image is perpendicular to the “edge”. Such an asymmetric central structure with an “edge” () in the XMM-Newton HRM support the idea of a cluster merger.
4.4 Comparison to lensing measurements
The strongest disagreement between the X-ray mass profiles and the strong lensing results is found in the cluster center. The difference between the X-ray determined mass (Table 4) and the strong lensing mass of at the arc radius of Mpc (Broadhurst et al. 2000) and at the arc radius of Mpc (Tyson et al. 1998) is up to a factor of .
This discrepancy is most probably due to the disturbed structure of the cluster center, highlighted by the elongated X-ray iso-surface-brightness contours in the central region. The substructure found in the gravitational lensing mass distribution map by Kneib et al. (2003) is also supported by the X-ray image. The velocity distribution of the galaxies can approximately be explained by a line-of-sight merger of two systems with a mass ratio of the order of 1:2 (Czoske et al. 2001; 2002). Therefore, the application of hydrostatic equilibrium to determine the mass in the central region of the cluster from the gas properties may not be valid.
We observed an elongation in the NW-SE direction in the HRM. The negative residual surface brightness in the cluster center demonstrates that the elongation flattens the surface brightness compared to an azimuthally symmetric structure. The XMM-Newton image analysis shows substructure to the NW of the cluster center which is marked by a galaxy (see Fig. 3) in Kneib et al. (2003). This galaxy shows significantly extended X-ray emission compared to the XMM-Newton PSF and has a luminosity of erg s-1 and a temperature of keV within 1′ at , . Since this high surface brightness region does not have a lower temperature but probably rather has a higher temperature than its surroundings, it does not mark a “cold front” but a high pressure region which coincident with a mass concentration seen in the lensing map. This implies that the second mass peak is included within the gaseous halo of the cluster and not only seen projected onto the cluster.
4.5 Comparison to velocity dispersion measurement
The – relation from simulations in Evrard & Gioia (2002) gives a comparable velocity dispersion of km s-1 from the HST mass and a relatively low value of the velocity dispersion of km s-1 using the XMM-Newton mass. Girardi & Mezzetti (2001) obtained a galaxy velocity dispersion of km s-1 for CL002417. The velocity dispersion derived from the XMM-Newton mass is in good agreement with the velocity dispersion measure in Czoske et al. (2002) who found velocity dispersions of and for the central component and foreground component which suggests a line-of-sight merger. If there is a line-of-sight merger, there are almost certainly additional galaxies in the line-of-sight which artificially increase the optical galaxy velocity dispersion if only one component is assumed.
4.6 X-ray properties
The mass estimates from the – relation in Finoguenov et al. (2001) and in Bryan & Norman (1998) are and , which indicate a higher gravitational mass. We measure a bolometric X-ray luminosity of erg s-1, which is higher than the luminosity of erg s-1 obtained from the – relation in Arnaud & Evrard (1999) which might indicate a merger. The gas mass fraction at for CL002417 agrees with the measurements of Allen et al. (2002) and Pratt & Arnaud (2002). The XMM-Newton measured gas mass fraction of at for CL002417 is higher than the values in Sanderson et al. (2003), Ettori et al. (2002) and Pratt & Arnaud (2002) for their cluster samples, which is possibly an indication for an underestimated mass beyond as already noted from the – relation. Thus we suggest that the merger leads to distortions on global scales which reduces the mass for CL002417. However, on global scales the effect is smaller than in the cluster center. The relatively small distortion (less than a factor of 2) was found in several simulations (e.g. Evrard et al. 1996; Schindler 1996).
4.7 Central cooling
CL002417 has a bright central galaxy and a compact lensing core. The entropy in the center is a little below the entropy floor value suggested by Lloyd-Davies et al. (2000). However, the cluster almost shows little evidence for a cooling flow or a central temperature decrease which should be found in most cooling flow clusters. This supports the scenario that the cluster center has been disturbed by a recent merger.
5 Summary and Conclusions
We performed a detailed imaging and spectroscopic study of the XMM-Newton observations of the lensing cluster CL002417, and obtained spatially resolved temperature, metallicity and density distributions. A temperature gradient was observed for the first time in CL002417 at large radii ().
The image shows overlapping mass concentrations in the XMM-Newton X-ray data and HST optical data. The substructure which was observed by HST in Kneib et al. (2003) is confirmed in the X-ray data. The HRM shows an elongation in the NW-SE direction on a scale of . Further spectroscopy confirms the temperature map suggesting high temperature region with keV. Similar to Sersic 15903, the observed temperature distribution shows a temperature gradient at . The modeling of the temperature distribution yields a polytropic index of 1.17, lower than the adiabatic index of , which indicates a convectively stable state in the outskirts of CL002417.
The cluster does not show a pronounced cooling flow in spite of a dominant central galaxy. Therefore we suggest that a merger in the cluster center ( Mpc) has disrupted any previous cooling flow.
The mass estimate based on the precise measurements of the distributions of the temperature and gas density is lower by a factor of 20–25% than the mass obtained under the assumption of isothermality in the outskirts. The NFW model does not fit the X-ray derived mass profile very well in the center ( Mpc). The extended NFW model fits the data but yields a negative index . We attribute this to the disturbance of the core.
The discrepancy remains between the X-ray gravitational mass and optical strong lensing mass at the radii of Mpc (Broadhurst et al. 2000) and Mpc (Tyson et al. 1998) by a factor of up to 4. The XMM-Newton results are marginally consistent within using the global temperature with the weak lensing measurement in Kneib et al. (2003). CL002417 is an example of a cluster for which weak lensing masses and X-ray masses are in acceptable agreement at large radii but for which the strong lensing masses disagree with the X-ray derived values at small radii (also e.g. A1689, Xue & Wu 2002; Dye et al. 2001; Clowe & Schneider).
The XMM-Newton measured parameters for CL002417 deviate slightly from the empirical – and – relations. CL002417 has a bright central galaxy and a compact lensing core but does not show a significant cooling flow. Similar to A2218 (Girardi et al. 1997; Pratt et al. 2004), the apparent discrepancy between the X-ray and gravitational lensing determined mass of CL002417 is most probably due to a line-of-sight merger of two almost comparable subsystems. In addition, filamentary structures could also contribute to the projected mass detected by lensing, but since this mass does not lie within the cluster core, it would not be included in the X-ray mass measurement. The line-of-sight orientation makes it difficult to reveal the merger structure in the X-ray data, but on the other hand it enhances the probability of finding strong lensing features. Thus, the application of hydrostatic equilibrium assumption might break down in the central region. On global scales the agreement becomes better. The galaxy distribution, lensing mass maps, and X-ray data all provide a consistent description of the cluster morphology.
Acknowledgements.
The XMM-Newton project is supported by the Bundesministerium für Bildung und Forschung, Deutschen Zentrum für Luft und Raumfahrt (BMBF/DLR), the Max-Planck Society and the Haidenhaim-Stiftung. We acknowledge Jacqueline Bergeron, PI of the XMM-Newton observation of the CDFS. YYZ acknowledges receiving the International Max-Planck Research School Fellowship. W. Forman acknowledges support from NASA Grant NAG5-9942 and the Smithsonian Institution. YYZ thanks Alexey Vikhlinin, Gabriel Pratt, Kyoko Matsushita, Maxim Markevitch, Keith Arnaud, Xiang-Zhong Zheng, Yas Hashimoto, Takaya Ohashi and Tae Furusho for useful discussions.References
- (1) Akimoto, F., Kondou, K., Furuzawa, A., Tawara, Y., & Yamashita, K., 2003, ApJ, 596, 170
- (2) Allen, S. W., Schmidt, R. W., & Fabian, A. C. 2002, MNRAS, 334, L11
- (3) Anders, E., & Grevesse, N., 1989, Geochimica et Cosmochimica Acta, 53, 197
- (4) Arnaud, M., & Evrard, A. E., 1999, MNRAS, 305, 631
- (5) Arnaud, M., & Rothenflug, M., 1985, A&AS, 60, 425
- (6) Arnaud, M., & Raymond, J., 1992, ApJ, 398, 394
- (7) Böhringer, H., Soucail, G., Mellier, Y., Ikebe, Y., & Schuecker, P., 2000, A&A, 353, 124
- (8) Bonnet, H., Mellier, Y., & Fort, B., 1994, ApJ, 427, L83
- (9) Broadhurst, T., Huang, X., Frye, B., & Ellis, R., 2000, ApJ, 534, L15
- (10) Bryan, G. L., & Norman, M. L. 1998, ApJ, 495, 80
- (11) Butcher, H., & Oemler, A., 1978, ApJ, 219, 18
- (12) Cavaliere, A., & Fusco-Femiano, R., 1976, A&A, 49, 137
- (13) Clowe, D., & Schneider, P., 2001, A&A, 379, 384
- (14) Coia, D., McBreen, B., Metcalfe, et al., 2003, A&A, submitted, astro-ph/0310317
- (15) Colley, W. N., Tyson, J. A., & Turner, E. L., 1996, ApJ, 461, L83
- (16) Cooray, A. R., Holder, G. P., & Quashnock, J. M., 1999, MNRAS, 305, L11
- (17) Czoske, O., Kneib, J.-P., Soucail, G., et al., 2001, A&A, 372, 391
- (18) Czoske, O., Moore, B., Kneib, J.-P., & Soucail, G., 2002, A&A, 386, 31
- (19) Dickey, J. M., & Lockman, F. J., 1990, ARA&A, 28, 215
- (20) Dressler, A., & Gunn, J. E., 1982, ApJ, 263, 533
- (21) Dressler, A., & Gunn, J. E., & Schneider, D. P., 1985, ApJ, 294, 70
- (22) Dye, S., Taylor, A. N., Thommes, E. M., et al., 2001, MNRAS, 321, 685
- (23) Evrard, A. E., & Gioia, I. M., 2002, Merging Processes in Galaxy Clusters, ed. L. Feretti, I.M. Gioia, G. Giovannini, Astrophysics and Space Science Library, Vol. 272, 253
- (24) Evrard, A. E., Metzler, C. A., & Navarro, J. F., 1996, ApJ, 469, 494
- (25) Ettori, S., De Grandi, S., & Molendi, S. 2002, A&A, 391, 841
- (26) Fabian, A. C., & Nulsen, P. E. J., 1977, MNRAS, 180, 479
- (27) Finoguenov, A., Reiprich, Th., & Böhringer, H., 2001, A&A, 368, 749
- (28) Ghizzardi, S. 2001, In-flight calibration of the PSF for the MOS1 and MOS2 cameras, EPIC-MCT-TN-011 (Internal report)
- (29) Girardi, M., Fadda, D., Escalera, E., et al., 1997, ApJ, 490, 56
- (30) Girardi, M., & Mezzetti, M., 2001, ApJ, 548, 79
- (31) Gunn, J. E., & Oke, J. B., 1975, ApJ, 195, 255
- (32) Hernquist, L., 1990, ApJ, 356, 359
- (33) Humason, M. L., & Sandage, A., 1957, in Carnegie Yearbook 1956 (Carnegie Institution of Washington), p61
- (34) Jones, C., & Forman, W., 1984, ApJ, 276, 38
- (35) Kaastra, J. S., 1992, An X-Ray Spectral Code for Optically Thin Plasmas (Internal SRON-Leiden Report, updated version 2.0)
- (36) Kaastra J. S., Ferrigno, C., Tamura, T., et al., 2001, A&A, 365, L99
- (37) Kassiola, A., Kovner, I., & Fort, B., 1992, ApJ, 400, 41
- (38) Kassiola, A., Kovner, I., Fort, B., & Mellier, Y., 1994, ApJ, 429, L9
- (39) Kay, S. T., 2004, MNRAS, 347, L13
- (40) Kobayashi, C., 2004, MNRAS, 347, 740
- (41) Kneib, J.-P., Hudelot, P., Ellis, R. S., et al., 2003, ApJ, 598, 804
- (42) Koo, D. C., 1988, in Large-Scale Motions in the Universe, Rubin, V. G., Gayne, G. V., (eds.), Princeton Univ. Press, p. 513
- (43) Liedahl, D. A., Osterheld, A. L., & Goldstein, W. H., 1995, ApJ, 438, L115
- (44) Lloyd-Davies, E. J.,Ponman, T. J., & Cannon, D. B., 2000, MNRAS, 315, 689
- (45) Lumb, D. H., Warwick, R. S., Page, M., & De Luca, A., 2002, A&A, 389, 93
- (46) Makino, N., Sasaki, S., & Suto, Y., 1998, ApJ, 497, 555
- (47) Markevitch, M., 1998, ApJ, 504, 27
- (48) Markevitch, M., Forman, W. R., Sarazin, C. L., & Vikhlinin, A. 1998, ApJ, 503, 77
- (49) Mellier, Y., Fort, B., Soucail, G., Mathez, G., & Cailloux, M., 1991, ApJ, 380, 334
- (50) Mewe, R., Gronenschild, E. H. B. M., & van den Oord, G. H. J., 1985, A&AS, 62, 197
- (51) Mewe, R., Lemen, J. R., & van den Oord, G. H. J., 1986, A&AS, 65, 511
- (52) Moore, B., Quinn, T., Governato, F., Stadel, J., & Lake, G., 1999, MNRAS, 310, 1147
- (53) Navarro, J. F., Frenk, C. S., & White, S. D. M., 1997, ApJ, 490, 493 (NFW)
- (54) Navarro, J. F., Frenk, C. S., & White, S. D. M., 1995, MNRAS, 275, 720
- (55) Ota, N., Pointecouteau, E., Hattori, M., & Mitsuda, K., 2004, ApJ, 601, 120
- (56) Ponman, T. J., Cannon, D. B., & Navarro, J. F., 1999, Natur, 397, 135
- (57) Ponman, T. J., Sanderson, A. J. R., & Finoguenov, A., 2003, MNRAS, 343, 331
- (58) Pratt, G. W., & Arnaud, M. 2002, A&A, 394, 375
- (59) Pratt, G. W., Boehringer, H., & Finoguenov, A., 2004, A&A, submitted
- (60) Sanders, J. S., & Fabian, A. C., 2001, MNRAS, 325, 178
- (61) Sanders, J. S., Fabian, A. C., Allen, S. W., & Schmidt, R. W., 2004, MNRAS, 349, 952
- (62) Sanderson, A. J. R., Ponman, T. J., Finoguenov, A., Lloyd-Davies, E. J., & Markevitch, M., 2003, MNRAS, 340, 989
- (63) Schneider, D. P., Dressler, A., & Gunn, J. E., 1986, AJ, 92, 523
- (64) Schindler, S., 1996, A&A, 305, 756
- (65) Schuecker, P., Böhringer, H., Reiprich, Th., & Feretti, L., 2001, A&A, 378, 408
- (66) Shapiro, P. R., & Iliev, I. T., 2000, ApJ, 542, L1
- (67) Smail, I., Ellis, R. S., Dressler, A., et al., 1997, ApJ, 479, 70
- (68) Soucail, G., Ota, N., Böhringer, H., Czoske, O., & Mellier, Y., 2000, A&A, 355, 433
- (69) Spergel, D. N., Verde, L., Peiris, H. V., et al., 2003, ApJS, 148, 175
- (70) Tozzi, P., Rosati, P., Ettori, S., Borgani, S., Mainieri, V., & Norman, C., 2003, ApJ, 593, 705
- (71) Treu, T., Ellis, R.S., Kneib, J.-P., et al., 2003, ApJ, 591, 53
- (72) Tyson, J. A., Kochanski, G. P., & Dell’Antonio, I. P., 1998, ApJ, 498, L107
- (73) Wallington, S., Kochanek, C. S., & Koo, D. C., 1995, ApJ, 441, 58
- (74) Xu, H.-G., Jin, G.-X., & Wu, X.-P., 2001, ApJ, 553, 78
- (75) Xue, S.-J., & Wu, X.-P., 2002, ApJ, 576, 152
- (76) Zhao, H.-S., 1996, MNRAS, 278, 488
- (77) Zhang, Y.-Y., Finoguenov, A., Boehringer, H., et al. 2004a, A&A, 413, 49
- (78) Zhang, Y.-Y., Finoguenov, A., Boehringer, H., et al. 2004b, Proceeding, “Memorie della Societb Astronomica Italiana - Supplementi”, in press, astro-ph/0402533
- (79) Zhang, Y.-Y., & Wu, X.-P., 2003, ApJ, 583, 529