The spectrum features of UHECRs below and surrounding GZK
Abstract
The energy spectrum of ultra-high energy cosmic rays (UHECRs) is discussed on the basis of the Yakutsk array database analysis. In the region to eV the showers are detected under trigger-500, while at energies above eV the whole acceptance area for trigger-1000 is used in order to utilize all the data available in the region of Greisen-Zatsepin-Kuzmin (GZK) cutoff. Updated relations are adapted to estimate the primary energy having detected densities of charged particles at the distance 300/600 m from the shower axis.
1 Introduction
The primary energy estimation method is one of the clue features to deal with using extensive air shower (EAS) technique of ultra-high energy cosmic ray measurements. In this paper we discuss the present status of algorithms used to assign the primary energy to showers detected with the Yakutsk array. Special attention is paid to the total flux measurement of the Cherenkov light on the ground which is the basis of the model-independent approach to the energy evaluation of EAS original particle. The uncertainty limits of the energy estimation method are analyzed.
Resulting energy spectrum of cosmic rays in the region surrounding GZK energy eV has the form consistent with the prediction of Greisen [1] and Zatsepin and Kuzmin [2]. One more EAS event at energy above eV has been detected with the Yakutsk array 18 February 2004. An updated lateral distribution function (LDF) of charged particles was used in data analysis which leads to increased parameter in average. As the result we have 3 showers of energy greater than eV detected in Yakutsk to present day.
2 Data acquisition and analysis
Actually, the Yakutsk array has two kinds of triggers to select the showers from the background: produced by Cherenkov light detectors and by the scintillators. We will describe here the latter one; in the case of coincident signal (particle density ) in two scintillators of each station within 2 microseconds the signal passes on to the central controller. Trigger-500 is then produced in the case of coincident signal (in 40 s) from three or more stations at m spacing. Similarly, trigger-1000 is produced by kilometer spacing stations. After 1992 when 18 new stations were added, the array area is increased from to where trigger-500 operates. That is why we can deal with the spectrum in the energy range from eV to eV using the same trigger.
In our previous analysis the lateral distribution of charged particles was approximated by Greisen’s formula [3]:
| (1) |
where ;
here we use another approximation given earlier [10]:
| (2) |
where parameter has the value given in Table 1, and is additionally adjusted;
which has been shown to describe better the experimental points at large core distances m. As a result, the charged particle density at 600 m from the core, , is increased by for showers above eV with axes inside array perimeter, and by outside.
| 18.1 | 18.3 | |||
|---|---|---|---|---|
| 0 | 1.6 | 2.3 | 3.5 |
3 Energy estimation
The main distinctive feature of the Yakutsk array is the air Cherenkov light measurement. The total flux of the light emitted in atmosphere, , is used as the main estimator of the primary particle energy. In order to derive the relation between and ionization loss of the shower electrons in atmosphere we have to use the classic formula by Tamm and Frank [5] for the number of Cherenkov photons in the wavelength interval () emitted when relativistic electron moves in air cm with the speed :
| (3) |
where ; is refraction coefficient. Emission is possible when the particle velocity is greater than . At the depth in atmosphere the threshold energy of electrons is , where are air refraction coefficient and density at the sea level. In the first approximation with regard to the number of photons emitted on the length is
| (4) |
The total light flux at the sea level is given as the integral of electron energy spectrum in the shower :
| (5) |
where is attenuation coefficient of the light intensity in atmosphere. Integrating by parts and using the boundary conditions we take
| (6) |
Due to slow variable at and , we can factor outside the integral over energy:
| (7) |
The energy spectrum of electrons near the shower maximum gives , where is independent of ; . The cascade curve of electrons can be approximated according to the measurements by HiRes [6]:
where . Attenuation of the Cherenkov light in atmosphere has the length [4]. Substituting to the total flux integral and expanding near we have
| (8) |
. On the other hand, is ionization integral. The final relation is
| (9) |
with the accuracy . It is determined by and attenuation of light in atmosphere but is independent of hadronic interaction model assumptions.
Hereafter we analyze the shower parameters governing the energy fractions transferred to EAS components.
3.1 Energy balance of EAS components
The energy fractions of EAS primary particle transferred to the shower components can be described on the basis of hadron transport equations [4, 7]. If is the energy transferred to nucleons, charged pions, muons+neutrinos, electrons+photons, then we are going to demonstrate in this subsection, with simple arguments, that a few cascade parameters determine the ratios between - the energy balance in the shower. For instance, the transport equation for charged pions density at depth :
| (10) |
where interaction mean free paths are assumed constant; are the spectra of charged pions produced in pion-air and nucleon-air interactions, can be transformed (integrating ) to:
| (11) |
where ; ; is nucleon inelasticity supposed to be constant; .
In the energy range the only parameters to define the quantity are and . It means that the energy transferred to charged pions is independent of the spectra of pions produced in nuclear interactions. Hence, in the general case, we can use the simple -model with , where is the multiplicity of secondaries, to balance the components energy in a shower. Because of the net value of , the uncertainty due to simplified model should be of the second order of magnitude.
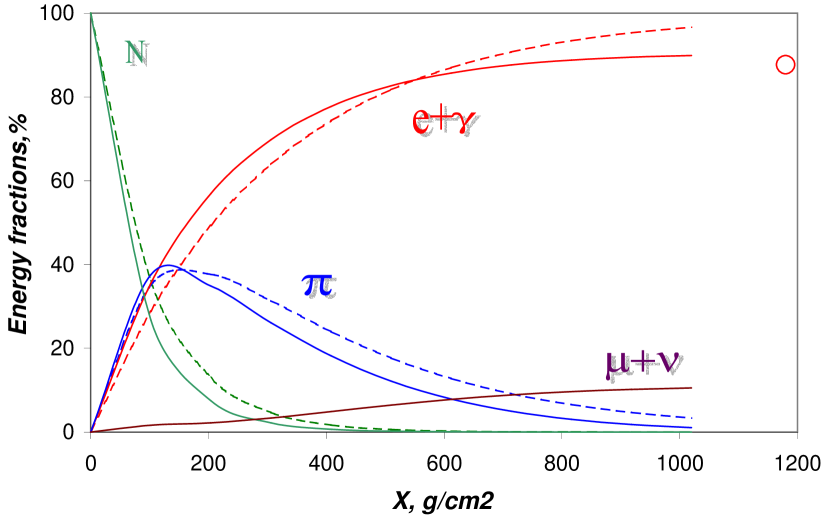
To summarize, the main model parameters to govern the energy balance in the shower are average inelasticity coefficients, mean free paths, multiplicity of secondaries and the fragmentation rate of primary nucleus. Other model characteristics such as ’the form of rapidity distribution of constituent quarks’ are of less influence. The resultant energies in the case of constant and are shown in Fig. 1 together with -model results. An asymptotic () estimation of with CORSIKA(+QGSjet) program at eV (open circle) [8] is shown here as well.
3.2 Experimental evaluation of the energy dispensed to EAS components
Energy fractions of the main EAS components can be estimated using the Yakutsk array data. Ionization loss of electrons is measured here detecting the total flux of the Cherenkov light on the ground. A relation between these values is given by formula (9) with parameters relevant to the Yakutsk array, taking into account detector calibration and atmospheric transparency factors [4, 9]:
Other portions of the energy carried out by electromagnetic and muonic components beyond the sea level is evaluated via the total number of electrons:
where are the critical energy and radiation length of electrons in air; attenuation length is derived from zenith angle dependence of [10];
and muons measured on the ground:
where the average energy of muons is taken from the MSU array data [16].
Residuary energy fractions transferred to neutrinos , nucleons etc., unmeasurable with this array, are estimated using model calculations. The resulting apportioning of the primary energy 1018 eV is given in Table 2.
| Energy deposit | The portion | Experimental |
|---|---|---|
| channel | of energy, % | uncertainty, % |
| 78 | 30 | |
| 9 | 30 | |
| 9 | 16 | |
| 4 | 20 |
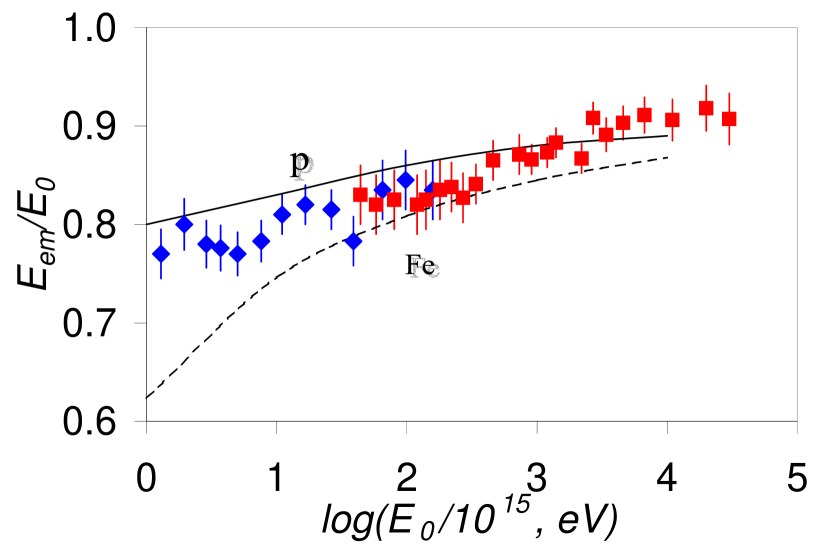
The energy fraction carried by electromagnetic component appears to be the basic contribution to the total energy of the shower, and its energy dependence (measured with Cherenkov light detectors + scintillators of the Yakutsk array) is illustrated in Fig. 2, together with -model estimation under superposition assumption for the primary proton and iron nucleus.
Because the air Cherenkov light total flux, and electron and muon number of the shower are experimental values measured on the ground, only about 10% of the primary energy eV is calculated using the model assumptions. So we consider the energy estimation algorithm in use in the Yakutsk group to be model-independent in the first approximation.
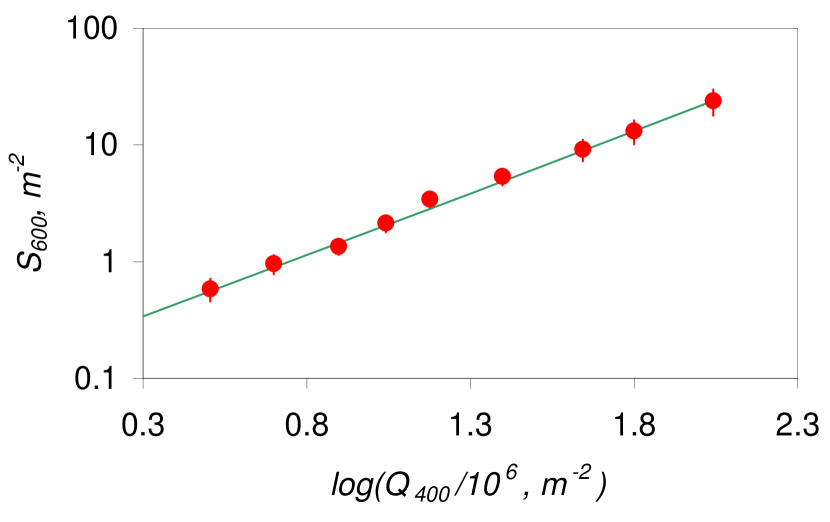
Moonless nights when air Cherenkov light measurements are possible constitute of the observation period. In order to evaluate the primary energy of the bulk of showers, the linear correlation
is used between the charged particle density at 600 m from the shower core and the light intensity at 400 m from the core, (Fig. 3) which, in turn, is related to the total flux of the Cherenkov light on the ground [4].
Experimental uncertainties in EAS component energies estimated using the Yakutsk array data are summarized in Table 2. The main contribution arise from which is formed by uncertainties in atmospheric transparency (15%), detector calibration (21%) and the total light flux measurement (15%). Errors in estimation of determine the next two items (for ionization in the ground and ). Resultant energy estimation uncertainty is the sum of all errors weighed with the second column of the Table 2: . Extra 20% is added due to conversion uncertainty.
The conversion relation from to primary energy was re-examined in 2003 [11]. For vertical showers () we have:
| (12) |
Uncertainty of the conversion factor is mainly due to absolute calibration error of the Cherenkov light detector and optical transparency estimation error of the atmosphere. These errors affect the intensity of CR flux but not the shape of the spectrum.
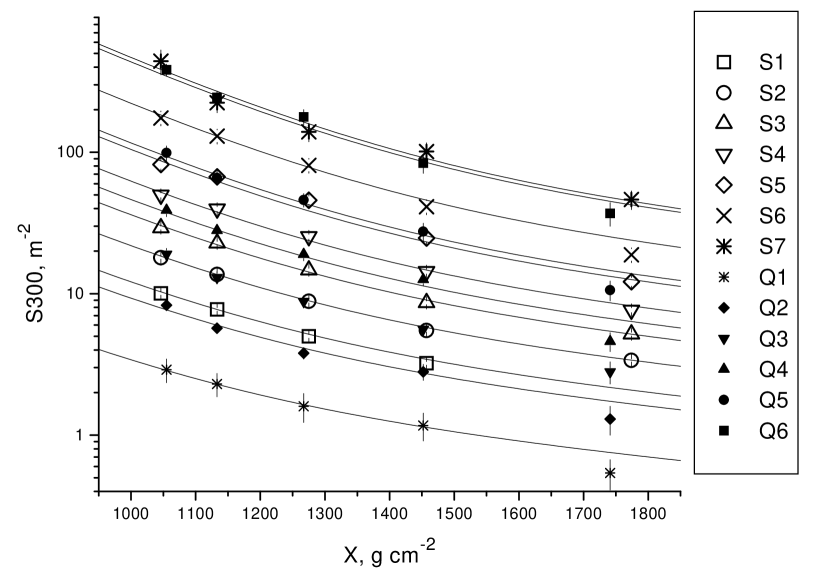
The observed densities at zenith angle, , are connected to the vertical direction values along attenuation curve [12]. In order to measure the attenuation length of these densities for fixed primary energy, we have used two different methods - well-known equi-intensity cut method, and fixing the Cherenkov light intensity at 400 m from the core as the equivalent of the primary energy, taking into account the light absorption in the atmosphere. In Fig. 4 the results are given. Experimental points are consistent with each other for the two methods used and can be described by the sum of two components - soft (electrons, attenuation length ) and hard (muons, ):
| (13) |
where is the hard component fraction. Attenuation curve for is the same but is different:
| (14) |
Previously we used to apply another attenuation curve in order to estimate the primary energy [4] which leads to divergence in energies of inclined showers rising with zenith angle.
Four showers in the energy range eV are given in Table 3 (one event is added slightly below the threshold because the energy estimation error is larger than tiny difference).
| Date | ,% | ||||
|---|---|---|---|---|---|
| 18.02.04 | 47.7 | 20.16 | 42 | 16.3 | 140.2 |
| 07.05.89 | 58.7 | 20.14 | 46 | 2.7 | 161.6 |
| 21.12.77 | 46.0 | 20.01 | 40 | 50.0 | 220.6 |
| 15.02.78 | 9.6 | 19.99 | 32 | 15.5 | 102.0 |
4 The energy spectrum measured with the Yakutsk array
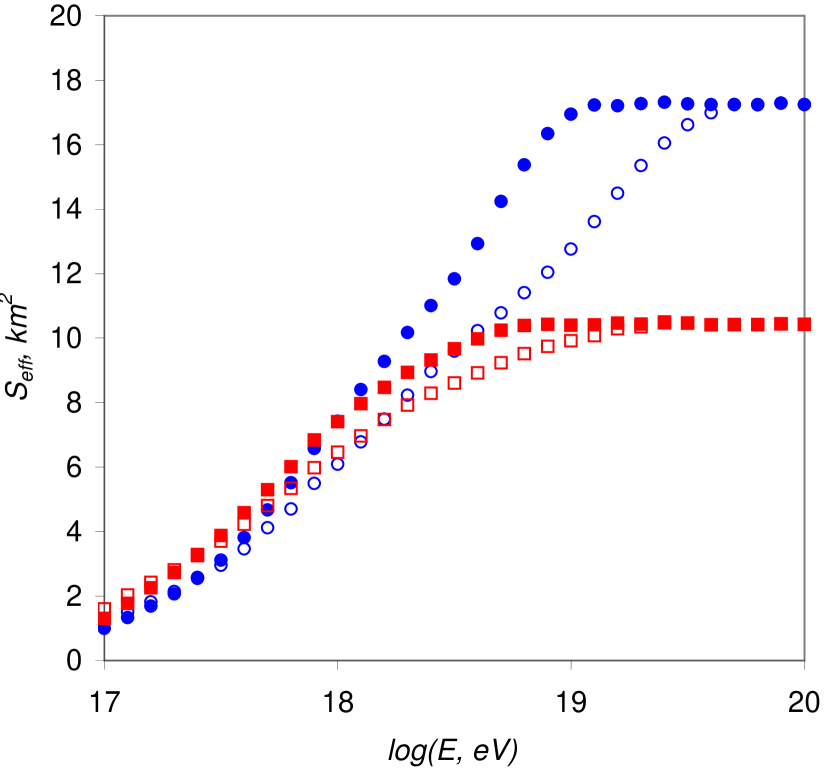
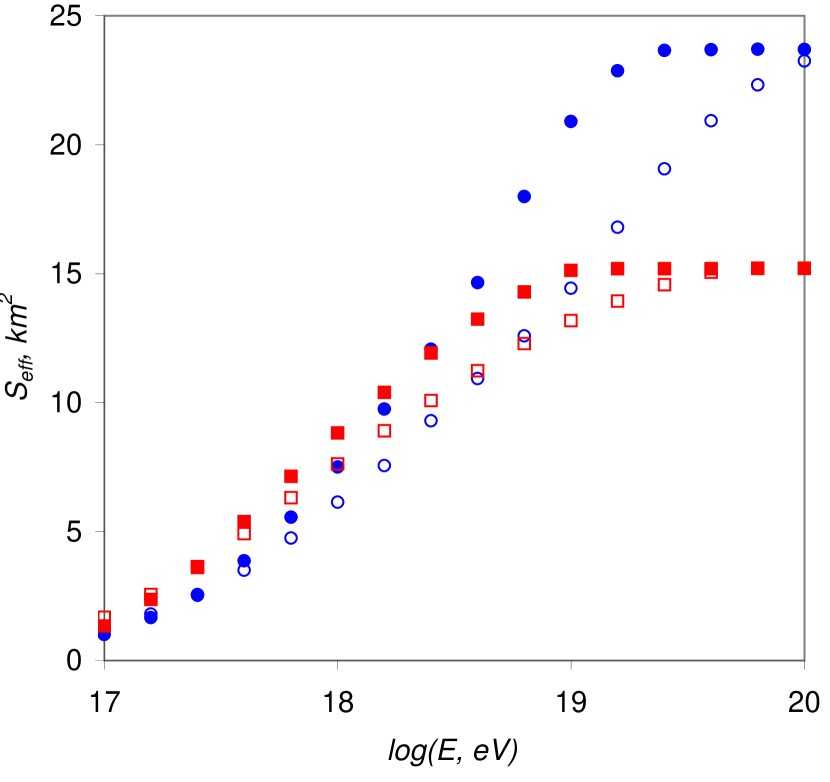
To derive - the product of array acceptance area, observation periods duration and solid angle, we have used ; the real duration of the array duty time periods as ; and have calculated the area limited within the array perimeter. The array configuration has been changed several times since 1974; the actual perimeter was used in particular time period. For the highest-energy showers the extended perimeter was applied. In this case the array area is increased times while the shower parameters reconstruction is still possible with acceptable error. Energy dependence of the array area calculated for the vertical showers in the case of strict perimeter and extended one is shown in Fig. 5 and Fig. 6 correspondingly. The same procedure is applicable at each zenith angle for inclined EAS because .
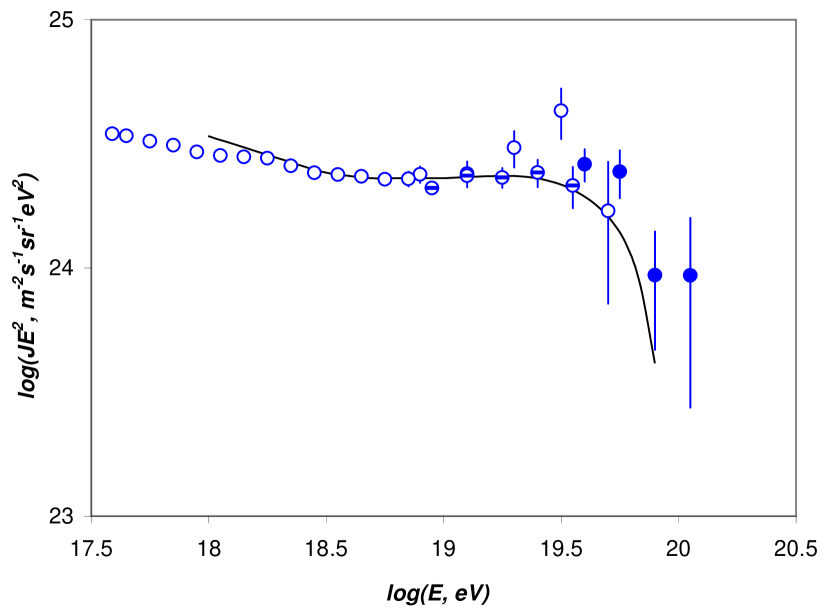
In Fig. 7 resulting integral energy spectrum of cosmic rays is given composed of showers above eV, with zenith angles . We confirm with the present dataset analysis the existence of an ’ankle’ feature in the shape of spectrum around eV, i.e. the flattening in the spectral index revealed earlier by all the groups working in this energy range [13]. At the highest energy end of the spectrum we still have a deficit in agreement with the expected flux cutoff due to interactions of CRs with relic microwave background. As an example of the model calculation results, the curve in Fig. 7 shows UHE proton spectrum [18] in the model with uniform distribution of extragalactic sources with eV.
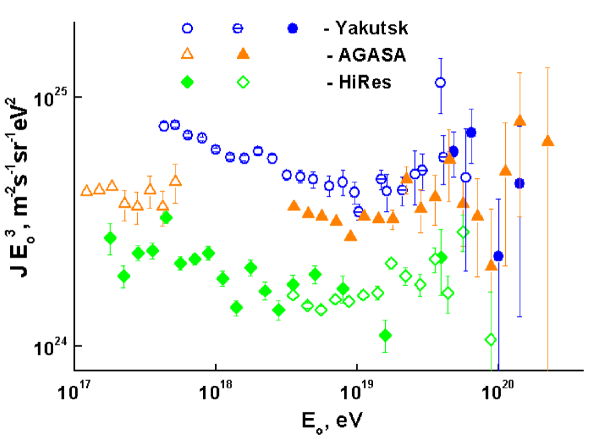
Comparison with other spectra measured with AGASA and HiRes arrays is shown in Fig. 8. Differential intensities in energy bins measured in Yakutsk and statistical errors of the data are given in Tables 4, 5, 6 for usability of the spectrum. In the energy range below intensities are highest of the Yakutsk array data. Most likely it is due to different energy estimation technique used in three cases - resultant energies diverge. In AGASA case the model dependent relation between and is used, HiRes team measures the fluorescence light flux which is connected to ionization loss of electrons in atmosphere. Our relations (12) for vertical showers give energy higher than model calculations by (30-40)% at eV and by (15-20)% at eV.
| 5.89E+19 | 4.76E+24 | 2.75E+24 |
| 3.89E+19 | 1.15E+25 | 2.86E+24 |
| 2.57E+19 | 4.90E+24 | 1.19E+24 |
| 1.62E+19 | 4.20E+24 | 7.09E+23 |
| 9.55E+18 | 4.15E+24 | 4.15E+23 |
| 7.94E+18 | 4.56E+24 | 5.29E+23 |
| 6.31E+18 | 4.41E+24 | 4.14E+23 |
| 4.90E+18 | 4.69E+24 | 3.42E+23 |
| 3.98E+18 | 4.81E+24 | 2.79E+23 |
| 3.16E+18 | 4.89E+24 | 2.30E+23 |
| 2.51E+18 | 5.68E+24 | 1.99E+23 |
| 2.00E+18 | 6.08E+24 | 1.70E+23 |
| 1.58E+18 | 5.68E+24 | 1.36E+23 |
| 1.26E+18 | 5.75E+24 | 1.09E+23 |
| 1.00E+18 | 6.17E+24 | 1.05E+23 |
| 7.94E+17 | 6.84E+24 | 1.03E+23 |
| 6.31E+17 | 7.05E+24 | 1.06E+23 |
| 5.13E+17 | 7.74E+24 | 1.39E+23 |
| 4.27E+17 | 7.64E+24 | 2.75E+23 |
| 4.07E+19 | 5.75E+24 | 1.29E+24 |
| 2.88E+19 | 5.08E+24 | 8.59E+23 |
| 2.09E+19 | 4.23E+24 | 5.58E+23 |
| 1.48E+19 | 4.70E+24 | 4.23E+23 |
| 1.02E+19 | 3.47E+24 | 2.53E+23 |
| 1.41E+20 | 4.50E+24 | 3.18E+24 |
| 1.00E+20 | 2.30E+24 | 1.628E+24 |
| 6.43E+19 | 7.19E+24 | 1.75E+24 |
| 4.81E+19 | 6.04E+24 | 1.23E+24 |
At the highest energies our intensities became closer to AGASA data, but GZK cutoff feature is different. The slope of the spectrum above eV seems rising in the case of the Yakutsk array data as well as for HiRes spectrum; on the contrary, AGASA data exhibit no cutoff. But the probability to detect three or less events above eV in Yakutsk is 15%, while 6 events are expected according to AGASA’s intensity. Therefore, it seems that one has to wait until Auger/TA data in order to decide whether there is the GZK cutoff or not.
In addition to the charged particle detection on the ground, we have another technique at the Yakutsk array - the air Cherenkov light measurement, which can be used to draw out the CR spectrum in independent way [9]. These two spectra are shown in Fig. 9 covering the wide energy region from to eV. The Cherenkov detector sub-array is covering only about km2 area, so it is convenient at energies , while scintillator stations can measure the spectrum above this limit. At the low energy threshold of the main array eV we have a discrepancy in intensity measured using two methods. This may be caused by uncertainty increasing in the vicinity of the threshold.
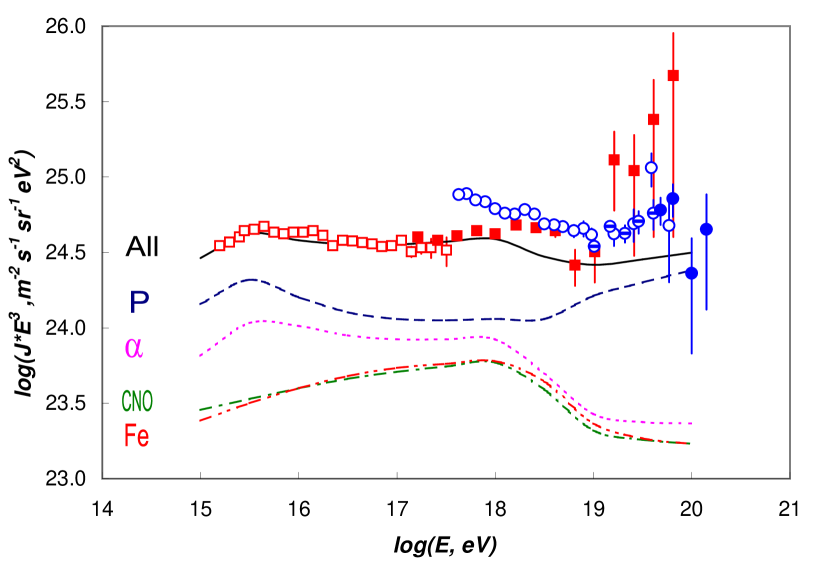
Two features of the measured spectrum - a ’knee’ (at eV) and ’dip’ around eV can be explained in the model of anomalous diffusion of galactic cosmic rays in fractal interstellar medium [19] . In this model the mass composition is predicted in the energy range eV; EAS maximum depth vs. energy is simulated by CORSIKA v.6.0 code using QGSjet model assumptions. Resulting spectra of the primary nuclei groups are shown by curves in Fig. 9, together with the total spectrum marked ’All’.
5 Conclusions
We have measured the energy spectrum of cosmic rays below and surrounding the GZK cutoff region. Air Cherenkov light measurements provide us the model-independent approach to the primary energy estimation using the total light flux connected to the ionization loss of electrons in atmosphere. Other appreciable energy fractions are evaluated on the basis of the total number measurement of electrons and muons on the ground. An updated function to approximate the lateral distribution of charged particles leads to increased average density . As a result, we have three showers detected with energies above eV including a new event detected 18.02.04. Two energy spectra measured with the Yakutsk array cover the range to eV and exhibit the ’knee’ and ’dip’ features in agreement with other arrays. The spectrum tail above is consistent with the GZK cutoff contrary to AGASA result, although the statistical significance of this conclusion is insufficient due to a few showers detected above eV.
Acknowledgments
We are grateful to the Yakutsk array staff for the essential contribution to data acquisition and analysis. AAI would like to thank CRIS 2004 organizers for invitation and hospitality. This work is supported by RFBR grants #02-02-16380, #03-07-90065, #03-02-17160 and INTAS grant #03-51-5112. Observations at the Yakutsk array is supported by Russian Ministry of Sciences and Education under the program #01-30.
References
- [1] K. Greisen, Phys. Rev. Lett. 16 (1966) 748.
- [2] G.T. Zatsepin and V.A. Kuzmin, JETP Lett. 4 (1966) 144.
- [3] N.N. Efimov et al., Catalogue of HECR N3, World Data Center C2, Japan (1988) 56.
- [4] M.N. Dyakonov et al., Cosmic Rays of Extremely High Energy (Nauka, Novosibirsk) (1991).
- [5] I.E. Tamm, Journ. of Phys. (USSR) 1 (1939) 439.
- [6] T. Abu-Zayyad et al., ApPh 16 (2001) 1.
- [7] A.D. Erlykin and A.W. Wolfendale, astro-ph/0112553.
- [8] C. Song et al., ApPh 14 (2000) 7.
- [9] A.A. Ivanov, S.P. Knurenko and I.Ye. Sleptsov, Nucl. Phys. B (Proc. Suppl.) 122 (2003) 226.
- [10] B.N. Afanasiev et al., in Proc. Worksh. Techn. Study EHECR, Tokyo (1993) 35.
- [11] A.V. Glushkov et al., Proc. 28th ICRC, Tsukuba 1 (2003) 393.
- [12] A.A. Ivanov et al., Izv. RAN, ser. fiz. 65 (2001) 1221.
- [13] M. Nagano and A.A. Watson, Rev. Mod. Phys. 72 (2000) 689.
- [14] N. Hayashida et al., Proc. Int. Symp. on EHECR: Astroph. Future Observ., Tokyo (1996) 17.
- [15] N. Sakaki et al., Proc. 27th ICRC, Hamburg 1 (2001) 333.
- [16] B.A. Khrenov, Muons in EAS and nuclear interactions of CR particles in air (in Russian). Doct. Phys. Math. Thesis, MSU (1986).
- [17] T. Abu-Zayyad et al., astro-ph/0208301.
- [18] V. Berezinsky, A. Gazizov and S. Grigorieva, astro-ph/0302483.
- [19] A.A. Lagutin et.al., Nucl. Phys. B (Proc. Suppl.) 97 (2001) 267.