The Lyman- glow of gas falling into the dark matter halo of a galaxy
Quasars are the visible signatures of super-massive black holes in the centres of distant galaxies. It has been suggested11endnote: 1e.g. Carlberg, R.G. Quasar evolution via galaxy mergers. Astrophys. J. 350, 505-511 (1990) that quasars are formed during “major merger events” when two massive galaxies collide and merge, leading to the prediction that quasars should be found in the centres of the regions of largest overdensity in the early Universe. In dark matter (DM)-dominated models of the early Universe, massive DM halos are predicted to attract the surrounding gas, which falls towards its centre. The neutral gas is not detectable in emission by itself, but gas falling into the ionizing cone of such a quasar will glow in the Lyman- line of hydrogen, effectively imaging the DM halo22endnote: 2Haiman, Z. & Rees, M. Extended Ly Emission around Young Quasars: A Constraint on Galaxy Formation. Astrophys. J. 556, 87-92 (2001). Here we present a Ly image of a DM halo at redshift 3, along with a two-dimensional spectrum of the gaseous halo. Our observations are best understood in the context of the standard model for DM halos33endnote: 3Navarro, J.F., Frenk, C.S., & White, S.D.M. A Universal Density Profile from Hierarchical Clustering. Astrophys. J. 490, 493-508 (1997); we infer a mass of solar masses () for the halo.
Using radiative transfer calculations, Haiman & Reesref2 predicted that gas falling into a DM halo between redshifts and that was harbouring a quasar should be detectable in Ly-emission at flux levels accessible to present day telescopes, owing to the reprocessing of quasar ultraviolet photons. Recently, Barkana & Loeb44endnote: 4Barkana, R. & Loeb, A. Spectral signature of cosmological infall of gas around the first quasars. Nature 421, 341-343 (2003) found absorption features in quasar spectra, which they interpreted as a signature of neutral hydrogen (Hi) falling into the DM halos surrounding two quasars. Such absorption features can be used to study the gas in one dimension (1D) along the line of sight, whereas detection of extended Ly-emission can be used in a 2D study, providing more constraints on the interplay between gas, quasar radiation and DM halo.
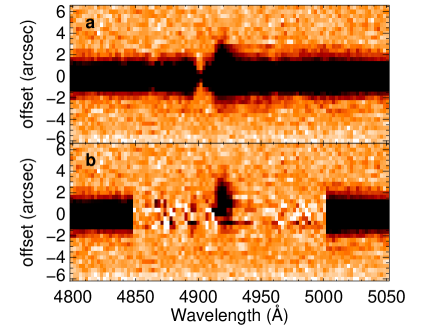
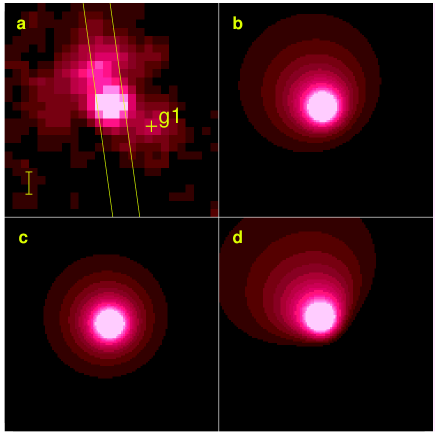
In a deep Ly narrow-band image we detected asymmetric extended emission North-East of the radio-quiet quasar Q1205-30, making this quasar a prime candidate for a study of its DM halo. The extended Ly emission was first thought to be related to a foreground absorber55endnote: 5Fynbo, J.P.U., Thomsen, B., & Møller, P. Ly emission from a Lyman limit absorber at z=3.036. Astron. Astrophys. 353, 457-464 (2000), but deep follow-up spectroscopy obtained with the FORS1 instrument on the ESO Very Large Telescope allowed us to measure precise redshifts of quasar, absorber, and extended emission, clearly linking the extended emission to the quasar, not the absorber. The 2D spectrum is presented in Fig. 1 (details of the data reduction will be presented elsewhere). In the 2D spectrum the wavelength increases along the abscissa, and the position on the sky changes along the ordinate. In order to reveal the underlying extended emission we have optimally extracted the 2D quasar spectrum by fitting and removing the quasar spectral point-spread function66endnote: 6Møller, P. Spectral PSF Subtraction I: The SPSF Look-Up-Table Method. The ESO Messenger 99, 31-33 (2000). Spectroscopic detection of kinematically resolved extended Ly-emission is not uncommon77endnote: 7Møller, P., Warren, S.J, Fall, S.M., Jakobsen, P., & Fynbo, J.U. SPSF Subtraction II: The Extended Ly Emission of a Radio Quiet QSO. The ESO Messenger 99, 33-35 (2000),88endnote: 8Bunker A., Smith, J., Spinrad, H., Stern, D., & Warren., S.J. Illuminating Protogalaxies? The Discovery of Extended Lyman- Emission around a QSO at . Astrophys. Sp. Sci. 284, 357-360 (2003), but it does not provide sufficient information to distinguish between scenarios of – for example – nearly edge-on disks and gaseous halos. For this, morphological information is needed. In Fig. 2a we present a arcsec2 narrow-band image of the extended emission.
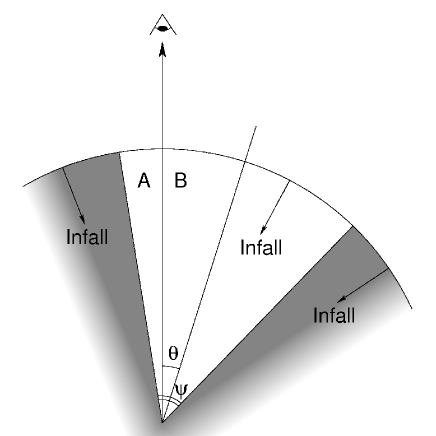
A quasar emits its radiation in an ionizing cone with an opening angle of , while we observe the whole system under an inclination angle of (see Fig. 3). The surface brightness at each point in the vicinity of the quasar is calculated by integration of the volume emission along the line of sight99endnote: 9Gould, A. & Weinberg, D.H. Imaging the Forest of Lyman Limit Systems. Astrophys. J. 468, 462-468 (1996). We take the gas density profile to be a power-law, , with a slope and a neutral hydrogen density at a distance of kpc , because this appears in numerical simulations of DM halos to be a good approximation at small radii1010endnote: 10Barkana, R. A model for infall around virialized haloes. Mon. Not. R. Astron. Soc. 347, 59-66 (2004). If we assume a mass of the DM halo, we may calculate the observed infall velocity in the model. At a given projected distance from the quasar the observed velocity is the average projected velocity weighted with the emissivity of the gas along the line of sight.
Applying this model to Q1205-30, our calculation shows that the Ly halo should be detectable with 8-m class telescopes up to several arcsec from the quasar, assuming a modest amount of neutral hydrogen infall. Considering – for now – the case where only one cone is visible, the extended emission may be symmetric (if , that is, the cone is seen close to end-on) or highly asymmetric (if ). By fitting the calculated surface brightness maps to the observed narrow-band image we establish a relation between the opening angle and the best-fitting inclination angle. Thus, we are left with the opening angle, , the slope, , and the neutral hydrogen density at kpc, , as the only free parameters of the model. In Fig. 2, we compare our observed narrow-band image to calculated Ly surface brightness maps with an opening angle and three different inclination angles: the best-fit and two others. For the expected large opening angles ()1111endnote: 11Lawrence, A. The relative frequency of broad-lined and narrow-lined active galactic nuclei - Implications for unified schemes. Mon. Not. R. Astron. Soc. 252, 586-592 (1991),1212endnote: 12Elvis, M. A Structure for Quasars. Astrophys. J. 545, 63-76 (2000), varying the opening angle primarily affects the shape of the surface brightness profile seen on the side where the emission is weakest (in Fig. 3, that would be on side A of the sightline), and only has a minor effect on the shape of the main emission profile (on side B). The gas density scale, , determines the normalization of the surface brightness profile, but not the shape, which is set by the slope . The results are not dependent on the choice of a power-law gas density profile. An exponential gas density profile provides an equally good fit to the data.
The extended emission is spatially resolved, so we can measure its surface brightness profile and velocity profile (see Fig. 4). The surface brightness profile is measured by integrating the flux from Å to Å in each spatial bin. The velocity in each spatial bin is measured by fitting a gaussian to the line profile. The infall velocity is calculated relative to the redshift of the quasar.
We find that the model describes the observations well. The opening angle is the only parameter which remains unconstrained, so we plot the surface brightness profile for a range of opening angles (Fig. 4a). The best-fit values for the neutral hydrogen density at kpc vary less than a factor two between and , while the slope varies between and . The velocity profile of the extended emission (Fig. 4b) arises as a projection effect, and fitting velocity curves of canonical DM halo profilesref3 to the observed velocities, we infer a virial mass of for the DM halo. An identical mass estimate is obtained when using an exponential gas density profile. The Hi density from our best fitting model allows us to calculate an accretion rate of yr-1 in neutral hydrogen. The total accretion rate will be higher as the gas is highly ionized.
Where studies based only on spectra are unable to provide evidence to distinguish between several different scenarios, the combination of deep imaging and deep spectroscopy allows us to rule out alternative explanations of the extended emission. Jets are generally believed to be present in radio-quiet quasars and are predicted to extend out to kpc1313endnote: 13Blundell, K.M., Beasley, A.J., & Bicknell, G.V. A Relativistic jet in the radio-quiet quasar PG 1407+263. Astrophys. J. 591, L103-106 (2003), where the extended Ly emission around Q1205-30 extends out to kpc. Outflowing galactic winds are believed to be triggered by supernovae going off inside the galaxy, and are therefore expected to be metal-enriched. Our detection limit of erg s-1 cm-2 arcsec-2 () ensures that we are able to detect the Civ and Heii lines typical in extended emission around radio-loud quasars1414endnote: 14Heckman, T.M., Lehnert, M.D., Miley, G.K, & van Breugel, W. Spectroscopy of spatially extended material around high-redshift radio-loud quasars. Astrophys. J. 381, 373-385 (1991). We did not detect any of these lines, so the gas appears not to have been enriched by supernovae.
Recieved 24 March; accepted 28 June 2004.


Correspondence and requests for materials should be addressed to M.W. (mweiding@eso.org).
Acknowledgements Based on observations made with ESO Telescopes at the Paranal Observatory.
Competing interests statement. The authors declare that they have no competing financial interests.