2 associated to Observatoire de Paris, LUTH, 92195 Meudon, France
3 Observatoire de Paris, Section de Meudon, LUTH, Place Janssen, F-92195, Meudon Cedex, France
Flare-induced fountains and buried flares in AGN
We discuss the local physical changes at the surface of an AGN accretion disk after the onset of a magnetic flare. The X-ray irradiation by a flare creates a hot spot at the disk surface where the plasma both heats up and expands in the vertical direction in order to regain the hydrostatic equilibrium. Assuming that the magnetic loop causing the flare is anchored deeply within the disk interior, we derive analytical estimates for the vertical dimension and the optical depth of the heated atmosphere as a function of the position within the spot. We perform computations for various values of the accretion rate , the fraction of radiation dissipated within the disk corona, and the covering factor of the disk surface with flare-illuminated patches. It turns out that generally we can distinguish three characteristic radial zones within the disk showing a qualitatively different behavior of the heated material. In the innermost regions of the disk (inner zone) the expansion of the disk material is restricted by strong gravitational forces. Further out, the flare source, initially above the disk, soon becomes embedded by the expanding disk atmosphere. At these intermediate disk radii (middle zone) the material is optically thick thus greatly modifying the observed radiation by multiple Compton scattering. We show exemplary spectra models obtained from Monte Carlo simulations illustrating the trends. In the outermost regions of the disk (outer zone) the expanding material is optically thin and its influence on the observed spectra is smaller but pressure gradients in radial directions should cause the development of a fountain-like dynamical structure around the flare source. We discuss the observational consequences of our results.
Key Words.:
accretion, accretion disk’s - black hole physics - magnetic fields1 Introduction
The X-ray spectra of active galactic nuclei (AGN) form mostly due to the Comptonization of the soft photons by the hot optically thin plasma. Since the accretion flow, at least in bright AGN, proceeds predominantly in the form of a cool, optically thick accretion disk, the origin of this hot Comptonizing plasma is not clear (see e.g. Narayan et al. 1998, Collin et al. 2001, Czerny 2003).
One of the attractive scenarios was formulated using the analogy with the solar corona activity: the surface of the accretion disk may be covered with emerging magnetic loops providing natural acceleration sites for the plasma (Galeev et al. 1979; Haardt et al. 1994). Such a view is supported for example by the numerical studies of the development of magnetorotational instability inside the disk (Miller & Stone 2000). If allowed, large magnetic loops emerge above the disk surface due to the buoyancy, finally leading to a flare. The stochastic nature of the X-ray variability pattern (Czerny & Lehto 1997) is also consistent with the idea of random coronal flares.
The energy dissipation of reconnecting magnetic loops and subsequent efficient production of the X-ray radiation affects the disk surface by illumination.
The irradiation of the cold (disk) surface and the formation of the so called reflected component was studied in several papers. Early works used the approach of the constant density medium to the disk structure (Basko et al. 1974; Lightman & White 1988, George & Fabian 1991, Życki & Czerny 1994) while the later papers considered also the disk vertical structure (Raymond 1993; Ko & Kallman 1994, Nayakshin et al. 2000, Różańska et al. 2002). Some of the recent papers addressed the specific issue of the flares above the disk surface (e.g. Ballantyne et al. 2001, Nayakshin 2000, Życki & Różańska 2001, Merloni & Fabian 2002).
The reflected spectrum consists of the Compton reflection hump with superimposed atomic features like the 6.4 keV iron line and iron edge, recognized for the first time in the observational data by Pounds et al. (1990). These spectral features should be the key to an understanding of the accretion flow since they are sensitive to the ionization structure and to the motion of the reprocessing material.
Recent observational results do not seem to favor the flare model for the hot plasma. High quality X-ray spectroscopy done with Chandra and XMM-Newton satellites rather supports the view that strongly relativistically broadened spectral features are characteristic for high accretion rate objects (QSO, Narrow Line Seyfert 1 galaxies) while low accretion rate objects (Seyfert 1 galaxies) display much more narrow lines although the results are not as conclusive as we would wish (see e.g. O’Brien et al. 2003). Simple interpretation of this trend favors a model with an inner hot flow. Flares may, or may not, develop only in high accretion rate objects.
However, the irradiation of the disk surface does not only lead to a change of the ionization state of the disk material. The heated plasma also expands. In the present paper we concentrate on the surprising consequences of such an expansion of the disk surface layers under the influence of a sudden strong flare.
2 The model
Irradiation of the cold optically thick disk in hydrostatic equilibrium by a source of intense X-ray emission leads to the formation of a hot strongly ionized surface layer (e.g. Nayakshin et al. 2000, Ballantyne et al. 2001, Różańska et al. 2002, Collin et al. 2003). The transition between the upper zone, roughly being at the Inverse Compton temperature, and the lower much colder disk body is very rapid if the spectrum of the incident radiation is rather hard and the metalicity of the medium is not much lower than the solar metalicity (e.g. El-Khoury & Wickramashinhge 1999). The phenomenon is related to the thermal instability of the irradiated medium considered by Field (1965), Buff & McCray (1974), Krolik et al. (1981).
In the following we consider the effect of the disk irradiation by a single flare using very simple formulae based on the works of Begelman et al. (1983), Różańska & Czerny (1996), Nayakshin (2000) and Różańska et al. (2002).
2.1 Flare at a fixed radius
We assume a flare located above an accretion disk around a black hole with the mass . The flare is located above a point in the disk at a radius . The disk temperature at this location in absence of irradiation is given by , and the disk internal dissipation provides the energy flux
| (1) |
where is the Stefan-Boltzmann constant.
The flare is expected to form due to the emergence of a magnetic loop from the disk interior. Therefore, the height of the flare is expected to be at the pressure scale height above the disk surface (Galeev et al., 1979; Haardt et al. 1974; Nayakshin & Kazanas 2001). Since the geometrical thickness of the accretion disk is also roughly equal to the pressure scale height we further assume that the disk thickness is equal to and the flare is located at from the equatorial plane, i.e at above the disk surface.
The flare luminosity is parameterized by the ratio of the illuminating flux hitting the disk surface directly below the flare to the flux dissipated within the disk interior.
We now consider the conditions at the disk surface as a function of the projected distance from the flare location, .
The incident flux from the flare decreases with distance
| (2) |
The local Inverse Compton temperature of radiation due to both the disk emission and the incident hard X-rays can be estimated as
| (3) |
where is the Inverse Compton temperature of the flare radiation given by its spectral shape. We assume that the temperature of the heated disk surface layers reaches this value. The rapid transition between this high temperature and the bottom cold layers takes place at the specific value of the ionization parameter, , equal to , which scales with the value of the Inverse Compton temperature as
| (4) |
as discussed by Begelman et al. (1983).
The geometrical thickness of the heated zone is determined by the pressure scale height, given by its temperature and the local gravitational field
| (5) |
where is the Boltzmann constant.
The optical depth of the heated zone is also specified by the value of the ionization parameter :
| (6) |
where we assume that the medium is fully ionized and the opacity is dominated by electron scattering, .
This set of equations allows us to determine and as a function of if are given.
2.2 Global scaling
The parameterization used in the previous section is convenient for comparison with the result of detailed numerical computations performed at some disk radius for a specific disk model. However, we also introduce another, more global parameterization, which allows to express some of the input parameters used in the previous section by the global parameters: the total accretion rate in Eddington units, , the fraction of the energy dissipated in the corona, , and the covering factor of the disk surface, , with hot spots. With these three parameters, we can replace three of the parameters ( and ) introduced in Section 2.1.
The value of specifies the accretion rate in physical units by the relation
| (7) |
The flux dissipated by the disk at a given radius is determined as
| (8) |
which gives the disk temperature from Eq. 1. Here the factor represents the standard zero-torque boundary condition at the marginally stable orbit.
The global accretion rate specifies the thickness of the accretion disk which can be approximated by
| (9) |
This formula is more complex than the simple formula from Shakura & Sunyaev (1973) for the radiation pressure dominated region since at low accretion rates/large radii the radiation pressure contribution decreases. The presented formula is accurate within a factor of 2 in a whole range of disk accretion rates from to , and radii from the marginally stable orbit to when tested against the numerical solutions from the code of Różańska et al. (1999). The flux dissipated in the corona does not contribute to the disk height until ; the disk height does not tend to zero since it must transport the angular momentum of accreting material supporting dissipation.
The ratio of the incident flux to the disk internal flux is given by
| (10) |
We stress here that by the covering fraction, , we mean the fraction of the disk surface which is strongly irradiated. This fraction is specified by the mean number of flares per unit disk surface area times the size of the hot spot (which is of the order of ). Therefore, is not related to the actual size of the flare itself which we assume to be small and negligible in further considerations.
3 Results
3.1 Special case - test of the method
In our modeling we approximate the flare by a point-like source. We assume that the emitted spectrum has a power law shape, with photon energies extending from 1 eV to 100 keV. The low energy cutoff of the order of 1-10 eV is appropriate if the disk provides the soft photons for Comptonization. The high energy cutoff is only weakly constrained by the observational data (Gondek et al. 1996); recent Beppo-SAX sample of Seyfert 1 galaxies gives the best fit e-folded energy keV (Deluit & Courvoisier 2003, their table 2 for ). Our value of 100 keV is consistent with this limit. The energy index of our spectrum is fixed at 0.9 as it is suggested by many observations, starting from the early Seyfert galaxy observations done by Pounds et al. (1990). The corresponding Compton temperature of the power law emission is equal to K.
We first test the model assuming parameters which were adopted in previous numerical computations of the disk irradiation. Both Ballantyne et al. (2001) and Collin et al. (2003) studied the radiation transfer for a flare located above the disk around a black hole, with the incident flux equal to erg s-1 cm-2, and the ratio of the incident radiation flux to the disk flux equal to 144. The flare was located at 9 of disk radius. Since the numerical computations of the radiative transfer by Ballantyne et al. (2001) and Collin et al. (2003) were performed assuming the plane-parallel approximation, their results can be used to test the model predictions directly below the flare, at . We therefore adjusted the global parameters introduced in Sect. 2.1 in order to reproduce these conditions.
From the analytical formulae given in Section 2 we obtain that at the location of the flare, , the disk heated layer expands up to , and the optical depth of the heated zone is equal to 1.1. Therefore, the heated atmosphere expands well above the original position of the flare.
In the numerical computations of Ballantyne et al. (2001) and Collin et al. (2003), performed until achievement of the disk hydrostatic equilibrium, this effect was not taken into account; an implicit assumption was made that the flare rises in order to compensate for the expansion of the disk atmosphere. However, the flare supported by the disk interior may, or may not, rise up but its evolution is caused by the dynamics of the magnetic loop and not forced by the surrounding plasma. We further assume that the flare remains embedded in the hot plasma, like solar flares embedded in the solar corona. As a more accurate approach we should in this case consider the modification of the irradiating flux by the scattering within the hot medium. However, for simplicity we neglect it in the present research. Therefore, our results should be directly comparable to the numerical results.
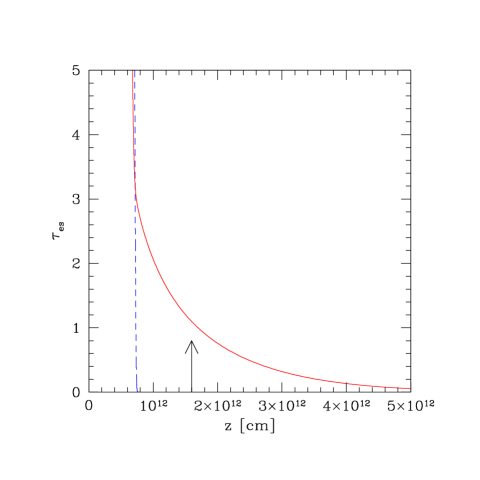
The comparison of the optical depth measured from the disk surface for the non-irradiated disk and irradiated disk in hydrostatic equilibrium is shown in Fig. 1. The density in the unilluminated disk rises fast close to the surface so the profile is very steep (dashed line) and marks well the disk surface. The density profile in illuminated model is much more shallow (continuous line). The disk thickness, defined by the density drop to g cm-3, increases from to cm, so by a factor of 10, but most of the plasma is located within the distance 2-3 larger than the original disk height. The optical depth of the medium measured from the position of the flare (marked by an arrow) is equal to 1.3. These numbers are not far from our analytical estimates. This is encouraging for our simple approach: the analytical results should be valid within a factor of a few or better.
The advantage of our model is that we can perform computations not just below the flare, but as a function of the projected distance.
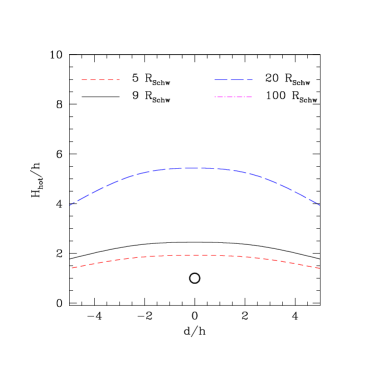
The distribution of the thickness of the Compton heated zone as a function of the distance for this model is shown in Fig. 2.
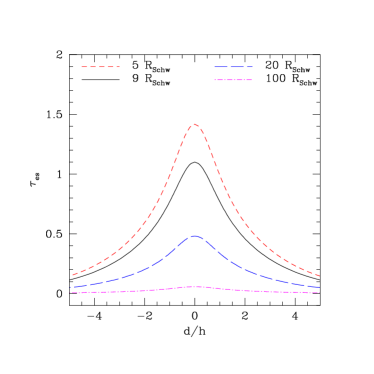
From Fig. 2 we see that the geometrical thickness of the heated zone decreases with rather slowly. This is due to the fact that this quantity is determined by the Inverse Compton temperature. Due to the large adopted ratio of the flare to disk flux at , the Inverse Compton temperature is dominated by the flare contribution even at large distances. On the other hand, the incident flux itself decreases more rapidly and so does the optical depth of the heated zone and its density.
The heated layer has moderate optical depth, of the order of 1 close to the flare. Therefore, the flare is not completely shielded from an observer by the plasma environment but the scattering is significant and may influence the flare’s appearance. We neglect this effect in our model but we will return to this issue later on.
3.2 General case: characteristic radii
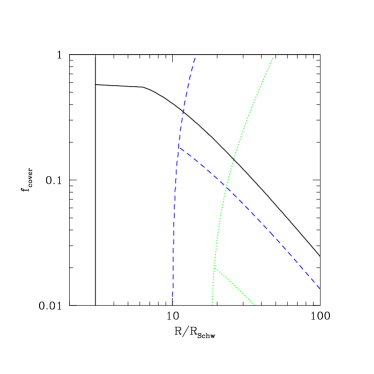
In order to see the direction in which the hot medium properties change we plot in Fig. 3 three examples of the radial dependence of the geometrical thickness of the heated zone and the optical depth of the heated zone just at the flare location, .
Close to the marginally stable orbit the optical depth drops rapidly and the disc thickness (and consequently flare height) go to zero which is related to the zero-torque boundary condition used in the model. This is a property of all presented models and we do not discuss the results in this region.
Further out, we can distinguish three types of characteristic zones:
-
•
outer zone: geometrically thick but optically thin. In this zone the flare is embedded in the hot medium; it still can act as a point like source although a certain fraction of the emitted photons is scattered by the expanded plasma.
-
•
middle zone: geometrically thick and optically thick. Our simplified computations do not strictly apply to this zone but the existence of the zone is clearly indicated; here the flare is located deep inside the hot medium so the radiation coming out cannot be clearly seen as a point like source.
-
•
inner zone: geometrically thin; here the flare is not at all embedded in the heated material.
The transition from the outer to the middle zone is determined by the condition of the heated layer. The transition between the middle and the inner zone is defined by the condition . In each of these zones the material is expected to behave differently.
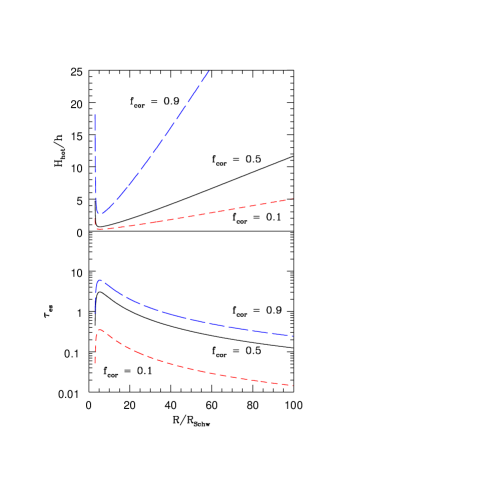
Radial extension of the zones depends significantly on the adopted values of the parameters, , and . A few examples are shown in Fig. 4. For a strong corona, , the middle region is usually very extended but it shrinks with an increase of the covering factor. The inner region with bare flares shows up only at high accretion rates. For a moderate corona, , the middle region is generally less extended so for a weak corona/high covering factor the middle region disappears and only the outer region and an inner region remain.
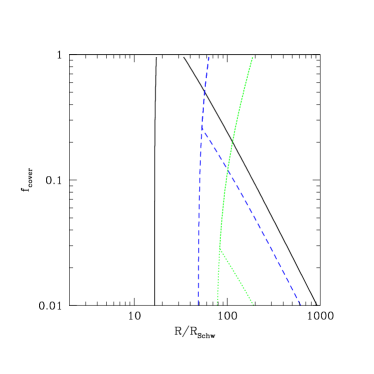
However, the radial extension of the zones depends on the adopted accretion rate. For sources radiating closer to the Eddington rate an inner zone always develops (see Fig. 4, right panel). The width of the middle zone in high accretion rate objects is slightly narrower than in the case of low accretion objects, if measured in logarithmic scale, and it is systematically shifted toward larger radii, making space for an inner zone. The basic trends with the covering fraction and the corona strength remain the same: stronger corona (i.e. larger ) leads to broader middle zone while larger covering factor causes it to shrink.
3.3 The outer zone, ,
This zone is present in all solutions, for each parameter set. Our computations are strictly applicable there. The flare is embedded in the hot expanded medium but the medium is optically thin. Therefore, both the point-like source is visible to the observer as well as the disk surface is irradiated roughly like in the absence of the scattering medium.
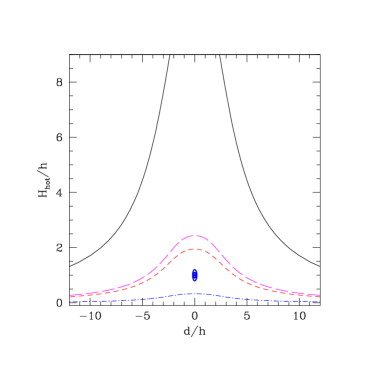
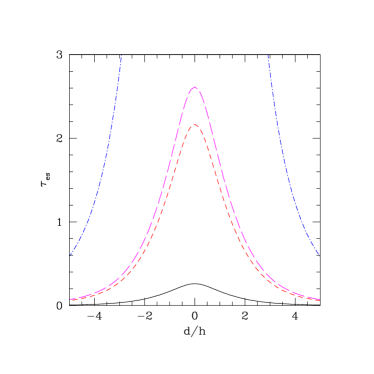
An exemplary profile of the geometrical thickness and the optical depth of the medium in the vicinity of the flare is shown in Fig. 5. For a parameter set we considered (, , , ) the profile is less shallow than in Fig. 2 since the ratio of the incident to disk flux underneath the flare is now 10 instead of 144 so the value of the Inverse Compton temperature (see Eq. 3) drops more rapidly. However, the basic picture remains the same: the hot material rises most effectively directly under the flare, surrounding it, and less effectively further away.
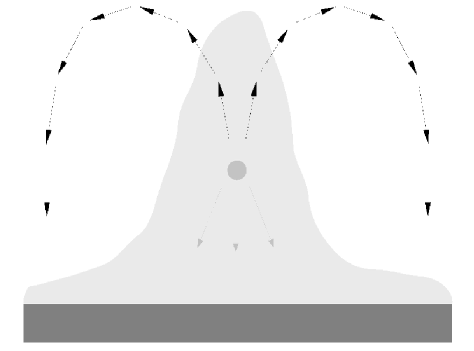
If the flare lasts long enough, a kind of semi-stationary picture is expected to emerge. Radial pressure gradient should cause a side flow of the evaporated material and its subsequent condensation at the disk surface while a fresh material will rise up. This circulation creates a fountain-like phenomenon. We envision this situation qualitatively in Fig. 6 but the computations of the dynamics of the plasma are beyond the scope of the present paper.
Therefore, in the outer zone, the flare above an accretion disk shows considerable similarity with ejective flares observed in the solar corona. Solar flares, being the sources of the hard X-ray emission, are also embedded in the optically thin solar corona, and accompanied by the flow of the heated material (e.g. Raymond et al. 2003; Manoharan & Kundu, 2003 for recent solar observations).
The flow of the material in AGN will be additionally affected by the disk rotation. In a Keplerian disk, the local epi-cyclic frequency is also given by the local Keplerian frequency so the flow pattern will be strongly twisted due to Coriolis forces.
3.4 The middle zone, ,
This zone covers a major part of the disk in the sources with low accretion rate and strong corona. The optical depth of the hot material, as computed from our approach, varies from just above 1 in models with relatively large covering fraction to 10 in models with .
Tho examples of the solution when the optical depth is still relatively low are presented in Fig. 5, for parameter sets: , and , , assuming in both cases , .
Our analysis allows us to estimate the extension of the zone. However, a quantitative description of the processes going on there is not possible within the adopted approach. In this zone the flare is deeply embedded in an optically very thick plasma so any photon is scattered many times before leaving the area. From the point of view of an observer, a compact source is now replaced by a more extended medium surrounding it. The irradiation of the disk surface is partially through the scattered radiation. The exact computations would be particularly complex in these zone, with the effect depending both on the total optical depth of the heated layer and on the amount of the material between the flare itself and the cold disk surface (i.e. on the ratio).
Since in this zone also the radial pressure gradients will develop within the heated material we also expect some systematic circulation of the material in this zone. However, it may be less spectacular due to the large optical depth, effectively forming a kind of turbulent optically thick skin covering the disk surface.
3.5 The inner zone,
This zone is always present in high accretion rate objects. Here the flare is located above the heated plasma and a fraction of the flare emission reaches an observer directly. From this point of view, the inner zone is similar to the outermost, optically very thin part of the outer zone. In Fig. 5 we give a possible solution of the inner region for the parameters , , assuming in both cases , .
The optical depth of the heated layer is often high; its value is not well estimated from our model since in the case of the large optical depth the radiative transfer must be considered. The extension of the zone, however, is well determined.
This region is well described by the models of Ballantyne et al. (2001) and Collin et al. (2003) who neglected the possibility of the flare being surrounded by the rising disk atmosphere. No spectacular fountains are expected as the rise of the material is suppressed by the strong gravitational field. The role of the radial pressure gradients in this situation must be smaller, as the ratio of the radial to vertical pressure gradient scales with , and consequently the radial flow velocities are expected to be much lower than the sound speed.


4 Discussion
The flare scenario is an attractive explanation of the origin of the hard X-ray emission in radio quiet AGN. However, this idea mostly exists as a simple phenomenological picture. If we want to prove its viability - or reject the model - we must study more carefully its implications.
In the present paper we show that the development of a flare leads not only to the irradiation of the disk surface but it strongly perturbs the disk surface structure.
Taking into account the reaction of the disk surface to the irradiation, we divide the disk into three zones. In the outer zone the flare is soon embedded in the rising medium but the plasma surrounding the flare is optically thin. In the middle zone the flare is embedded in an optically thick plasma. In the inner zone the flare stands above the perturbed disk surface. The middle zone does not always exist: it is broad for low covering factor for the hot spots and/or large fraction of energy dissipated in the form of the flare emission, and disappears for large covering factor and/or weak flares.
This rising plasma, heated up to the local Inverse Compton temperature, may influence the observational appearance of a flare.
4.1 Observational consequences
If the assumed model parameters allow the existence of the middle region the formation of the X-ray reflected component in the source is strongly modified. In the middle region the flare is buried deeply within the optically thick plasma. This will have two important consequences.
4.1.1 Formation of the reflected component
Since the flare emission diffuses through the optically thick medium, no reflection component forms in this region of the disk. Therefore, the reflection forms only in the outer as well as in the innermost zones. The relativistic broadening of the spectral features of this component (mostly the iron line) allows to identify the formation region so studying the broadening we should see two components: one, only weakly broadened, and the second one coming from the relatively narrow inner ring.
As an example, we can use the model parameters possibly appropriate for the famous source MCG -6-30-15. This object radiates most probably at (Czerny et al., 2001) of the Eddington ratio. Assuming the covering of the disk surface with hot spots and the corona strength we obtain that the inner reflection-forming ring ends at . It may explain why the reflection observed in this source comes only from a relatively narrow ring, (Lee et al. 2002b), instead of the whole disk.
If the source accretes at a low rate and the corona is strong the inner zone practically disappears and no reflection component forms in the inner region of the disk. This is for example the case for sources with when and . Our picture may therefore revive the idea pursued by Young et al. (2001) in the context of Cyg X-1 that the accretion disk also for low luminosity states extends down to the marginally stable orbit. This view was criticized by Barrio et al. (2003) at the basis of a careful study of the reflection component, assuming that the incident radiation comes from above the disk atmosphere. However, if the ’incident flux’ comes from within the optically deep surface layers, the analysis of Barrio et al. (2003) does not apply.
Some reflection also forms in the outer region: for the case considered for MCG -6-30-15 (, , ) this region extends outward from ; the actual value depends significantly on the adopted . The amount of gravitational energy available there is already quite low. This region should contribute a relatively narrow and not too strong iron line component to the observed reflection spectrum.
Burying a flare inside an optically thick region is even more efficient in suppressing the reflection than complete ionization of the illuminated surface discussed by Nayakshin et al. (2000), or Ballantyne et al. (2001) and Done & Nayakshin (2001). It also allows for a natural possiblity of a relatively rapid radial transition from the inner reflection-producing region (bare flares) to the middle non-reflecting region.
4.1.2 Thermal vs. non-thermal character of the ’primary’ emission
In the context of the solar flare models, both thermal radiative processes (e.g. Karpen et al. 1989; Gan et al. 1991) as well as non-thermal emission (Mariska et al. 1989; Antonucci et al. 1993) were considered. Both types of processes are probably relevant also in the case of magnetic flares above AGN accretion disks and accretion disks in galactic sources (e.g. Coppi 1992, Gierliński et al. 1999, Wardziński & Zdziarski 2001, Vaughan et al. 2002). Together they form the (customarily named) ’primary component’ of the radiation spectrum, but their relative importance seems to depend on the accretion rate. Comptonization by mostly thermal electrons ( keV is favored for low objects while a significant non-thermal electron population is likely to be present in high objects.
Those trends with the accretion rate may be possibly explained within the frame of our model.
High objects in our picture are characterized by the extended inner zone with bare flares. In this case we might expect a significant fraction of non-thermal electrons.
However, if a flare is embedded in a surrounding plasma, several additional processes are expected. There will be a significant down-scattering of the photons at energies around keV. Also cooling and thermalization of the electrons may be different in such surroundings. As a result, the emission coming from the middle region may look much more ’thermal’ than the emission from the inner zone.
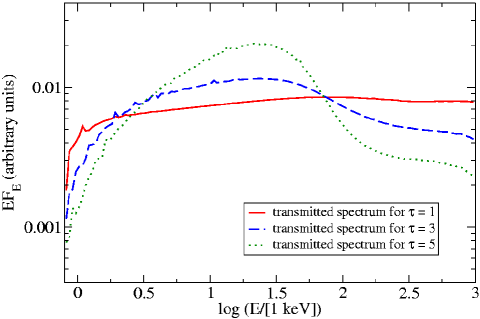
To illustrate the trend, we calculate the observed spectrum from a buried flare assuming that the surrounding material forms a spherical cocoon around the flare location. The plasma is assumed to be completely ionized, and parameterized with the optical depth. The point-like flare source of radiation is modeled as a power law with the energy index (photon index ) extending from 0.1 keV up to 1 MeV. We choose such an extreme case to illustrate better the spectral shape trends. The temperature of the medium is set at the value of the inverse Compton temperature for such an incident spectrum ( K). The setup is basically similar to models describing Comptonization by cold and/or hot electrons considered in the past in many papers (e.g. Pozdniakov et al. 1979, Sunyaev & Titarchuk 1980, Górecki & Wilczewski 1984; for more recent developments see Titarchuk & Hua 1995, Hua & Titarchuk 1995, and references in these articles).
The results obtained with the Monte Carlo code noar (Dumont et al. 2000) are shown in Fig. 7. We see that the slope of the spectrum at low energies is slightly modified by Compton up-scattering and the spectrum bends at high energies, imitating the high energy cut-off. At energies close to 1 MeV energy losses become lower since the Klein-Nishina effect significantly decreases the scattering cross-section.
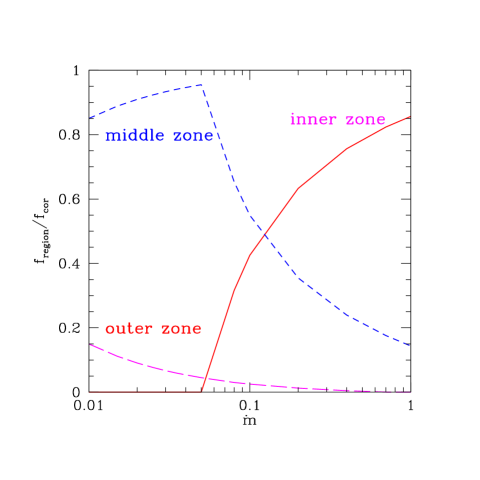
Detailed discussion of possible processes is definitely beyond the present simple paper. However, in order to see whether any systematic differences between the ’primary’ spectra from the inner and the middle zone influence objects with different accretion rates we calculate what fraction of the total energy dissipated in the corona comes from the three zones separately.
We show an example of such a plot in Fig. 8. We see that high accretion rate objects, according to the presented considerations, are dominated by emission from the inner zone. Therefore, their spectra are expected to be predominantly non-thermal. Observationally, this should manifest in the extension of the spectrum possibly well beyond the standard 100 keV. Unfortunately, estimates of the high-energy cut-off of radio quiet quasars or Narrow Line Seyfert 1 galaxies, believed to accrete roughly at an Eddington rate, are not available. In Seyfert 1 galaxies the X-ray emission is predominantly thermal, so if these sources accrete at a few percent of the Eddington rate their emission should be dominated by the middle region. This is indeed the case in our model if the fraction of energy dissipated in the corona is 0.65 or larger, and if the covering factor is of the order of 0.5 or lower.
4.2 Possible trends in global parameters
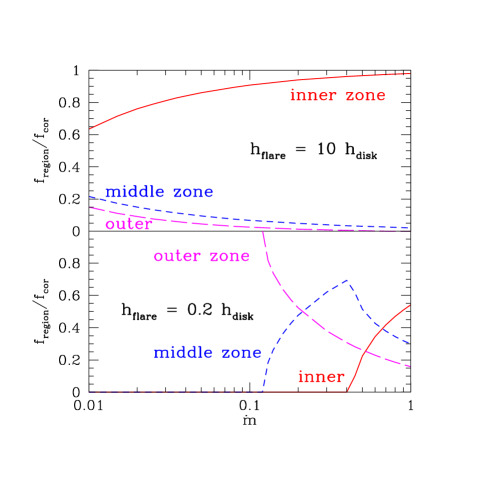
In our model we assumed that the flare is located at the height (with being the cold disk thickness) from the equatorial plane. However, flares rising to larger distances are also plausible (e.g. Romanova et al. 1998, di Matteo, Celotti & Fabian 1999, Poutanen & Fabian 1999, Merloni & Fabian 2001). This effect would naturally decrease the extension of the middle zone predicted by our model. We see that in Fig. 9, upper panel, calculated under assumption that the flare is located ten times higher above the disk body. On the other hand, high accretion rate models with magnetic energy transport, like in Merloni (2003) or Czerny et al. (2003), may lead to the extended middle zone. 3-D MHD simulations by Turner (2004) show that most of the dissipation takes place just below the disk surface. We can model such solution assuming the flare height being only a fraction of the disk thickness and taking (Fig. 9, lower panel).
What is more, a coupling between the model parameters , and can be expected. For example, in a model of Liu et al. (2002) the energy fraction in the corona increases with the radius in the radiation pressure dominated region and decreases in the gas pressure dominated region thus peaking somewhere in the transition radius. The model of continuous accreting corona of Różańska & Czerny (2000) based on disk evaporation showed basically an increase of the coronal strength in-wards. The model of Merloni (2003) predicts two branches of solutions, with the coronal strength decreasing with the distance at the stable branch. Most models predict a systematic decrease of the corona strength with an accretion rate, and such a trend is supported by observations (Wang, Watarai & Mineshige 2004).
Such coupling can be easily incorporated into the present model. The computations for the model of accreting corona (Różańska & Czerny 2000) show the domination of bare flare region in the total energy output since the corona strength decreases rapidly with radius, and usually to the presence of an inner hole in the cold disk due to the disk evaporation. The radial trend present in the solution of Merloni (2003) decreases the role of the outer region, since the corona does not form there, while the slight systematic increase of the coronal strength and its radial extension with an increase of the accretion rate enhances the role of the inner region. Exact predictions depend again on the description of the flare height which is not provided by these models.
4.3 Characteristic timescales
All these phenomena happen, however, if the material has enough time to rise from the disk surface before the flare turns off.
The timescale for the expansion of the hot material with the local sound speed up to is the same as the timescale to reach the hydrostatic equilibrium, i.e. it is given by the Keplerian timescale, as implied by Eq. 5.
The timescale for the formation of a magnetic loop due to magnetorotational instability and its emergence from the disk interior is also of the order of the Keplerian timescale (e.g. Romanova et al. 1998).
The duration of the radiative stage of the flare, however, is under debate. There are two kinds of argument leading in two directions.
Theoretical arguments are made that the magnetic loop reconnection is a very fast process, and therefore the duration of the flare is expected to be much shorter than the formation of the magnetic loop phase (see e.g. Haardt et al. 1994, Romanova et al. 1998). This option was also considered by Nayakshin & Kazanas (2002) and Collin et al. (2003).
Observationally, the analysis of the AGN variability in the X-ray band leads to the determination of the power spectra in which most of the power is in timescales of a day or longer (see e.g. Markowitz et al. 2003, Uttley et al. 2002) thus corresponding to timescales longer even by a factor of a few than the Keplerian timescale range in the disk.
Models explaining the power spectra (mostly in the context of galactic X-ray sources, but the phenomenon is intrinsically the same apart from the overall scaling factor due to the central mass) are solving the problem of observed long timescales by the claim that flares are naturally short lasting phenomena but they come in groups, or avalanches. The measured power spectrum reflects basically the coupling timescales between the flares, with the timescales of single flares contributing only to the steep high frequency part of the power spectrum (see e.g. Poutanen & Fabian 1999, Życki 2002).
Direct observational evidence of the development of a single flare is available only for solar corona flares. High resolution imaging and spectroscopy on board of the Yohkoh and RHESSI satellites brought very interesting results.
Magnetic loops emerge rather slowly from the interior to the solar corona, on a timescale of minutes, so the upward motion of the magnetically dragged plasma is subsonic. The trigger of the flare - i.e. the hard X-ray emission - is rather rapid, involving timescales of a few seconds (e.g. Lee et al. 2002a, Sui & Holman 2003) and the coronal source forms at the top of the magnetic loop. This coronal source remains active for a few minutes and then slowly decreases in brightness; at the same time the entire magnetic loop also evolves. Such a long active phase seen in the data is not expected from simple models of the phenomena occurring within current sheets, so some ad hoc ideas are developed in order to account for the slow release of the magnetic energy like for example magnetic trapping (e.g. White et al. 2002). What is more, high time-resolution observations of 14 behind-the-limb flares, with shielded foot-points, show that actually the hard X-ray emission of a single flare, present for several minutes, consists of many sub-pulses, as if the reconnection proceeds slowly, in a step by step process (Tomczak 2001).
Therefore, observations of the solar corona rather indicate that the duration of the flare is of the same order as the evolutionary timescale of the whole magnetic loop, and not much shorter as implied by the Alfven speed based estimates. It is clearly an open question whether the same applies to the flares above an accretion disk in AGN.
4.4 Time evolution of a flare
Certain aspects of the time evolution of the flare above an accretion disk were already discussed in several papers (e.g. Romanova et al. 1998; di Matteo 1998, Poutanen & Fabian 1999, Beloborodov 1999, Lu & Yu 2001, Czerny et al. 2004). It was stressed that slow expansion of the disk atmosphere makes the situation actually time-dependent (not well represented by pressure equilibrium) and may be responsible for the observationally confusing issue of the response of the irradiated disk surface to the change of the continuum (Vaughan & Edelson 2001; Nayakshin & Kazanas 2002, Collin et al. 2003).
The picture which emerges from the results given in Sect. 3 is even more complex than it used to be.
Shortly after the beginning of the flare activity the irradiated disk surface reaches a new thermal equilibrium. Later, the heated high-pressure layer starts to expand in order to regain the hydrostatic equilibrium, as described by Collin et al. (2003).
The flare, anchored deeply inside the disk (e.g. Nayakshin & Kazanas 2001), is not expected to be influenced considerably by the rising hot material until this material starts to surround the flare. This happens after a relatively small fraction of the Keplerian timescale in the outer zone and relatively late (again, in terms of the local Keplerian timescale) in the middle zone. The outer zone, with its flares embedded in an optically thin plasma, resembles actually the solar corona, with flares inside the extended coronal plasma. Radiation pressure (not included in computations) will additionally increase the height of the hot layer although not substantially (gravitational attraction rising linearly outwards will counter-balance the radiative force as long as the thickness of the heated zone does not exceed the local disk radius).
The middle zone is qualitatively different and currently available spectra models (see Fig. 7 are not computed self-consistently. Rising optical depth between the source and the disc’s cold layers must saturate an incident flux. Exact outcome is not clear: for example, in recent 3-D MHD simulations of the MRI instability localized strong dissipation takes place at the optical depth of order of from the disk surface (Turner 2004). It is not clear, however, if such an extreme optical depth would be obtained if Comptonization was included as a mean of the radiative transfer instead of just flux-limited approximation (i.e. bremsstrahlung/black body). Future modeling should address, in particular, this issue.
An interesting study of the rise of the disk material under the flare was done by Williams & Maletesta (2002) in the context of cataclysmic variables, where they considered accelerated electrons hitting the disk surface. Some aspects of this study may also apply to AGN.
5 Conclusions
Apart from radiative changes, X-ray flares above AGN accretion disks also modify the geometry of the disk surface. They cause the material to expand and, for a certain range of parameters, the flare is embedded within the disk atmosphere.
The physical changes of the disk atmosphere in the vicinity of a flare, namely the height of the heated surface and its optical depth , depend strongly on the radial flare position . Generally, rises, while declines with .
For a certain parameter range of the fraction of coronal heating and of the flare covering factor a zone of the disk exists where the flare sources are deeply buried within the expanded disk atmosphere (middle zone). For these flares no typical Compton reflection component is expected. For example, for low accretion rate objects with strong corona no relativistically broadened reflection from the inner part of the disk is predicted by the model.
Active Galaxies accreting at high rates are dominated by reprocessed X-rays from the inner zone where the flares are not surrounded by the expanding disk medium. For these objects we expect a relativistically broadened Compton reflection from the significantly ionized surface.
For intermediate accretion rate objects and a specific parameter range, the model predicts the narrow inner zone so the relativistically broadened reflection in such sources forms predominantly in an inner, narrow ring. This is an interesting possibility in the context of the Seyfert galaxy MCG -6-30-15.
Acknowledgments
We thank Suzy Collin and Martine Mouchet for very helpful discussions and comments to the manuscript. Part of this work was supported by the grants 2P03D00322 and PBZ-KBN-054/P03/2001 of the Polish State Committee for Scientific Research, by the Laboratoire Europeén Associé Astrophysique Pologne-France, and by the Hans-Böckler-Stiftung.
References
- (1) Antonucci, E., Dodero, M. A., Martin, R., Peres, G., Reale, F., Serio, S. 1993, ApJ, 413, 786
- (2) Ballantyne D.R., Ross R.R., Fabian A.C., 2001, MNRAS, 327, 10
- (3) Barrio F.E., Done C., Nayakshin S., 2003, MNRAS, 342, 557
- (4) Basko M.M., Sunyaev R.A., Titarchuk L.G., 1974, A&A, 31, 249
- (5) Begelman M.C., McKee C.F., Shields G., 1983, ApJ, 271, 70
- (6) Beloborodov A.M., 1999, ApJ, 510, L123
- (7) Buff, J. & McCray, R. 1974, ApJ, 189, 147
- (8) Collin S., Coupé S., Dumont A.-M., Petrucci P.-O., Różańska A., 2003, A&A, 400, 437
- (9) Collin S., Abrassart A., Czerny B., Dumont A.-M., Mouchet M., 2001, EAS Publications Series, Volume 1. Active galactic nuclei in their cosmic environment. JENAM 99, Toulouse, France, September 7-9, 1999. Ed. by B. Rocca-Volmerange and H. Sol. Les Ulis: EDP Sciences, ISBN 2-86883-563-5, 2001, p. 35 - 51
- (10) Coppi P.S., 1992, MNRAS, 258, 657
- (11) Czerny B., 2003, Active Galactic Nuclei: from Central Engine to Host Galaxy, meeting held in Meudon, France, July 23-27, 2002, Eds.: S. Collin, F. Combes and I. Shlosman. ASP (Astronomical Society of the Pacific), Conference Series, Vol. 290, p. 59
- (12) Czerny B., Lehto H.J., 1997, MNRAS, 285, 365
- (13) Czerny B., Nikołajuk M., Piasecki M., Kuraszkiewicz J., 2001, MNRAS, 325, 865
- (14) Czerny B., Nikołajuk M., Różańska A., Dumont A.-M., Loska Z., Życki P.T., 2003, A&A, 412, 317
- (15) Czerny B., Różańska A., Dovčiak M., Karas V., Dumont A.-M., 2004, A&A, 420, 1
- (16) Deluit S., Courvoisier T.J.-L., 2003, A&A, 399, 77
- (17) di Matteo T., 1998, MNRAS, 299, L15
- (18) di Matteo T., Celotti A., Fabian A.C., 1999, MNRAS, 304, 809
- (19) Done C., Nayakshin S., 2001, MNRAS, 328, 616
- (20) Dumont A.-M., Abrassart A., Collin S., 2000, A&A, 357, 823
- (21) El-Khoury W., Wickramasinghe D., 1999, MNRAS, 303, 380
- (22) Field, G. B. 1965, ApJ, 142, 531
- (23) Galeev A. A., Rosner R., Vaiana G. S., 1979, ApJ, 229, 318
- (24) Gan, W. Q., Zhang, H. Q., & Fang, C. 1991, A&A, 241, 618
- (25) George I.M., Fabian A.C., 1991, MNRAS,. 249, 352
- (26) Gierliński M., Maciołek-Niedźwiecki A., Ebisawa K., 2001, MNRAS, 325, 1253
- (27) Gondek D., Zdziarski A.A., Johnson W.N., George I.M., McNaron-Brown K., Magdziarz P., Smith D., Gruber D.E., 1996, MNRAS, 282, 646
- (28) Górecki A., Wilczewski W., 1984, Acta Astron., 34, 141
- (29) Haardt F., Maraschi L., Ghisellini G., 1994, ApJ, 432, L95
- Karpen, Cheng, Doschek, & Devore (1989) Karpen, J. T., Cheng, C., Doschek, G. A., & Devore, C. R. 1989, ApJ, 338, 1184
- (31) Hua, X. & Titarchuk, L. 1995, ApJ, 449, 188
- (32) Ko Y.-K., Kallman T.R., 1994, ApJ, 431, 273
- (33) Krolik J.H., McKee C.F., Tarter C.B., 1981, ApJ, 249, 422
- (34) Lee J., Gary D.E., Qiu J., Gallagher P.T., 2002a, ApJ, 572, 609
- (35) Lee J.C., Iwasawa K., Houck J.C., Fabian A.C., Marshall H.L., Canizares C.R., 2002b, ApJ, 570, L47
- (36) Lightman A.P., White T.R., 1988, ApJ, 335, 57
- (37) Liu B.F., Mineshige S., Shibata K., 2002, ApJ, 572, L173
- (38) Lu Y., Yu Q., 2001, ApJ, 561, 660
- (39) Manoharan, P. K. & Kundu, M. R. 2003, ApJ, 592, 597
- (40) Mariska, J. T., Emslie, A. G., & Li, P. 1989, ApJ, 341, 1067
- (41) Markowitz A., et al. 2003, ApJ, 593, 96
- (42) Merloni A., 2003, MNRAS, 341, 1051
- (43) Merloni A., Fabian A.C., 2001, MNRAS, 328, 958
- (44) Merloni A., Fabian A.C., 2002, MNRAS, 332, 165
- (45) Miller K.A., Stone J.M., 2000, ApJ, 534, 398
- (46) Narayan R., Mahadevan R., Quataert E., 1998, in The Theory of Black Hole Accretion Disks, ed. M. A. Abramowicz, G. Bjvrnsson, & J. E. Pringle (Cambridge: Cambridge Univ. Press), 148
- (47) Nayakshin S., Kazanas D., Kallman T.R., 2000, ApJ, 537, 833
- (48) Nayakshin S., 2000, ApJ, 534, 718
- (49) Nayakshin S., Kazanas D., 2001, ApJ, 553, L141
- (50) Nayakshin S., Kazanas D., 2002, ApJ, 567, 85
- (51) O’Brien P., Reeves J., Pounds K.A., Page K., Turner M., 2003, in XEUS - studying the evolution of the hot universe, held at MPE Garching, March 11-13, 2002. Edited by G. Hasinger, Th. Boller, and A.N. Parmer, MPE Report 281, 2003, p. 191.
- (52) Pounds, K. A., Nandra, K., Stewart, G. C., George, I. M., & Fabian, A. C. 1990, Nature, 344, 132
- (53) Poutanen J., Fabian A.C., 1999, MNRAS, 306, L31
- (54) Pozdniakov L.A., Sobol I.M., Sunyaev R.A., 1979, SvAL, 5, 149
- (55) Raymond J.C., 1993, ApJ, 412, 267
- (56) Raymond, J. C., Ciaravella, A., Dobrzycka, D., Strachan, L., Ko, Y.-K., Uzzo, M., & Raouafi, N. 2003, ApJ, 597, 1106
- (57) Romanova M.M., Ustyugova G.V., Koldoba A.V., Chechetkin V.M., Lovelace R.V.E., 1998, ApJ, 500, 703
- (58) Różańska A., Czerny B., 1996, Acta Astr., 46, 233
- (59) Różańska A., Czerny B., 2000, A&A, 360, 1170
- (60) Różańska A., Czerny B., Życki P. T., Pojmański G., 1999, MNRAS, 305, 481
- (61) Różańska A., Dumont A.-M., Czerny B., Collin S., 2002, MNRAS, 332, 799
- (62) Shakura N.I., Sunyaev R.A., 1973, A&A, 24, 337
- (63) Sui L., Holman G.D., 2003, ApJ, 596, L251
- (64) Sunyaev R.I. Titarchuk L.G., 1980, A&A, 86,121
- (65) Titarchuk, L. & Hua, X. 1995, ApJ, 452, 226
- (66) Tomczak M., 2001, A&A, 366, 294
- (67) Turner N.J., 2004, ApJ, 605, L45
- (68) Uttley P., McHardy I.M., Papadakis I.E., 2002, MNRAS, 332, 231
- (69) Vaughan S., Edelson R., 2001, ApJ, 548, 694
- (70) Vaughan S., Boller Th., Fabian A.C., Ballantyne D.R., Brandt W.N., Trúmper J., 2002, MNRAS, 337, 247
- (71) Wang J.-M., Watarai K.-Y., Mineshige S., 2004, ApJ, 607, L107
- (72) Wardziński G., Zdziarski A.A., 2001, MNRAS, 325, 963
- (73) White S.M., Kundu M.R., Garaimov V.I., Yokoyama T., Sato J., 2002, ApJ, 576, 505
- (74) Williams G., Maletesta K., 2002, AJ, 123, 1095
- (75) Young A.J., Fabian A.C., Ross R.R., Tanaka Y., 2001, MNRAS, 325, 1045
- (76) Życki P.T., 2002, MNRAS, 333, 800
- (77) Życki P.T., Czerny B., 1994, MNRAS, 266, 653
- (78) Życki P. T., Różańska A., 2001, MNRAS, 325, 197
This paper has been processed by the authors using the Blackwell Scientific Publications LaTeX style file.