H kinematics of a disc galaxy from near-IR integral field spectroscopy
Abstract
In this letter we present the first 3D spectroscopic study of H emission in a field galaxy with an integral field unit. Using the CIRPASS spectrograph on Gemini-South we map the spatial and velocity distribution of H emission in the galaxy CFRS 22.1313. We detect two H emitting regions with a velocity separation of 220 10 km s-1. Combining the 2D map of H emission with HST F814W imaging, we determine a lower limit of 180 20 km s-1 for the rotation velocity of this (rest) -21 galaxy. We note that our value is significantly higher than the rotation velocity of 120 10km s-1 reported by Barden et al. (2003) for their long-slit spectroscopic study of this galaxy. Our lower limit on the rotation velocity is entirely consistent with no evolution of the rest -band Tully-Fisher relation. The position of this galaxy relative to the mean rest -band Tully-Fisher relation of Tully & Pierce (2000) is consistent with brightening of no more than 1 mag at . A larger integral field unit sample, without the uncertainties inherent to long-slit samples, is needed to accurately determine the evolution of the Tully-Fisher relation out to .
keywords:
galaxies: evolution – galaxies: individual: CFRS22.1313 – instrumentation: spectrographs – galaxies: spiral – galaxies: kinematics and dynamics1 Introduction
The Tully-Fisher (TF) relation describes the strong correlation between luminosity and maximum rotation velocity for disc galaxies (Tully & Fisher 1977). This reflects a fundamental relationship between the total mass of the galaxy and the mass contained in stars. The redshift evolution of this scaling relation provides a powerful test of galaxy formation models. Hierarchical models of galaxy formation predict that the ratio of stellar mass to total mass would be similar at all redshifts i.e. massive galaxies assembled through mergers of smaller galaxies. The ‘classical’ galaxy formation models (e.g. monolithic collapse; Eggen, Lynden-Bell & Sandage 1962) predict a higher mass to light ratio at higher redshift, since the gas is still being converted to stars within the fully-formed dark matter halo. However, stellar population evolution might produce an offset in the opposite sense (when based on observations at short rest-frame wavelength), since at high redshift a stellar population of identical mass is likely to be younger and therefore bluer than an equivalent population at low redshift.
Investigation of the evolution of the rest frame -band TF relation at has to date produced discrepant results with observations of only moderate luminosity evolution of mag out to (Vogt et al. 1996, 1997) compared with claims of much stronger evolution of mag at (Simard & Pritchet 1997; Rix et al. 1997). Previous high- work has so far been limited to long-slit spectroscopy, which has inherent problems - missing light through slit losses and possible misalignment of the slit, potentially leading to erroneous results for the rotation velocity if not addressed properly. However, the relatively new technique of 3D spectroscopy, used by Andersen & Bershady (2003) at low redshift, overcomes these difficulties. Using an integral field unit (IFU) we can efficiently obtain a complete census of the spatially extended line emission. We can potentially map disc kinematics at out to sufficiently large galactocentric radii to measure (without need for correction), as well as obtaining more detailed information on the spatial distribution of emission line regions.
In this letter we present the first demonstration of near-IR integral field spectroscopy of a field galaxy, using our new CIRPASS instrument (Cambridge IR PAnoramic Survey Spectrograph, Parry et al. 2000) on Gemini-South. By moving into the near-IR we were able to study the star formation in the galaxy CFRS 22.1313 (Lilly et al. 1995b) using the rest-optical H 6563 Å emission line, the same reliable tracer of star formation as used at low redshift. We investigate the disc kinematics through the H line and compare the results found here using an IFU to previous work using traditional long-slit spectroscopy.
The layout of this letter is as follows. In section 2 we describe our target galaxy, the CIRPASS IFU observations and archival HST imaging. In section 3 we discuss the distribution of star formation and the large-scale kinematics of the galaxy. Our conclusions are presented in section 4. We assume km s-1Mpc-1, and throughout this letter, unless otherwise stated. An angular scale of arcsec corresponds to a physical distance of 7.57 kpc at using the above cosmology.
2 Observations and Data Reduction
2.1 CIRPASS Spectroscopy
Our target is the disc galaxy CFRS 22.1313 (part of the Canada-France Redshift Survey (CFRS) - Lilly et al. 1995a) and was specifically chosen for IFU study as it is spatially extended and has an accurately known redshift (), for which H appears between sky lines. It also has strong [OII] 3727 Å flux, which should imply detectable H emission (Kennicutt 1992), and benefits from deep HST imaging from which the disc structural parameters may be derived. Near-infrared integral field spectroscopy of CFRS 22.1313 was obtained with CIRPASS on Gemini-South on the night of 2002 August 13. CIRPASS is a fibre-fed spectrograph with a 490 lenslet array with a variable lenslet scale and operates in the - and -band (–m). Using the arcsec diameter lenslet scale for these observations the array covered an area of by arcsec. The detector is a 1k1k Hawaii-I HgCdTe Rockwell array. The CIRPASS observations comprised eight separate 1800 s integrations with a seeing of about arcsec. An eight-point dither pattern was used to facilitate sky subtraction and the removal of bad pixels. The spectra were taken using a 400 l mm-1 grating with resolving power and dispersion 2.28 Å pix-1. The wavelength coverage was –m, targeting the redshifted H emission line, which appeared in a region free of OH sky emission lines.
The data were reduced using the CIRPASS IRAF package111The CIRPASS data reduction software is available from http://www.ast.cam.ac.uk/optics/cirpass/docs.html. For each 1800 s integration the detector was read out non-destructively 20 times at the start of the integration and at 600 s, 1200 s and 1800 s. The 20 multiple array reads are averaged for each loop to reduce read noise and adjacent loop averages are used to identify and reject cosmic rays. Bias subtraction was also performed at this stage. Since the target was stepped across different lenslets in the IFU for each of the eight observations, a sky frame was created for each exposure from the seven other integrations and this was used to perform first order sky subtraction. The spectra were then extracted using an optimal extraction algorithm (Johnson, Dean & Parry 2002) to account for crosstalk between adjacent spectra on the detector and to trace the curvature of the spectra from each fibre. The extracted spectra were flat-fielded using a dome flat, in order to remove the variation in throughput between fibres and the variation in sensitivity between pixels. The dome flat had previously been read-averaged, bias-subtracted and extracted. The data were wavelength calibrated using an argon lamp exposure, processed in the same way as the science data, again using optimal extraction. We used 17 argon lines and a quadratic fit to the dispersion, producing rms residuals of 0.2 Å (0.1 pix). Residual sky-lines were removed by fitting a low-order polynomial function to the wavelength-rectified data frames. Finally 3D (x,y,) data cubes were constructed for each integration before combining the eight individual exposures using the known telescope offsets. We observed two standard stars Hip257 and Hip106522 ( mag) to determine the flux calibration (these produced consistent calibrations). The observations of the standard stars were processed in the same way and used to flux calibrate the data cube.


2.2 HST Photometry
HST WFPC2 imaging was obtained from the archive (programme GO5996, the CFRS survey). There were five -band F814W exposures with a total exposure time of 6700 s. We re-reduced the data from the archive starting with the pipeline processed (flat-fielded and dark-subtracted) individual exposures. These were then combined with integer pixel shifts determined from the world coordinate system and with cosmic ray rejection at the 3 level.
The GIM2D software package (Simard 1998; Simard et al. 1999) was used to determine an accurate inclination, flux and scale length for the galactic disc in the HST F814W image. The approach of GIM2D is to convolve idealized two-dimensional galaxy models with the instrumental point spread function (PSF) and to subtract this from the original two-dimensional image: the best-fitting model is found by altering the model parameters to yield the smallest residuals from the real image.
Synthetic instrumental PSFs were created by TinyTim v5.0 (Krist 1995), which has the advantage that they are noiseless, can be sub-sampled and are created at the required location on the array. We produced PSFs sub-pixelated by a factor of 5 for WFPC 2 / WF 2 (F814W). We considered only an exponential disc profile (): as we are working in the rest-frame -band at , the red bulge should produce negligible deviations from the fit of the exponential disc to the WFPC 2 F814W -band data. We excluded the two H II regions which were bright in the rest- (section 3.1) from the GIM2D fit to the surface brightness profile, by masking regions of width 0.5 arcsec centred on the two knots. We experimented with different mask sizes and found this did not significantly affect the disc parameters and these errors are included in the uncertainty in the rotation velocity.
The galaxy centre, position angle on the sky, disc scale length, inclination and total flux were free parameters in the model. The best-fitting disc model from GIM2D had a half-light radius of arcsec (10 kpc): the disc itself had a position angle on the sky of 74 , the inclination to the line of sight was measured to be 78 (sin ). The exponential disc scale length was 0.75 arcsec (5.7 kpc). NICMOS NIC2 imaging for this galaxy also exists. We have examined this and find that the centre determined from the -band imaging (which traces the older starlight) agrees with the centre presented here.
Using SExtractor (Bertin & Arnouts 1996) the galaxy was found to have with the H II regions contributing 25 per cent of the total flux. Galactic extinction was determined using reddening 0.05 from Burstein & Heiles (1982). A correction of 0.88 mag was made for the inclination-dependent internal extinction, including the residual absorption of a face-on galaxy (0.27mag), using the prescription of Tully & Fouqué (1985) with an optical depth 0.55. The magnitudes were adjusted by a small k-correction (a dimming of 0.02mag for a Sbc spiral template spectrum from Coleman, Wu & Weedman 1980) to match the observed -band to the rest-frame -band.
3 Discussion
3.1 Distribution of star formation
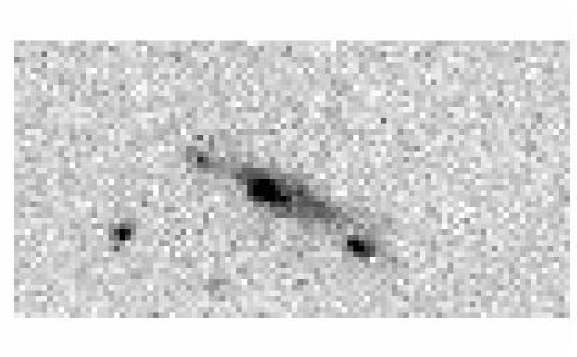
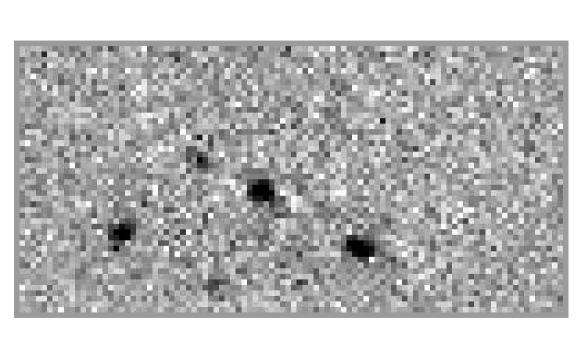
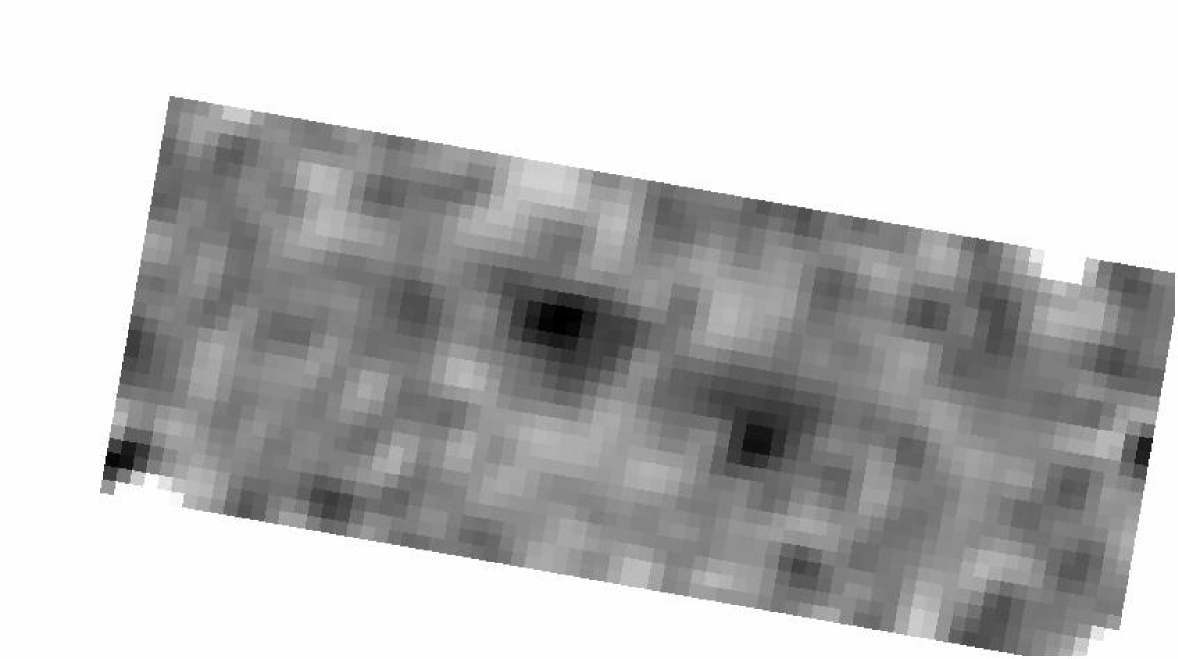
In this paper we present a map of the distribution of star-forming regions within this galaxy. Unlike long-slit approaches this is a complete census of the spatially extended star formation. As can be seen from Fig. 2 the H emission is concentrated in just two star-forming regions and these are spatially coincident with the ‘knots’ seen in the HST -band image (which corresponds to the rest frame ). From the HST image both of these ‘knot’-like H II regions are spatially resolved and noticeably elongated in the plane of the galactic disc. Knot A is near coincident with the projected centre of the galactic disc and extends over 2.7 2.4 kpc FWHM (after deconvolution with the WFPC2 PSF). Knot B is about arcsec from the centre and is 2.8 1.8 kpc FWHM (deconvolved). Their properties are tabulated in Table 1. In determining the rest frame -band luminosity of the star-forming knots we have first subtracted off the best-fitting galactic disc model provided by GIM2D (section 2.2). The surface brightness within the half-light radius of the star-forming knots in rest frame correspond to M⊙ kpc-2 within the range given in Meurer et al. (1997) for starburst galaxies at . We note that knot B (the H II region with the largest projected separation from the centre) lies exactly on the bolometric surface brightness versus angular frequency relation given in Meurer et al. (1997), based on the sample of Lehnert & Heckman (1996). We measure H at the greater than 5 level for each knot with fluxes of ergs cm-2 s-1 each (Fig. 1). We note our total H luminosity of erg s-1 cm-2 is slightly less than the value of obtained by Glazebrook et al. (2001) in their CGS4 UKIRT spectroscopy. In the absence of reddening our H fluxes would correspond to star formation rates of M per knot, where we have adopted the prescription of Kennicutt (1998), applicable for a Salpeter-like initial mass function (IMF). We note that the rest frame flux densities (Table 1) would underestimate these star formation rates (for the same IMF) by a factor of , which we attribute to the differential dust reddening between 4400 and 6563 Å or to the fact that the -band flux, unlike H, is not a direct measurement of current star formation rate. We spectrally resolve the line widths within the individual H II regions (Fig. 1). After deconvolution with the CIRPASS instrumental line width we measure of 44 15 and 74 10 km s-1.
| d | F | F(H) | FWHM | v | SFR(H) | ||||
| (kpc) | (mag) | (erg s-1 Hz-1) | (erg s-1 cm-2) | (Å) | (Å) | (km s-1) | (km s-1) | (M⊙ yr-1) | |
| (1) | (2) | (3) | (4) | (5) | (6) | (7) | (8) | (9) | |
| knot A | 2.8 1.0 | 24.11 | 1.00 | 9.4 | 11935.9 0.4 | 7.9 1.0 | 40 20 | 74 10 | 2.7 |
| knot B | 12.6 1.0 | 24.10 | 1.01 | 14.7 | 11927.5 0.4 | 5.8 1.0 | 180 20 | 44 15 | 4.2 |
The columns are as follows: (1) projected distance of star-forming knot from centre of galactic disc, (2) total magnitude (MAG_AUTO from SExtractor, Bertin & Arnouts 1996) in model-subtracted -band image, (3) rest- flux density from model-subtracted -band image, (4) H line flux, (5) central wavelength of H emission, (6) FWHM of H line, (7) velocity shift with respect to centre, (8) velocity dispersion (deconvolved), (9) star formation rate from H.
3.2 Large scale kinematics
Using the H emission line, we measure a velocity separation 220 10 km s-1 for knots A and B (Table 1). However, we do not measure a rotation curve for this galaxy: we simply have two discrete line emission regions. Coupling our CIRPASS IFU 3D spectrum with the HST images (specifically the location of the H II regions and the best fit to the centre of the galactic disc) we can set a robust lower limit of 180 20 km s-1 to (where is defined as half the total velocity shift across the galaxy). Of course as we see no evidence for a ‘turnover’ in the rotation curve could be significantly higher. We note that our lower limit on is significantly greater than the value of 120 10 km s-1 presented by Barden et al. (2003) for the same galaxy based on their ISAAC/VLT near-IR spectroscopy. This is and would be consistent with our measurement of the redshift difference between the H II regions if it was assumed that the centre of rotation was the geometric midpoint of the two star-forming knots. However, the HST image does not support this, with knot B at far greater projected distance from the disc centre. The systemic redshift is likely to be close to the H redshift of knot A ( cf. from the CFRS catalogue, Lilly et al. 1995b).
A simple estimate of the mass of the galaxy, , yields a value of M⊙ within 12 kpc.
3.3 The Tully-Fisher Relation at

The TF relation is a fundamental scaling law, the evolution of which is critical to our understanding of mass assembly and star formation in disc galaxies. Evolution of the TF relation at has been investigated with varied results. Vogt et al. (1996, 1997) find only moderate luminosity evolution () out to while Barden et al. (2003), Milvang-Jensen et al. (2003) and Böhm et al. (2004) detect a brightening of mag in the rest-frame -band. Much stronger evolution is suggested by the study of Simard & Pritchet (1997), which finds disc brightening of mag at lower redshift () and Rix et al. (1997), which derives a brightening of 1.5 mag at using the [OII] line. The degree of evolution observed for a particular sample is likely to depend strongly on the selection method.
In Fig. 3 we use our measured lower limit on to place CFRS 22.1313 on the TF relation and compare with the TF relation at the current epoch (Tully & Pierce 2000). We also plot the estimated TF relation at redshifts ( either side of the redshift of CFRS 22.1313) derived by other groups using long-slit spectroscopy. Using the total HST F814W magnitude for the galaxy of we obtain a lower limit on the offset of this one galaxy from the local rest -band TF relation consistent with disc brightening of no more than 1 mag at and entirely consistent with no evolution.
4 Conclusion
Our main results may be summarised as follows:
-
1.
We have presented the first near-IR integral field spectrum of a field galaxy. We have used our CIRPASS integral field spectrograph to map the spatial and velocity distribution of H in the galaxy CFRS 22.1313.
-
2.
The H emission originates from two giant H II regions offset by 220 10 km s-1 : we do not observe a full rotation curve for this galaxy.
-
3.
Archival HST imaging shows a clear disc morphology, along with two bright star-forming knots coincident with the H emission and accounting for 25 per cent of the total -band flux (the rest frame -band).
-
4.
We have coupled the 3D spectroscopy with the best-fitting model to the underlying disc in the HST F814W image, and used this to derive a lower limit to the rotation velocity of 180 20 km s-1. The lower limit on the offset of this one galaxy from the local rest -band TF relation is consistent with disc brightening of no more than 1 mag at and entirely consistent with no evolution.
-
5.
Integral field spectroscopy eliminates many of the systematic uncertainties inherent in long-slit studies. A larger sample of IFU data is required to accurately determine the evolution of the TF relation out to .
ACKNOWLEDGMENTS
This paper is partially based on observations obtained at the Gemini Observatory, which is operated by the Association of Universities for Research in Astronomy, Inc. (AURA), under a cooperative agreement with the U.S. National Science Foundation (NSF) on behalf of the Gemini partnership: the Particle Physics and Astronomy Research Council (PPARC, UK), the NSF (USA), the National Research Council (Canada), CONICYT (Chile), the Australian Research Council (Australia), CNPq (Brazil) and CONICET (Argentina). We are grateful to Matt Mountain for the Director’s discretionary time to demonstrate the scientific potential of integral field units (the PI s of this demonstration science programme are Andrew Bunker, Gerry Gilmore and Roger Davies). We thank the Gemini Board and the Gemini Science Committee for the opportunity to commission CIRPASS on the Gemini-South telescope as a visitor instrument. We thank Phil Puxley, Jean René-Roy, Doug Simons, Bryan Miller, Tom Hayward, Bernadette Rodgers, Gelys Trancho, Marie-Claire Hainaut-Rouelle and James Turner for the excellent support received. CIRPASS was built by the instrumentation group of the Institute of Astronomy in Cambridge, UK. We warmly thank the Raymond and Beverly Sackler Foundation and PPARC for funding this project. Andrew Dean, Anamparambu Ramaprakash and Anthony Horton all assisted with the observations in Chile and we are indebted to Dave King, Jim Pritchard and Steve Medlen for contributing their instrument expertise. The optimal extraction software for this 3D fibre spectroscopy was written by Rachel Johnson and Andrew Dean. This research is also partially based on observations with the NASA/ESA Hubble Space Telescope, obtained at the Space Telescope Science Institute (STScI), which is operated by AURA under NASA contract NAS 5-26555. This research was supported by NSF grant NSF-0123690 via the ADVANCE Institutional Transformation Program at NMSU. JKS acknowledges a PPARC studentship supporting this study. We thank the anonymous referee for helpful comments on this manuscript.
References
- [Andersen & Bershady 2003] Andersen D.R., Bershady M.A., 2003, ApJ, 599, L79
- [Bertin & Arnouts 1996] Bertin E., Arnouts S.,1996, A&AS, 117, 393
- [Barden et al. 2003] Barden M., Lehnert M.D., Tacconi L., Genzel R., White S., Franceschini A., preprint (astro-ph/0302392)
- [Burstein & Heiles 1982] Burstein D., Heiles C., 1982, AJ, 87, 1165
- [Böhm et al. 2004] Böhm A. et al., 2004, A&A, 420, 97
- [Coleman, Weedman & Wu 1980] Coleman G.D., Wu C.-C., Weedman D.W., 1980, ApJS, 43, 393
- [Eggen et al. 1962] Eggen O.J., Lynden-Bell D., Sandage A.R., 1962, ApJ, 136, 748
- [Glazebrook et al. 1999] Glazebrook K., Blake C., Economou F., Lilly S., Colless M., 1999, MNRAS, 306, 843
- [Johnson et al. 2002] Johnson R.A., Dean A.J., Parry I.R., 2002, in Rosado M., Binette L., Arias L.,eds, ASP Conf. Ser. Vol. 282, Galaxies: The Third Dimension.Astron. Soc. Pac., San Francisco, p.531
- [Kennicutt 1992] Kennicutt R.C., 1992, ApJ, 388, 310
- [Kennicutt 1998] Kennicutt R.C., 1998, ARA&A, 36, 189
- [Krist et al. 1995] Krist J., 1995, in Shaw R.A., Payne H.E., Hayes J.J.E., eds, ASP Conf. Ser. Vol. 77, Astronomical Data Analysis Software and Systems IV.Astron. Soc. Pac., San Francisco, p.349
- [Lehnert & Heckman 1996] Lehnert M., Heckman T.M., 1996, ApJ, 472, 546
- [Lilly et al. 1995] Lilly S.J., Le Fevre O., Crampton D., Hammer F., Tresse L., 1995a, ApJ, 455, 50
- [Lilly et al. 1995] Lilly S.J., Hammer F., Le Fevre O., Crampton D., 1995b, ApJ, 455, 75
- [Meurer et al. 1997] Meurer G.R., Heckman T.M., Lehnert M.D., Leitherer C., Lowenthal J., 1997, AJ, 114, 54
- [Milvang-Jensen et al. 2003] Milvang-Jensen B., Aragon-Salamanca A., Hau G.K.T., Jorgenson I., Hjorth J., 2003, MNRAS, 339, 1
- [Parry et al. 2000] Parry I.R. et al., 2000, SPIE, 4008, 1193
- [Rix et al. 1997] Rix H.-W., Guhathakurta P., Colless M., Ing K., 1997, MNRAS, 285, 779
- [Simard 1998] Simard L., 1998, in Albrecht R., Hook R.N., Bushouse H.A., eds, ASP Conf. Ser. Vol. 145, Astronomical Data Analysis Software and Systems VII.Astron. Soc. Pac., San Francisco, p.108
- [Simard 1999] Simard L. et al., 1999, ApJ, 519, 563
- [Simard & Pritchet 1998] Simard L., Pritchet C.J., 1998, ApJ, 505, 96
- [Swinbank et al. 2003] Swinbank A.M. et al., 2003, ApJ, 598, 162
- [Tully & Fisher 1977] Tully R.B., Fisher J.R., 1977, A&A, 54, 661
- [Tully & Fouque 1985] Tully R.B., Fouqué P., 1985, ApJS, 58, 67
- [Tully & Pierce 2000] Tully R.B., Pierce M.J., 2000, Apj, 533, 744
- [Vogt et al. 1996] Vogt N.P., Forbes D.A., Phillips A.C., Gronwall C., Faber S.M, Illingworth G.D., Koo D.C., 1996, ApJ, 465L, 15
- [Vogt et al. 1997] Vogt N.P. et al., 1997, ApJ, 479, 121