Gamma-Ray All-Sky Imaging with BATSE
Abstract
The BATSE mission aboard CGRO observed the whole sky for 9 years in the 20 keV - 2 MeV energy band. Flat-fielding of the temporal variations in the background present in the data set has been accomplished through a GEANT3 Monte-Carlo simulation - the BATSE Mass Model (BAMM). The Earth Occultation technique (EOT) is used together with a maximum-likelihood imaging approach to construct all-sky maps with mCrab sensitivity. Additionally, a non-linear CLEAN algorithm is applied to the all-sky maps to remove large artefacts that are systematic of the EOT. The latest survey results produced through the application of this technique to a subset of the BATSE data set are presented.
keywords:
gamma-rays; survey; BATSE1 Introduction
BATSE was developed to detect and locate -ray bursts. The individual BATSE detectors have no positional sensitivity and hence the position of a -ray burst was obtained by triangulation between detectors. However, before launch it was realised that persistent -ray sources could be monitored by using the EOT (Harmon et al., 2002). As a source sets below the Earth’s horizon a downward step is seen in the detector count rates. The height of a step gives a direct measurement of the source flux.
The capability to generate an image has many advantages over simple measurements of source fluxes. In high energy astronomy all-sky images have been produced between 0.1 - 2 keV by ROSAT (Snowden et al., 1997) and 1 MeV by COMPTEL (Oberlack et al., 1996), however there is little information regarding the intervening range, consisting almost entirely of data from the HEAO-1 A4 experiment of 1978-79 (Levine et al., 1984). The 9 uninterupted years of all-sky monitoring by BATSE therefore provides a wealth of additional information.
2 Generating All-Sky Maps
Mass Modelling is a technique to simulate the background radiation experienced by a space craft (Dean et al., 2003). The BATSE Mass Model is a GEANT3 Monte-Carlo simulation code which simulates the expected background rate from cosmic diffuse -rays, atmospheric albedo -rays and cosmic-ray interactions. This model has been used to flat-field the entire 9 year BATSE data archive (Shaw et al., 2003).
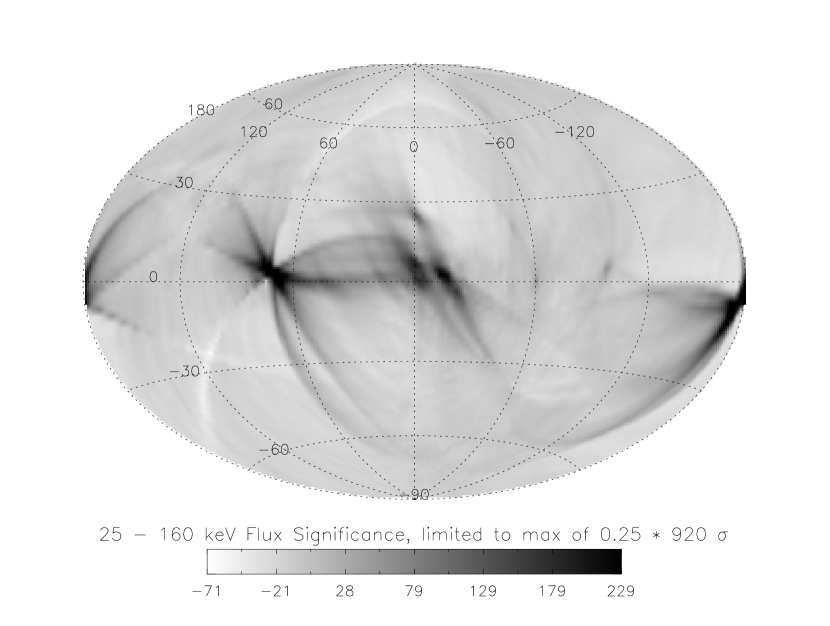
Each day in the data set is then used to create an all-sky map using the LIMBO (Likelihood Imaging Method for BATSE Occultation) code developed at Southampton (Shaw et al., 2001). Daily images have now been generated based on all 9 years of data in 7 energy channels covering the energy range 25-160 keV. These images further enable the compilation of long time scale all-sky maps. The Earth’s limb, as seen by BATSE, is 140 in diameter and hence creates image artefacts which must be cleaned using a non-linear CLEAN algorithm. The CLEAN algorithm operates by defining two maps, the raw map and the cleaned map. The cleaned map is of the same dimensions as the raw map but is intially empty. The algorithm then searches for the brightest pixel in the raw map and generates the expected PSF for a source at this position. A specified fraction of the PSF is then subtracted from the raw map and the total flux which is removed is convolved with an ideal PSF and added to the cleaned map. The algorithm then searches for the next brightest pixel and iteratively removes sources from the raw map and places them into the cleaned map. A similar CLEAN algorithm has been used in radio interferometry for many years. A full description of the CLEAN algorithm is beyond the scope of this article but is descriped in detail in Shaw et al. (2004). The cleaned map is then searched for sources using the SExtractor software (Bertin & Arnouts, 1996).
3 Survey Results and Spectra
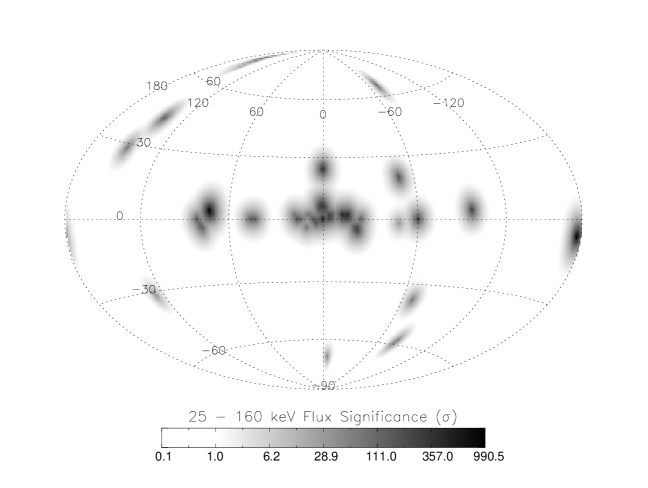
The longest map currently compiled and cleaned consists of 500 days of data summed over 7 energy channels and is shown in Fig 2. It clearly suffers from 2x 2 pixel size, which makes identification of individual sources in crowded regions, such as the galactic centre, impossible. This represents only 15 of the available data set which is currently being analysed. The map yields a peak significance of 990, which corresponds to the position of the Crab Nebula. The 5 sensitivity limit is 5mCrab (Shaw et al., 2004).
Two maps were produced for use with SExtractor; one contained only the cleaned components and is seen in Fig 2 and the other contains the cleaned components with the residual flux from the raw map added back in, the latter being the more scientifically realistic. Using SExtractor on the latter map produced the source list shown in Table 1. In crowded regions of the sky multiple sources are listed as candiates as their known positions all fall within a single pixel. The fluxes listed are the total flux over the 500 days from that detection position normalised to the Crab flux. However, a number of sources in Fig 2 were not detected by SExtractor. These missing sources were extracted by guiding SExtractor with the positions generated in the cleaning algorithm and are listed in Table 2. These flux detections cannot be independently measured and so should only be taken as indicatiing the possibility of sources at these locations. It should be noted however, that forcing SExtractor to extract at a position where there is no source returns a zero flux.
Additionally, images of the same period of 500 days have been generated in a number of different energy channels allowing energy spectra to be extracted. A sample of different source spectra is shown in Figs. 3- 4, together with a 10 mCrab source spectrum.
In Fig 2, M82 is detected at the level of 14 mCrab. This was unexpected as previous missions have not observed such emission of this level. However, when the energy spectrum of M82 is extracted the emission is principally from those energy channels above 70 keV. The Mass Model is most accurate at this energy level and this may indicate that the detection is real and not an artefact generated by the cleaning process. This should be resolved once the entire 9 year data set is imaged and cleaned.


4 Discussion and Future Work
The first true all-sky image of the -ray sky since HEAO1-A4 has been produced in a single 25-160 keV energy band. The all-sky map is based upon 500 days of data and shows the locations of 30 known -ray sources which are also listed in Tables 1 2. The diagonal size of one image pixel is 2.8, hence any source which has a positional error less than this lies in the expected pixel. The vast majority of sources which we have associated with our detections have positional errors less than 2.8, in several cases there are multiple sources which can be easily associated with a single pixel. However, there are also a number of sources, particularly ESO 198-24, NGC 7582 and Mkn 78 in Table 2, which lie much further away than 2.8 from their expected position. In these cases the nearest known high energy source is listed.
In addition, it has been possible to generate maps in 7 narrower energy channels and hence extract time-averaged energy spectra of the brighter sources. Work is progressing to compile all 9 years of the BATSE data into a single map which should have a 5 sensitivity of 2 mCrab. For any source brighter than 6 mCrab in the overall cleaned map it should be possible to extract out a time average energy spectrum from the maps constructed in the 7 narrow energy bands.
The team at Marshall Space Flight Center (MSFC) recently produced a BATSE earth occultation catalogue of low-energy -ray sources (Harmon et al., 2004). This catalogue is based on the standard EOT on data which has not been flat-fielded. As a result sources are pre-selected for measurement and the background is assumed to be smooth and fit by a second order polynomial on a short section of data surrounding each source occultation. Once 9 year data set is imaged, cleaned and a complete catalgue generated it will be possible to perform a complete comparison with the MSFC catalogue. It is interesting to note that on the currently analysed sample of data there are detections, such as in the vicinity of M82, which are not seen by the MSFC standard EOT.
| Measured Position | Source Name | Known Position | Position Error | BATSE Flux |
|---|---|---|---|---|
| (l,b) | (l,b) | (degs) | (mCrab) | |
| (71.9, 3.8) | Cygnus X-1 | (71.34, 3.07) | 0.9 | 1142 18 |
| (-175.9, -5.9) | Crab | (-175.44, -5.78) | 0.5 | 1000 17 |
| (0.0, 6.9) | GRO J1719-24 | (0.18, 7.02) | 0.2 | 214 9 |
| H 1705-250 | (-1.41, 9.06) | 2.6 | ||
| (-12.0, 2.0) | 4U 1700-377 | (-12.2, 2.2) | 0.3 | 209 8 |
| GX 349+2 | (-10.90, 2.74) | 1.3 | ||
| (-2.0, 0.9) | GRS 1734-292 | (-1.11, -1.41) | 1.0 | 201 9 |
| H 1743-322 | (-2.87, -1.61) | 2.7 | ||
| (0.0, 0.2) | XTE J1748-288 | (0.68, -0.22) | 0.8 | 180 8 |
| 1E 1740.7-2942 | (-0.88, -0.11) | 0.9 | ||
| GX 359+2 | (-0.43, 1.56) | 1.4 | ||
| GX 3+1 | (2.29, 0.79) | 2.4 | ||
| (-16.0, 2.0) | OAO 1657-415 | (-15.64, 0.31) | 1.7 | 128 7 |
| (0.1, 24.0) | Sco X-1 | (-0.90, 23.78) | 0.9 | 114 7 |
| (-21.5, -4.7) | GX 339-4 | (-21.06, -4.33) | 0.6 | 93 6 |
| (-96.3, 3.7) | Vela X-1 | (-96.94, 3.93) | 0.7 | 83 6 |
| (16.7, 1.4) | GX 17+2 | (16.44, 1.28) | 0.3 | 77 8 |
| (122.0, -30.0) | Mkn 348 | ( 122.27, -30.91) | 0.9 | 51 8 |
| (4.6, -1.4) | GX 5-1 | (5.07, -1.02) | 0.6 | 46 5 |
| (44.3, 0.0) | GRS 1915+105 | (45.40, -0.23) | 1.1 | 43 5 |
| (-2.00, 6.0) | GRO J1719-24 | (0.14, 6.99) | 2.4 | 42 5 |
| (-60.00, 0.0) | GX 301-2 | (-59.90, -0.04) | 0.1 | 42 4 |
| (80.00, 0.6) | Cygnus X-3 | (79.84, 0.69) | 0.2 | 36 5 |
| (-50.00, 19.5) | Centaurus A | (-50.48, 19.42) | 0.5 | 33 5 |
| (-158.83, -4.0) | H 0614+091 | (-159.11, -3.38) | 0.7 | 31 8 |
| (-24.00, 0.0) | H 1624-490 | (-25.08, -0.26) | 1.1 | 17 3 |
| (156.00, 76.0) | NGC 4151 | (155.08, 75.06) | 1.0 | 16 3 |
| (138.00, 42.0) | M 82 | (141.41, 40.57) | 2.9 | 14 3 |
| (-70.00, 66.0) | 3C 273 | (-70.05, 64.36) | 1.6 | 12 3 |
| Measured Position | Source Name | Known Position | Position Error | BATSE Flux |
|---|---|---|---|---|
| (l,b) | (l,b) | (degs) | (mCrab) | |
| (-79.0, -59.0) | ESO 198-24 | (-88.36, -57.95) | 5.0 | 62 8 |
| (-5.0, -70.0) | NGC 7582 | (-11.92, -65.70) | 5.1 | 55 8 |
| (146.1, 28.0) | Mkn 78 | (151.10, 29.78) | 5.0 | 40 6 |
| (-68.0, -38.0) | 4U 0357-74 | (-71.42, -37.29) | 2.8 | 38 6 |
| (-47.9, -2.0) | Circinus Galaxy | (-48.67, -3.81) | 2.0 | 28 5 |
| (76.8, -2.0) | EXO 2030+375 | (77.15, -1.24) | 0.8 | 22 5 |
References
- Bertin & Arnouts (1996) Bertin, E. & Arnouts, S., 1996, A&AS, 117, 393
- Dean et al. (2003) Dean, A. J., Bird, A. J., Diallo, N., et al. 2003, Space Science Reviews, 105, 285
- Harmon et al. (2002) Harmon, B. A., Fishman, G. J., Wilson, C. A., et al., 2002, ApJS, 138, 149
- Harmon et al. (2004) Harmon, B. A., Wilson, C. A., Fishman, G. J., et al., 2004, ApJS preprint doi:10.1086/421940
- Levine et al. (1984) Levine, A. M., Lang, F. L., Lewin, W. H. G., et al., 1984, ApJS, 54, 581
- Oberlack et al. (1996) Oberlack, U., Bennett, K., Bloemen, H., et al., 1996, A&AS , 120, 311
- Shaw et al. (2001) Shaw, S. E., Bird, A. J., Dean, A. J., et al., 2001, in Exploring the Gamma-Ray Universe: Proceedings of the 4th INTEGRAL Workshop, Alicante, 2000, ed. A. Gimenez, V. Reglero, & C. Winkler, Vol. ESA SP-459, 521–524
- Shaw et al. (2003) Shaw, S. E., Westmore, M. J., Bird, A. J., et al., 2003, A&A, 398, 391
- Shaw et al. (2004) Shaw, S. E., Westmore, M. J., Hill, A. B., et al., 2004, A&A, 418, 1187
- Snowden et al. (1997) Snowden, S. L., Egger, R., Freyberg, M. J., et al., 1997, ApJ, 485, 125