An extreme, blueshifted iron line profile in the Narrow Line Seyfert 1 PG 1402+261; an edge-on accretion disk or highly ionized absorption?
Abstract
We report on a short XMM-Newton observation of the radio-quiet Narrow Line Seyfert 1 PG 1402+261. The EPIC X-ray spectrum of PG 1402+261 shows a strong excess of counts between keV in the rest frame. This feature can be modeled by an unusually strong (equivalent width 2 keV) and very broad (FWHM velocity of 110000 km s-1) iron K-shell emission line. The line centroid energy at 7.3 keV appears blue-shifted with respect to the iron K emission band between keV, while the blue-wing of the line extends to 9 keV in the quasar rest frame. The line profile can be fitted by reflection from the inner accretion disk, but an inclination angle of is required to model the extreme blue-wing of the line. Furthermore the extreme strength of the line requires a geometry whereby the hard X-ray emission from PG 1402+261 above 2 keV is dominated by the pure-reflection component from the disk, while little or none of the direct hard power-law is observed. Alternatively the spectrum above 2 keV may instead be explained by an ionized absorber, if the column density is sufficiently high ( cm-2) and if the matter is ionized enough to produce a deep () iron K-shell absorption edge at 9 keV. This absorber could originate in a large column density, high velocity outflow, perhaps similar to those which appear to be observed in several other high accretion rate AGN. Further observations, especially at higher spectral resolution, are required to distinguish between the accretion disk reflection or outflow scenarios.
1 Introduction
PG 1402+261 is a type-I radio-quiet quasar at z=0.164 (Schmidt & Green, 1983). It emits narrow optical permitted lines with FHWM (H)=1910 km s-1 and can also be classified as a Narrow Line Seyfert 1 (NLS1), which are defined to have FWHM (H) km s-1 (Osterbrock & Pogge, 1987). The mass of the supermassive black hole in this quasar has been estimated to be 2107 M⊙ and the bolometric luminosity is about 1.31045 erg s-1 (Woo & Urry, 2002). This leads to a high accretion rate relative to Eddington of about 50 (Porquet et al., 2004). PG 1402+261 was previously observed in X-rays with Beppo-SAX by Mineo et al. (2000). They found that the data were satisfactorily represented by a broken power law continuum of and for the soft and hard X-ray bands, respectively, although there was some evidence for an excess of counts above 7 keV in the MECS spectrum. A preliminary analysis of a recent (2002) XMM-Newton observation of PG 1402+261, reported by Porquet et al. (2004) among a sample of PG quasars, shows that the spectrum cannot be represented by a simple broken power-law continuum alone, but exhibits a large deviation between keV in the quasar rest frame, in the form of an apparent broad and blue-shifted iron K emission line. This observation adds to the number of AGN (and NLS1s in particular) that appear to exhibit unusually strong emission or absorption features above 7 keV in the iron K-shell band; e.g. 1H 0707-495 (Boller et al., 2002), IRAS 13224-3809 (Boller et al., 2003), PDS 456 (Reeves, O’Brien & Ward, 2003) and PG 1211+143 (Pounds et al., 2003). These iron K band features have either been interpreted as the signature of enhanced reflection from the inner accretion disk, e.g. 1H 0707-495 (Fabian et al., 2004) but in some cases may also be interpreted as evidence for an additional high column density absorber, either from matter partially covering the X-ray source (Gallo et al., 2004; Tanaka et al., 2004) or even from a high velocity () outflow (Pounds et al., 2003; Reeves, O’Brien & Ward, 2003).
Here we present a spectral analysis of the XMM-Newton observation of PG 1402+261, modeling the strong iron K-band emission (or absorption) feature. We investigate the possible physical origins for this feature; either in the form of an extreme broadened iron emission line produced via X-ray reflection from accretion disk or alternatively a very high column density ionized absorber. Note that all fit parameters are given in the quasar rest frame, with values of H0=75 km s-1 Mpc-1, and q0=0.5 assumed throughout. Errors are quoted at 90% confidence (e.g. , for 1 parameter of interest).
2 The XMM-Newton observation
PG 1402+261 was observed by XMM-Newton on 2002 February 27 (OBSID: 0109081001), with an exposure time of only 9.1 ks. Data were taken with the EPIC pn and MOS CCDs (Strüder et al., 2001; Turner et al., 2001), in Large Window Mode with the thin filter. The data was reduced using version 5.4.1 of the XMM-SAS software. Data were selected using event patterns 0-4 and 0-12 for pn and MOS respectively, whilst only good X-ray events (with ‘FLAG=0’) were included. The source spectra were extracted from a circular source region of ′′ radius, whilst background spectra were extracted from a box of 1.85′ radius around the source, but excluding the circular source region. Response matrices and ancillary response files were generated using the SAS tasks rmfgen and arfgen respectively. EPIC-pn lightcurves were also extracted over two energy bands, however no dramatic variability was observed, therefore the spectral analysis is performed on the whole XMM-Newton exposure.
3 X-ray spectral analysis
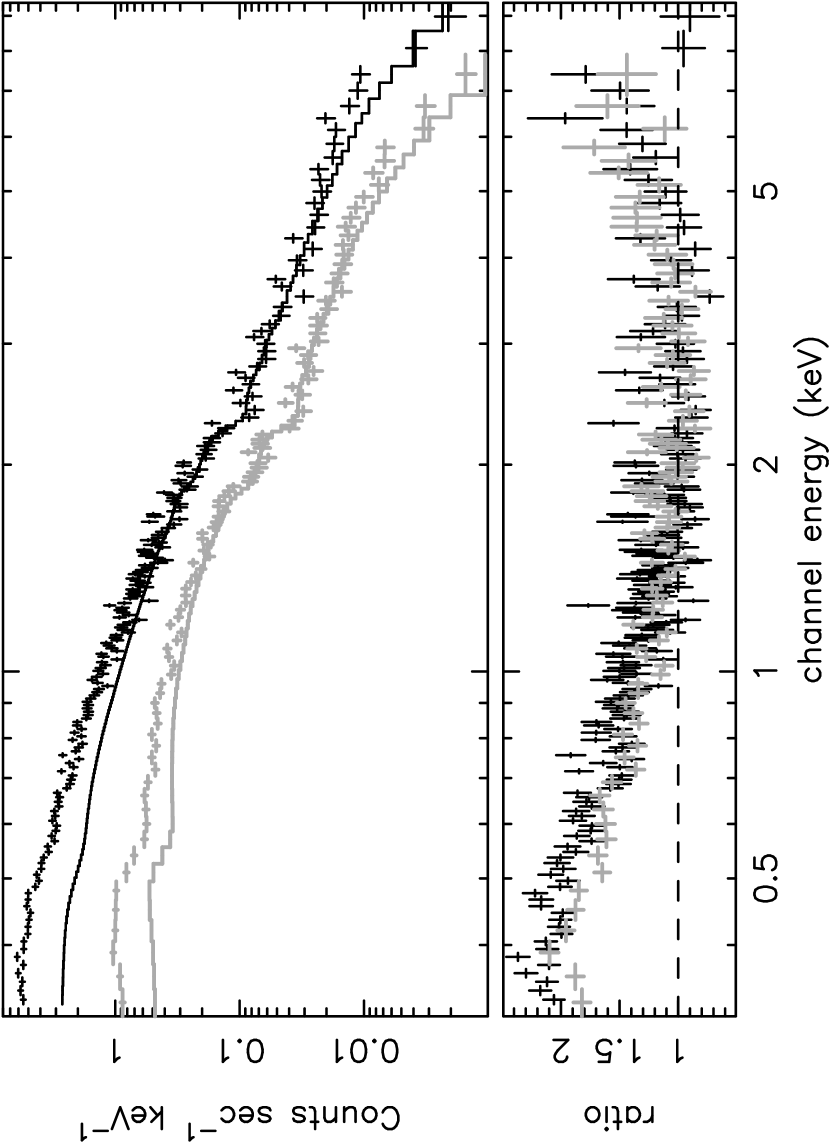
In all subsequent fits, the column density is fixed to the
Galactic value, i.e, 1.47 1020 cm-2. Both the EPIC-pn
and the co-added MOS spectra are shown in Figure 1, with the data/model ratio
residuals plotted against a power-law continuum of photon index
fitted in the keV band. A
strong soft excess is present below 2 keV and the continuum shape can be
parameterized by a simple broken power-law, with a soft index of
and a hard index of
above a break energy of keV.
A hard excess is also clearly observed above 5 keV in both the
pn and MOS detectors.
For this broken-powerlaw continuum,
the unabsorbed 0.3–10 keV (2–10 keV) band flux is
7.310-12 erg cm-2 s-1
(1.810-12 erg cm-2 s-1),
with a corresponding luminosity of 4.41044 erg s-1
(1.01044 erg s-1). About 77 of the flux is emitted
below 2 keV, consistent with the strong soft X-ray excess. Note that at this
flux level, photon pile-up of the source X-ray spectrum is negligible.
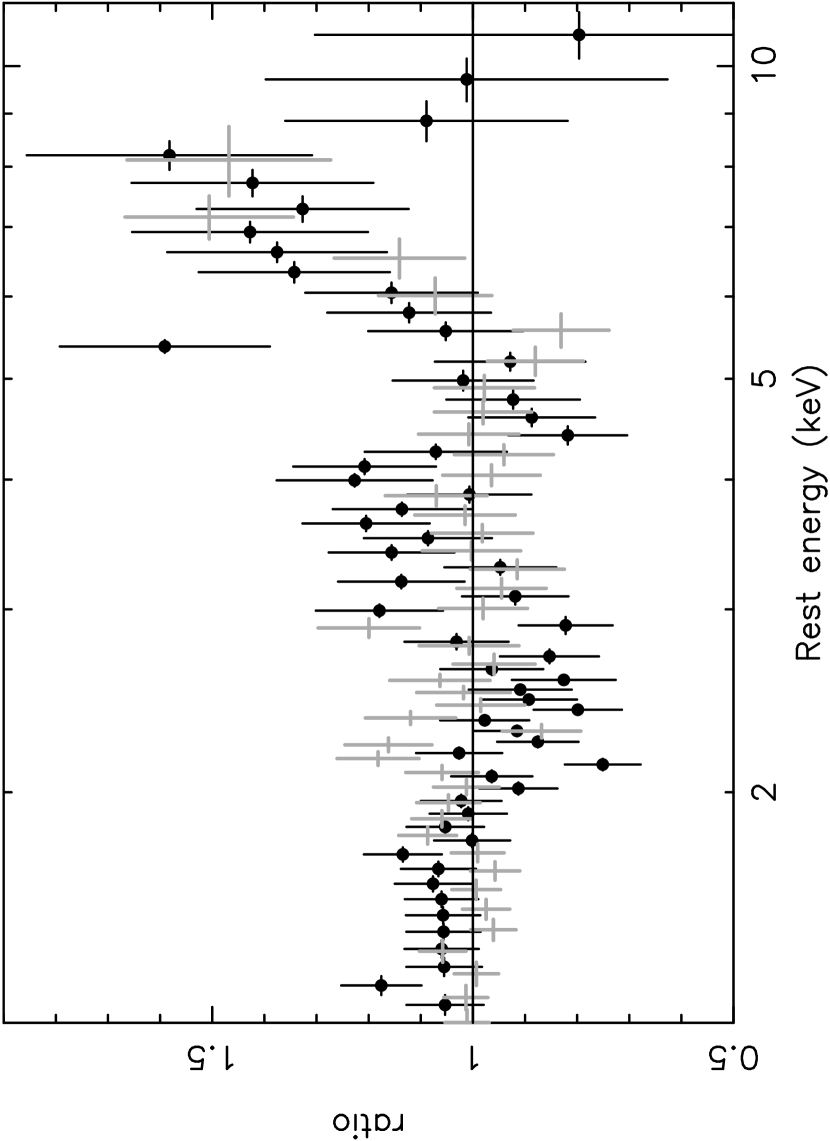
As the pn spectrum contains significantly more counts than the MOS above 6 keV in the iron K band, we now concentrate on the pn spectral analysis. Figure 2 shows the data/model ratio to the broken-power-law continuum, plotted from 3-11 keV in the quasar rest frame. Notice that the majority of the flux of the iron K band feature is observed above 7 keV, i.e. above the rest energy for H-like iron, whilst a sharp drop in the spectrum is observed at 9 keV in the rest frame. A single broad Gaussian emission line models the hard excess rather well, with a centroid energy of keV, a line width of keV (FWHM velocity of km s-1) and a very high equivalent width of keV. The fit statistic is acceptable, with (where dof is the number od degrees of freedom), with the feature detected at significance according to an F-test, whilst the line centroid is formally consistent with emission from hydrogen like iron (at 6.97 keV).
It might be reasonable to expect a strong reflected continuum to accompany the iron line in PG 1402+261. Therefore we performed a spectral fit using an X-ray continuum model based on ionized reflection from the inner accretion disk, using the pexriv model within xspec (Magdziarz & Zdziarski, 1995). We assume a disk inclination angle of 60 degrees (see section 3.2 for more detailed reflection fits), a disk temperature of K and use solar abundances, which are kept fixed in the spectral fit. A broad Gaussian emission line is also included in the fit, as the pexriv model contains only the reflected continuum and not the iron emission line. The reflected continuum is smoothed with a Gaussian function, identical in width to the broad iron line. The strength of the reflector is conventionally defined as the ratio of the solid angle subtended by the reflecting material to steradian, whilst the ionization parameter is defined as , where n is the density of the reflector and is the ionizing flux integrated over the 5 eV to 20 keV band. The fits results are shown in Table 1, fit 1. The reflection model provides an acceptable fit with and a relatively high ionization parameter of log erg cm s-1. In this model, the continuum emission in PG 1402+261 is parameterized with a single, steep power-law of , whilst the highly ionized matter is sufficiently reflective at lower energies to model the soft excess below 2 keV. Note that the reflection fits are largely insensitive to the iron abundance, as the iron K shell edge present in the continuum reflection spectrum is highly smeared. Even upon the addition of the reflector, the properties of the iron line are largely unchanged, with the equivalent width now being slightly lower at keV.
In Figure 2, it appears that there may be two peaks within the XMM-Newton line profile of PG 1402+261, one near 7.0–7.5 keV and the other near 8.5 keV. For instance one line may originate from Fe xxvi K (at 7.0 keV), the other peak from Fe xxvi K or Ni xxviii K (near 8.0 keV). To parameterize this, we fitted the iron line profile of PG 1402+261 with two Gaussian lines, one with a rest energy of keV (i.e. consistent with Fe xxvi K) and another line at keV. For this fit, we revert to the simple broken power-law continuum (without reflection), as described above. The equivalent width of the line at 7.1 keV line is much stronger than the higher energy line (1.3 keV vs 0.4 keV). The fit is only slightly improved for the addition of three extra parameters compared to a single Gaussian line fit ( vs 390.5/377), therefore we consider the 2 Gaussian line fit to be an over-parameterization of the data. Nonetheless we do not rule out an additional contribution towards the line from either Fe K or Ni K. A further, much longer observation will be required with XMM-Newton in order to investigate structure within the line profile.
3.1 Comparison with a previous ASCA observation.
PG 1402+261 was also previously observed by ASCA on January 12, 2000. The ASCA data are composed of the SIS0 (exposure time 43.2 ks), SIS1 ( 37.7 ks), GIS2 and GIS3 (each 57.3 ks) data. The background subtracted source spectra were subsequently analyzed, using a minimum of 20 counts per spectral bin. Figure 3 shows the data/model ratio of the GIS and SIS data from keV to a simple power-law model with Galactic absorption, plotted in the quasar rest frame. There is a clear “line-like” excess in the data between 6–8.5 keV in the rest frame, similar to the residuals observed in the XMM-Newton spectrum of PG 1402+261. Subsequently, a fit above 1 keV using all four detectors, with a single power-law () plus a broad emission Gaussian line, gives a reasonable representation of the data (/d.o.f=404.2/361, null hypothesis probability of ) and the line is required at a confidence level of 99.95. The energy of the line is 7.2 keV and its width is high with =0.8 keV. The energy of the line is consistent with emission from He-like or H-like iron (at 6.7 and 6.97 keV respectively). Note that there are no other apparent residuals present in the spectrum below the iron K line energy. The EW of keV is lower than found during the XMM-Newton observation, but is compatible within the errors. During the ASCA observation the 2–10 keV unabsorbed flux was 2.510-12 erg cm-2 s-1 (SIS0), i.e. about 40 higher than the XMM-Newton observation.
The addition of a reflection component to the model (the pexriv model as described above) does not strongly effect the line properties (see Table 1, fit 2). As the constraints on the reflected continuum from the ASCA data are worse than for XMM-Newton, the ionization parameter was fixed at log erg cm s-1, whilst R was fixed at 2 (i.e. the maximum permitted value, corresponding to steradian solid angle). The effect on the line is to slightly reduce its equivalent width, whilst the line width is then poorly constrained ( keV) when the reflected continuum is included in the model.
3.2 A broad disk emission line?
Given the large width of the emission line in the XMM-Newton (and ASCA) fits, we attempted to fit the iron line profile with emission from the inner accretion disk around a Kerr black hole, using the xspec laor model (Laor, 1991). An ionized reflection component was also included in the fits, in order to model the reflected continuum emission from the surface of the accretion disk. The reflected continuum is relativistically smeared using identical parameters as in the disk emission line model. We assume an inner radius of (, i.e. one gravitational radius) and an outer radius of . Initially we fix the disk inclination angle at , reasonable for a type I AGN. We obtain a very high line energy of 8.5 keV, required to fit the blue-wing of the line between keV, whilst the line equivalent width is extremely large at keV, relative to the power-law continuum at 8.7 keV (Table 1, fit 3). The line energy is considerably larger than the rest energy of H-like iron (6.97 keV), therefore this could indicate a significant outflow of the medium producing the line, i.e. 0.3–0.4 c (90 000–120 000 km s-1), for H-like or neutral iron respectively. As an alternative model, we free the disk inclination angle, but instead fix the rest energy of the iron line emission at 6.97 keV, i.e. corresponding to H-like iron. This then requires a large disk inclination of degrees in order to fit the blue-wing of the line, although the fit is equally acceptable (Table 1, fit 4), with an equivalent width of keV. Thus either a substantial outflow of the line emitting matter is required, or the disk has to be highly inclined to the line of sight.
Given the evidence for a very strong broad line in PG 1402+261, we tested whether the spectrum and line profile could be fitted with an ionized disk reflection model. We use the model xion from Nayakshin, Kazanas, & Kallman (2000) in the simplest lamppost configuration to model the emission above 2 keV, together with a soft featureless power-law component to model the steep soft X-ray excess in PG 1402+261. We fixed the height of the source above the disk to , the inner and outer disk radii to (the minimum the model allows) and respectively. The accretion rate was fixed to 50% of Eddington, whilst the ratio of X-ray to disc (UV) luminosity was set to 10% (Porquet et al., 2004). We find the reflection model fits the spectrum well with =3.11 and =1.70 for the continuum photon indices and a fit statistic of . The unfolded spectral fit is shown in Figure 4. Although the model produces mainly He and H-like Fe emission (at 6.7 keV and 6.97 keV respectively), a high disk inclination of greater than 60∘ is required to model the extreme blue-shift of the line. In addition, a high iron abundance of solar (the maximum permitted value) is required, whilst in order to model the extreme strength of the line, the hard emission component is required to be reflection dominated, i.e. the illuminating hard power-law component cannot be directly observed.
As a consistency check, we compare the reflection results obtained with the xion model with the predictions of Ballantyne, Fabian & Ross (2004) who compute reflection spectra from a constant density slab, illuminated by a power-law continuum. In their model, for pure reflected emission (i.e. with no direct power-law observed), a line equivalent width of 1.5 keV in PG 1402+261 requires an iron over-abundance of solar, assuming a reflection ionization parameter of log and an illuminating power-law continuum of . This appears to be consistent with the reflection fits presented above. In the scenario where both the primary power-law and reflected emission are both observed (corresponding to the reflector covering steradian solid angle), then the predicted line is not strong enough to account for the iron line feature in PG 1402+261. Even for a solar abundance of iron, the maximum predicted equivalent width is eV. Thus it is likely that the X-ray emission from PG 1402+261 would have to be reflection dominated to explain the apparent strong iron line in the XMM-Newton data.
3.3 Highly Ionized Absorption in PG 1402+261?
Alternatively, we have investigated whether the strong iron K feature can be modeled with a highly ionized absorber. One can fit the spectrum reasonably well with a continuum modeled by two power-laws ( and ), although the hard power-law has to be very flat to model the hard excess above 5 keV. The addition of an absorption edge at keV, with a depth of , models the sharp drop at 9 keV in the rest frame (Figure 2), with a fit statistic of . The energy of the K-shell edge then either corresponds to H-like iron (at 9.27 keV) or He-like iron (at 8.75 keV).
We then proceed to fit the data with the xspec warm absorber model absori (Done et al., 1992). The model is applied so that the soft X-ray power-law (which may for instance originate directly from the disk) is unattenuated, but so the hard X-ray power-law is modified by the absorber (i.e. a partial coverer). In order to model the depth of the edge a large column density of cm-2 is required. Formally, the 90% confidence lower-limit obtained on the ionization parameter from this model is log erg cm s-1, with an outflow velocity of km s-1, whilst the column density must exceed cm-2 (assuming solar abundance). The best fit model is shown in Figure 5, whilst the fit obtained is equally as good as the disk reflection model (). Inclusion of the warm absorber results in there now only being a requirement for a narrow iron K emission line, with an equivalent width of eV. The line centroid energy is keV, which indicates that there may still be some blue-shift of this component; e.g., km s-1 compared to the rest-frame energy of H-like Fe at 6.97 keV.
The partial covering model can also be applied to the ASCA spectrum of PG 1402+261. The fit obtained is equally good as the broad line fit reported in section 3.1 (fit statistic ). As above, the partial absorber covering is applied to the hard power-law, whilst a column density of cm-2 and an ionization parameter of log erg cm s-1 are required, similar to the values obtained above.
4 Discussion and Conclusions
The X-ray spectrum of PG 1402+261 shows a strong excess in the iron K-shell band between keV. If this is due to a relativistic disk line, then its parameters are rather extreme. The line equivalent width measured by XMM-Newton is keV, even stronger than the broad iron line observed in MCG -6-30-15 (Tanaka et al., 1995; Wilms et al., 2001; Vaughan & Fabian, 2004). Such a strong iron K emission line can only be produced if the hard X-ray emission in PG 1402+261 is dominated by the disk reflection component, with little of the direct hard power-law being observed. Furthermore the rest-energy of the line, peaking above 7 keV and extending up to 9 keV, implies that the accretion disk is likely to be observed at large inclination angles, i.e. . Such a high inclination is unusual for a type I AGN in the context of AGN unification schemes (Antonucci, 1993). Interestingly a high (50 degrees) inclination was recently inferred from the reflection fits to the NLS1 galaxy, 1H 0707-495 (Fabian et al., 2004). Taken together, the high inclination angle required in the reflection fits for both PG 1402+261 and 1H 0707-495 may argue against the pole-on model for some NLS1s (Bian & Zhao, 2004).
It is possible that large density perturbations in the disk could explain the strong reflection dominated emission above 2 keV. Variations of up to in density have predicted from simulations of highly turbulent disks (Turner, Stone & Sano, 2002), whilst reflection spectra have been calculated for inhomogeneous disks (Ballantyne, Turner & Blaes, 2004). Thus a natural geometry could occur whereby the direct hard X-ray emission (e.g. from compact coronal flares) is obscured by dense, turbulent clouds within the disk surface layers, the same clouds then reflect the X-rays into the line of sight (Guilbert & Rees, 1988). A similar geometry was applied by Fabian et al. (2002) to the Narrow Line Seyfert 1, 1H 0707-495, which shows an unusually strong iron K edge at 7.1 keV. Fabian et al. (2002) propose that the hard X-rays could be emitted within low density cavities between dense rings of matter on the disk surface; the ring surfaces then reflect the X-rays into the observers line of sight, whilst the direct emission is obscured, producing a strong iron K line. In PG 1402+261, the direct X-rays are more likely to be obscured if the disk was viewed at large (side-on) inclination angles, as is inferred from our accretion disk fits. The soft X-ray (and EUV) excess emission may not be obscured however, if this is the Comptonized thermal emission from the extended inner disk region (Malkan & Sargent, 1982; Czerny & Elvis, 1987), although the enhanced (reflected) emission from the surface of the ionized disk may also contribute towards the soft X-ray excess.
In the inhomogeneous reflection models of Ballantyne, Turner & Blaes (2004), the authors find that it may be difficult to produce a very strong iron line. However this is dependent on the geometry, if the reflected X-rays undergo multiple scattering (i.e. the reflected X-rays are themselves reflected), then the resultant line equivalent width can be very high (Ross, Fabian & Ballantyne, 2002), as large as 6 keV.
One other possibility is that the disk reflection is enhanced by the effects of gravitational light bending of the hard X-ray emission towards the disk, i.e. returning radiation (Cunningham, 1975). This effect will be strongest when the X-rays are concentrated within around the spin axis of a maximally rotating black hole (in the so-called ”lamppost” configuration). Indeed it has been suggested that the strong, redshifted iron line in MCG -6-30-15 may be boosted by this process (Martocchia, Matt & Karas, 2002; Fabian & Vaughan, 2003). However in order to explain the observed blueshift of the iron line profile, especially as a significant amount of the line flux would be gravitationally redshifted below 6 keV in the above scenario, then the disk inclination angle in PG 1402+261 must be nearly side-on.
Alternatively, the spectrum of PG 1402+261 can also be modeled by a high column density, high ionization absorber, where the sharp drop at 9 keV in the spectrum can be fitted by a high ionization (He or H-like) K-shell edge of iron. Both the column density and ionization of the absorber have to be rather extreme ( cm-2 and log erg cm-1 s-1 respectively), to produce a iron K-shell edge at 9 keV. Indeed Gallo et al. (2004) have recently interpreted the strong Fe K edge in the XMM-Newton X-ray spectra of 1H 0707-495 as due to a variable partial covering absorber and suggest that extreme disk reflection may not be required. Additionally, other high column density iron K-shell absorbers, with similar absorber parameters to PG 1402+261, have recently been observed in XMM-Newton and Chandra observations of several high luminosity AGN; in particular PDS 456 (Reeves, O’Brien & Ward, 2003), PG 1211+143 (Pounds et al., 2003), PG 1115+080 (Chartas, Brandt & Gallagher, 2003) and APM 08279+5255 (Chartas et al., 2002; Hasinger, Schartel, & Komossa, 2002). The outflow velocities inferred in these absorbers were generally found to be extreme, of up to 0.1c. Interestingly a narrow blue-shifted iron K emission line at 7.5 keV has been noted in the ASCA spectrum of the NLS1, RX J0136.9-3510 (Ghosh et al., 2004), these authors suggest that the line may also originate in an outflow with a velocity of . Indeed one possibility is that the absorber arises from the innermost part of an high velocity accretion disk outflow, within a few () radii of the black hole. As noted by King & Pounds (2003), high velocity, large column density disk winds may be a natural consequence of accretion at a high fraction of the Eddington rate; in PG 1402+261 the accretion rate is of Eddington (Porquet et al., 2004).
Determining which model (reflection vs absorber) is the most plausible explanation for the iron K profile in PG 1402+261 is not possible with the current short XMM-Newton observation. However a high column density absorber may impart discrete spectral features that could be detected with a longer observation (with XMM-Newton) or with much improved spectral resolution (e.g. with the calorimeter-based XRS detector on Astro-E2, due for launch in 2005). For instance, resonant K-shell absorption lines from Fe xvii through to Fe xxvi may be produced in high ionization gas, while a Fe K unresolved transition array (UTA) at 7.2 keV may arise from moderately ionized matter (Palmeri et al., 2002). Strong absorption lines may also be detected from other elements (e.g. Mg, Si and S), making it possible to constrain the kinematics of the outflow. Indeed strong, blue-shifted (by up to 0.1c) absorption lines were detected in the XMM-Newton observations of PG 1211+143 (Pounds et al., 2003) and resonant iron absorption lines may even affect the iron line profiles of some nearby Seyfert 1 galaxies; e.g., NGC 3783 (Reeves et al., 2004). Alternatively if the spectrum of PG 1402+261 can be explained by disk reflection, then it would be highly desirable to determine how the strong iron line changes with flux, in a much longer observation.
References
- Antonucci (1993) Antonucci, R. 1993, ARA&A, 31, 473
- Ballantyne, Fabian & Ross (2004) Ballantyne, D.R., Fabian, A.C., & Ross, R.R. 2004, MNRAS, 329, L67
- Ballantyne, Turner & Blaes (2004) Ballantyne, D.R., Turner, N.J., & Blaes, O.M. 2004, ApJ, 603, 436
- Bian & Zhao (2004) Bian, W., & Zhao, Y. 2004, MNRAS, in press (astro-ph/0405168)
- Boller et al. (2002) Boller, T., et al. 2002, MNRAS, 329, L1
- Boller et al. (2003) Boller, T., Tanaka, Y., Fabian, A.C., Brandt, W.N., Gallo, L., Anabuki, N., Haba, Y., & Vaughan, S. 2003, MNRAS, 343, L89
- Chartas et al. (2002) Chartas, G., Brandt, W.N., Gallagher, S.C., & Garmire, G.P. 2002, ApJ, 579, 169
- Chartas, Brandt & Gallagher (2003) Chartas, G., Brandt, W.N., & Gallagher, S. 2003, ApJ, 595, 85
- Cunningham (1975) Cunningham, P.T. 1975, ApJ, 202, 788
- Czerny & Elvis (1987) Czerny, B., & Elvis, M. 1987, ApJ, 321, 305
- Done et al. (1992) Done, C., Mulchaey, J.S., Mushotzky, R.F., & Arnaud, K.A. 1992, ApJ, 395, 275
- Fabian et al. (2002) Fabian, A.C., Ballantyne, D.R., Merloni, A., Vaughan, S., Iwasawa, K., & Boller, T. 2002, MNRAS, 331, L35
- Fabian & Vaughan (2003) Fabian, A.C., & Vaughan, S., 2003, MNRAS, 340, L28
- Fabian et al. (2004) Fabian, A.C., Miniutti, G., Gallo, L., Boller, Th., Tanaka, Y., Vaughan, S., & Ross, R.R, 2004, MNRAS, in press (astro-ph/0405160)
- Gallo et al. (2004) Gallo, L.C., Tanaka, Y., Boller, Th., Fabian, A.C., Vaughan, S., & Brandt, W.N., 2004, MNRAS, in press (astro-ph/0405159)
- Ghosh et al. (2004) Ghosh, K.K., Swartz, D.A., Tennant, A.F., Wu, K., & Ramsey, B.D. 2004, ApJ, 607, L111
- Guilbert & Rees (1988) Guilbert, P.W., & Rees, M.J. 1988, MNRAS, 233, 475
- Hasinger, Schartel, & Komossa (2002) Hasinger, G., Schartel, N., & Komossa, S. 2002, ApJ, 573, L77
- King & Pounds (2003) King, A.R., & Pounds, K.A. 2003, MNRAS, 345, 657
- Laor (1991) Laor, A. 1991, ApJ, 376, 90
- Magdziarz & Zdziarski (1995) Magdziarz, P., & Zdziarski, A.A. 1995, MNRAS, 273, 837
- Malkan & Sargent (1982) Malkan, M.A., & Sargent, W. 2003, ApJ, 254, 22
- Martocchia, Matt & Karas (2002) Martocchia, A., Matt, G., & Karas, V. 2002, A&A, 383, L23
- Mineo et al. (2000) Mineo, T., et al. 2000, A&A, 359, 471
- Nayakshin, Kazanas, & Kallman (2000) Nayakshin, S., Kazanas, D., & Kallman, T.R. 2000, ApJ, 537, 833
- Osterbrock & Pogge (1987) Osterbrock, D.E., & Pogge, R.W. 1987, ApJ, 323, 108
- Palmeri et al. (2002) Palmeri, P., Mendoza, C., Kallman, T.R., & Bautista, M.A. 2002, ApJ, 577, L119
- Porquet et al. (2004) Porquet, D., Reeves, J.N., O’Brien, P., & Brinkmann, W. 2004, A&A, in press (astro-ph/0404385)
- Pounds et al. (2003) Pounds, K.A., Reeves, J.N., King, A., Page, K., O’Brien, P.T., & Turner, M.J.L. 2003, MNRAS, 345, 705
- Reeves, O’Brien & Ward (2003) Reeves, J.N., O’Brien, P.T., & Ward, M. 2003, ApJ, 593, L65
- Reeves et al. (2004) Reeves, J.N., Nandra, K., George, I.M., Pounds, K.A., Turner, T.J., & Yaqoob, T. 2004, ApJ, 602, 648
- Ross, Fabian & Ballantyne (2002) Ross, R.R., Fabian, A.C., & Ballantyne, D. 2002, MNRAS, 336, L315
- Schmidt & Green (1983) Schmidt, M., & Green, R.F. 1983, ApJ, 269, 352
- Strüder et al. (2001) Strüder, L., et al. 2001, A&A, 365, L5
- Tanaka et al. (2004) Tanaka, Y., Boller, Th., Gallo, L., Keil, R., & Ueda, Y., 2004, PASJ, 56, L9
- Tanaka et al. (1995) Tanaka, Y., et al. 1995, Nature, 375, 659
- Turner et al. (2001) Turner, M.J.L., et al. 2001, A&A, 365, L27
- Turner, Stone & Sano (2002) Turner, N.J., Stone, J.M., & Sano, T. 2002, ApJ, 566, 148
- Vaughan & Fabian (2004) Vaughan, S., & Fabian, A.C. 2004, MNRAS, 348, 1415
- Wilms et al. (2001) Wilms, J., Reynolds, C.S., Begelman, M.C., Reeves, J., Molendi, S., Staubert, R., & Kendziorra, E. 2001, MNRAS, 328, L27
- Woo & Urry (2002) Woo, J. & Urry, C.M. 2002, ApJ, 579, 530


| Fit | aaPhoton index of power-law continuum. | bbRest frame energy or equivalent width of line in units of keV. | ccVelocity width () in units of keV. or ddEmissivity power-law of the accretion disk. or eeInclination of the accretion disk in degrees. | bbRest frame energy or equivalent width of line in units of keV. | ggReflection fraction (see text) | log hhLog ionization parameter (see text) | |
|---|---|---|---|---|---|---|---|
| Gaussian | 7.3 | 1.1 | 1.5 | 397.2/377 | |||
| Gaussiani | 7.2 | 0.6 | 2(f) | 3.0(f) | 399.1/361 | ||
| laor | 8.5 | 3.5 | 3.9 | 394.2/377 | |||
| 30∘ (f) | |||||||
| laor | 6.97(f) | 2.3 | 1.7 | 394.5/377 | |||
| ∘ |