Galactic foreground contribution to the BEAST CMB Anisotropy Maps
Abstract
We report limits on the Galactic foreground emission contribution to the Background Emission Anisotropy Scanning Telescope (BEAST) Ka- and Q-band CMB anisotropy maps. We estimate the contribution from the cross-correlations between these maps and the foreground emission templates of an H map, a de-striped version of the Haslam et al. 408 MHz map, and a combined 100 m IRAS/DIRBE map. Our analysis samples the BEAST declination band into 24 one-hour (RA) wide sectors with pixels each, where we calculate: (a) the linear correlation coefficient between the anisotropy maps and the templates; (b) the coupling constants between the specific intensity units of the templates and the antenna temperature at the BEAST frequencies and (c) the individual foreground contributions to the BEAST anisotropy maps. The peak sector contributions of the contaminants in the Ka-band are of 56.5% free-free with a coupling constant of K/R, and 67.4% dust with K/(MJy/sr). In the Q-band the corresponding values are of 64.4% free-free with K/R and 67.5% dust with K/(MJy/sr). Using a lower limit of 10% in the relative uncertainty of the coupling constants, we can constrain the sector contributions of each contaminant in both maps to % in 21 (free-free), 19 (dust) and 22 (synchrotron) sectors. At this level, all these sectors are found outside of the b region. By performing the same correlation analysis as a function of Galactic scale height, we conclude that the region within should be removed from the BEAST maps for CMB studies in order to keep individual Galactic contributions below % of the map’s rms.
1 INTRODUCTION
The study of the anisotropies in the Cosmic Microwave Background Radiation (CMB) angular distribution represents one of the most important and active areas in Cosmology today. Measurements of the CMB anisotropies provide an important probe to understand the mechanisms of structure formation in the early Universe. Unfortunately, these measurements are hampered by Galactic and extragalactic emissions which limit the accuracy of the measured CMB power spectrum. As for Galactic contribution, diffuse emission is mainly due to synchrotron, free-free (thermal Bremsstrahlung) and dust emissions. Thus, it is important to quantify the precise level of these contaminating foregrounds in order to distinguish them from the cosmological signal. The clear identification of the contribution of each individual contaminant of the CMB signal is a challenging astrophysical task.
Below GHz, the primary Galactic foreground contaminants are synchrotron and thermal Bremsstrahlung emission. Their spectral signature, , differ significantly from that of CMB fluctuations, since and . Therefore, multi-frequency measurements with a large enough signal-to-noise ratio can distinguish between foreground and CMB fluctuations. Above GHz, the primary contaminant is interstellar dust emission, whose spectral shape is well fitted by an expression of the type . At these frequencies, dust emission can also be distinguished from CMB fluctuations by its distinct spectral signature () in multi-frequency observations. Recently, an additional component, correlated with dust emission, has been proposed (Draine & Lazarian 1998) but its existence and nature is still matter of discussion. Since spatial variability of and is quite significant, cross-correlation techniques between CMB maps and Galactic foreground templates have been employed recently in order to estimate the contribution of Galactic foregrounds to CMB anisotropy data sets (e.g. Banday et al. 2003; Bennett et al. 2003; Hamilton & Ganga 2001; de Oliveira-Costa et al. 1999).
In this paper we evaluate the Galactic emission contribution to the BEAST (Background Emission Anisotropy Scanning Telescope) CMB anisotropy maps at 30 GHz and 41.5 GHz (Meinhold et al. 2003). We use a cross-correlation approach between the wide declination band observed by BEAST in the Northern Hemisphere and the corresponding sky coverage in: (a) the Finkbeiner et al. (2003) all-sky map of H as a template for the free-free emission; (b) the Platania et al. (2003) de-striped version of the 408 MHz map (Haslam et al. 1982) as a template for the Galactic synchrotron emission and (c) a 100 m combined IRAS/DIRBE dust template (Schlegel, Finkbeiner & Davis, 1998) for the dust emission. In the case of the free-free contribution, we compare our results with those obtained by Dickinson et al. (2003). In Section 2 we briefly describe the BEAST experiment. Section 3 presents the BEAST maps and discusses the foreground templates. We describe the method for evaluating the Galactic contamination in the BEAST maps in Section 4, while Section 5 discusses the analysis and results of this work.
2 THE BEAST TELESCOPE
The BEAST instrument (Childers et al. 2004; Figueiredo et al. 2004) is a 1.9-meter effective aperture off-axis Gregorian telescope configured with a 6-element Q-band (38-45 GHz; arcmin FWHM) and 2-element Ka-band (26-36 GHz; arcmin FWHM) focal plane array, and a modulating tilted flat mirror between the primary mirror and the sky. The instrument is currently acquiring data in Barcroft, CA, USA, at the White Mountain Research Station (WMRS) of the University of California at an altitude of m. The spatial modulation provided by the movement of the tilted flat mirror results in an ellipsoidal scan of the sky with an major axis. Combined with the daily modulation due to the rotation of the Earth, BEAST scans a full 24-hour long declination band between and .
BEAST was designed to map the CMB with large sky coverage and high angular resolution. It was specifically conceived to make well connected maps through its scanning strategy. The range of frequencies covered by BEAST can help discriminate between the CMB signal and the Galactic foregrounds. The BEAST maps complement the Wilkinson Microwave Anisotropy Probe (WMAP) mission in several ways. For instance, BEAST measurements in the Q-band are of higher resolution than in WMAP, so we should be more sensitive to point sources. By measuring the CMB with high sensitivity and resolution over a limited region of the sky, we can get a better understanding of foregrounds to help disentangle the individual Galactic contaminants. BEAST can also be adapted to allow fundamental studies of the S-Z effect on a large number of clusters, study dusty galaxies and their foreground contaminating role, and extend its multipole coverage.
3 BEAST AND FOREGROUND MAPS
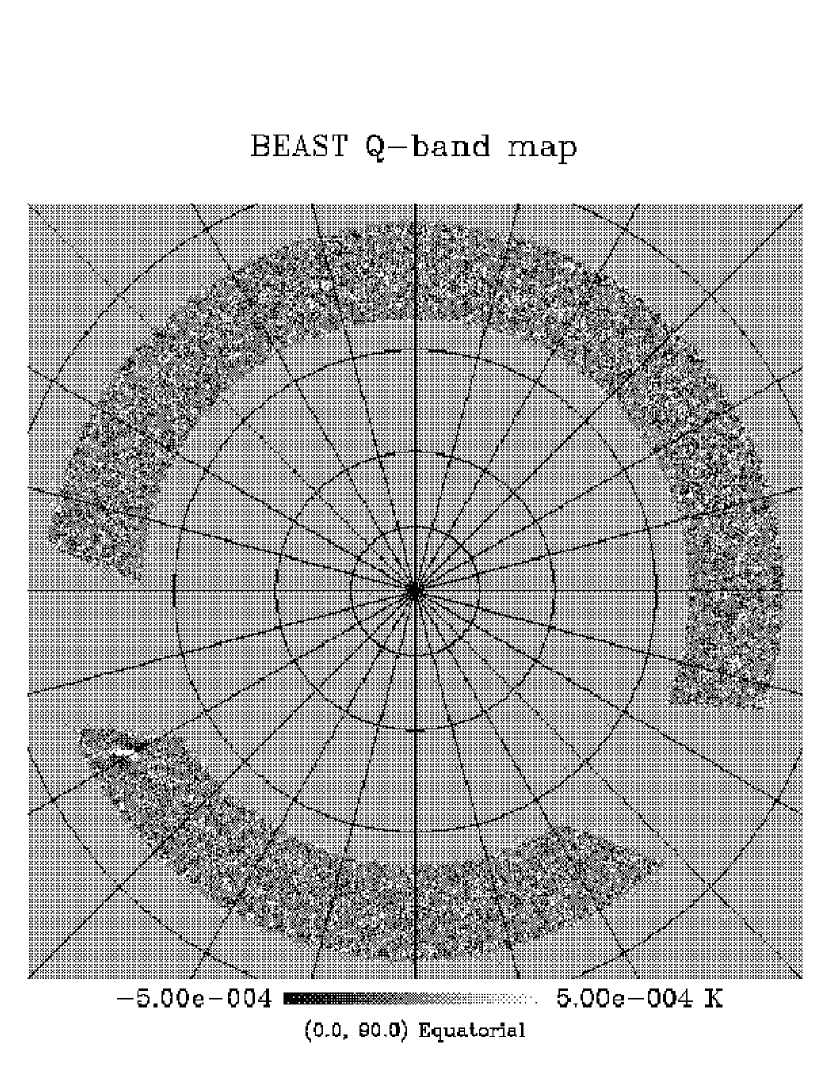
The data used in this work correspond to 680 hours of observations taken between July 2001 and October 2002. An in-depth discussion of the observational strategy, the data processing procedure, and the map-generating pipeline is presented in Meinhold et al. (2003). During the acquisition process, the amplified output of each radiometer was AC-coupled with a high-pass time constant of 15 seconds. The raw data were binned into 250 sky positions per revolution of the modulating flat mirror and the first-order atmospheric contribution was eliminated by folding and subtracting the low frequency envelope in one-hour long data sets. A 10-Hz high-pass filter was applied to the resulting time-ordered data (TOD) in order to remove any remaining low frequency contribution of the noise, which is dominant in this region of the spectrum. The pointing coordinates were translated into HEALPix (Górski et al. 1999) pixel indexes to constitute the final BEAST maps per hour and per channel. These individual maps were co-added to obtain the final BEAST maps at 30 GHz and 41.5 GHz. Each BEAST map consists of pixels (in HEALPix N pixelization) covering the entire declination band between . In this work, the region limited by b was removed considering that its complexity avoids any reasonable analysis. The resulting Ka-band map is shown in Figure 1 and the Q-band map in Figure 2.
The Galactic emission model we used for tracing the free-free component is the recently released compilation of Finkbeiner (2003) of an all-sky map of H with observations from WHAM (Reynolds et al. 2002), VTSS (Dennison et al. 1998) and SHASSA (Gaustad et al. 2001). As a tracer of Galactic synchrotron emission we used the 408 MHz map of Haslam et al. (1982). Finally, to model the thermal dust emission of the Galaxy we used a 100 m combined IRAS/DIRBE map (Schlegel, Finkbeiner & Davis 1998; Finkbeiner, Davis & Schlegel 1999).
The three foreground maps were binned to the N HEALPix pixelization resolution and, then, processed by a BEAST experiment simulator, which samples, individually, each foreground map following the sequence of pixels observed by the BEAST telescope during a typical working day, in 1-hour time sets in the same manner the raw data are recorded. This procedure effectively reproduces the BEAST scanning pattern of the sky onto the foreground maps as if each Galactic component were to be the only source in the sky. The resulting TODs were then processed following exactly the same map-making pipeline as with the BEAST raw data, described in the previous paragraph, to produce BEAST-like templates of the Galactic emission tracers.
The pipeline to produce BEAST-like foreground templates can be summarized as follows:
-
•
selection of the appropriate templates,
-
•
convolution of the original templates with the proper smooth function,
-
•
appropriate binning and processing of the individual templates according to BEAST pointing,
-
•
subtraction of the low frequency envelope and 10-Hz highpass filtering of the 1-hour long “template TOD”,
-
•
processing of the “template TOD” into a foreground template map in the same way as described in Meinhold et al. (2003).
4 METHOD
In order to analyze the foreground contribution to the BEAST CMB anisotropy maps, we considered a BEAST map, , to be a linear superposition of the actual CMB anisotropy distribution, , a noise pattern, , and a set of foreground components :
| (1) |
where are the coupling constants which transform the foreground template intensities into antenna temperature at the BEAST frequencies. These constants correspond to the correlation coefficients that minimize a expression of the type
| (2) |
where is the covariance matrix of the BEAST data. Since the noise pattern and the CMB anisotropy maps are uncorrelated Gaussian variables with zero mean, uncorrelated with the foreground templates, and also considering and as noise, the temperature fluctuations correspond to a mapping of the fluctuations in the distribution of the Galactic emission. also accounts for any chance alignment between CMB and the Galactic templates which dominate the uncertainty in the coupling constants. Similar analysis has been applied to data sets from different experiments that characterize CMB fluctuations (Bennett et al. 1993; Kogut et al. 1996a, b; de Oliveira-Costa et al. 1997, 1999; Hamilton Ganga 2001 and Mukherjee et al. 2002, 2003).
Considering the vectors as constants, the matrix is given by
| (3) |
the sum of the covariance matrix modeling the CMB signal and the noise covariance matrix. Minimizing the , the best estimates of are obtained as the solutions to the system of equations
| (4) |
with a variance given by
| (5) |
In Equations (4) and (5), the terms correspond to arrays, where is the number of foreground templates simultaneously analyzed and is the number of pixels in the maps, and the term corresponds to a vector representing the unknown parameters to be evaluated.
Finally, we estimated the level of Galactic contribution to the BEAST maps by comparing the rms of the fluctuations in the Galactic templates, scaled by their coupling constants (), to the rms of the BEAST temperature fluctuations in the corresponding Ka- and Q-band maps. The rms values follow directly from the estimates of the individual map variances
| (6) |
for each Galactic contaminant template and
| (7) |
for the BEAST maps.
5 ANALYSIS AND RESULTS
The two BEAST maps at Ka- and Q-band were divided, along the RA axis, in 24 sections of one-hour (RA), beginning at RA=0 h, each with pixels, and were independently analyzed. To characterize the correlation with the foreground templates, we calculated the Pearson’s linear correlation coefficient for the 24 sub-maps for each of the two BEAST maps. The results are presented in Tables 1 to 6 and Figures 3 to 5. We should point out that the templates we used do not necessarily trace the behavior of the individual Galactic foreground contaminants at BEAST frequencies, even though the generally low values of the correlation coefficients over the 1-hour RA section may suggest this.
For the free-free emission, in at least two regions in both BEAST maps, identified as regions 3 (3 h RA h) and 4 (4 h RA h) in Tables 1 and 2, the value of the correlation coefficient was above 0.45 for both bands (p 0.0001), high enough to consider them as highly contaminated by the free-free emission. It is possible to see, in the same tables, that the percentage of temperature contribution of the free-free emission (as traced by the H template) to the corresponding BEAST map regions varies between 49.0 and 56.5 (Ka-band) and between 48.1 and 64.4 (Q-band).
In the same tables, we present the values of the parameter as obtained from Equation 4. For the regions mentioned above, the parameter varies from () K/R to () K/R for the Ka-band, and from () K/R to () K/R for the Q-band. These values agree with the theoretical results presented by Dickinson et al. (2003), for an electronic temperature T K.
For synchrotron emission, the correlation coefficient was always below 0.15, except for region 16 (16 h RA h) in the Ka-band and regions 16 (16 h RA h) and 23 (23 h RA h) in Q-band, in Tables 3 and 4. For these regions the constribution in temperature corresponds to 16.8 in the Ka-band, and varies between 16.7 and 23.0 in the Q-band.
For thermal dust emission, the same two regions as in the free-free emission case in both BEAST maps, identified as regions 3 and 4 in Tables 5 and 6, present values of the correlation coefficient above 0.42 for both bands (p 0.0001), high enough to consider them as highly contaminated by the thermal dust emission. The percentage of temperature contribution of the thermal dust emission to the corresponding BEAST map regions varies between 42.1 and 67.4 (Ka-band), and between 47.0 and 67.5 (Q-band).
The parameter values obtained for the regions mentioned above vary from () K/(MJy/sr) to () K/(MJy/sr) for the Ka-band and from () K/(MJy/sr) to () K/(MJy/sr) for the Q-band.
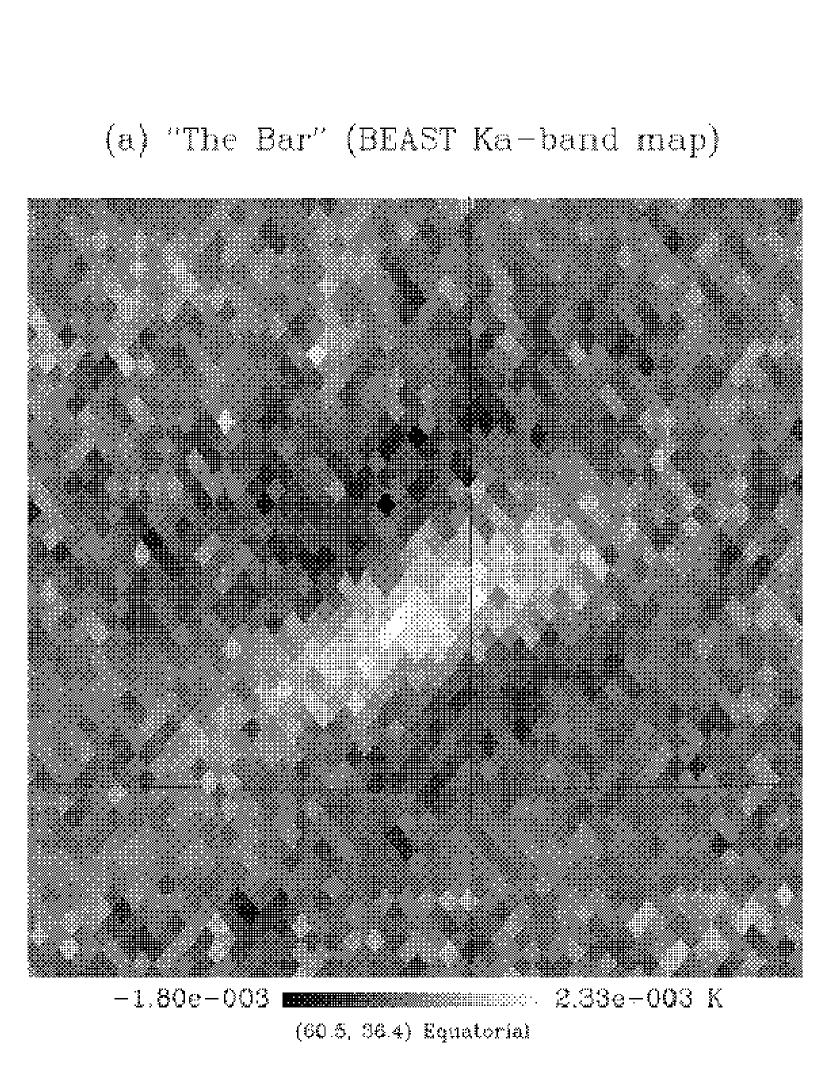
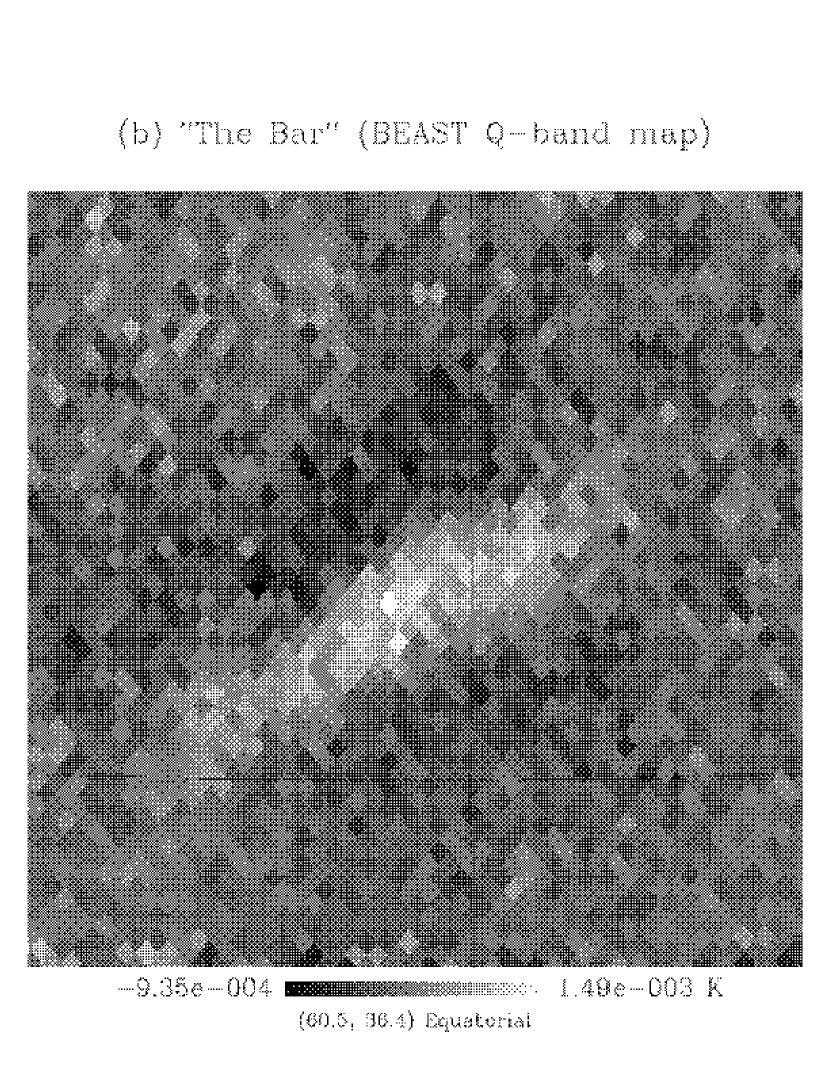
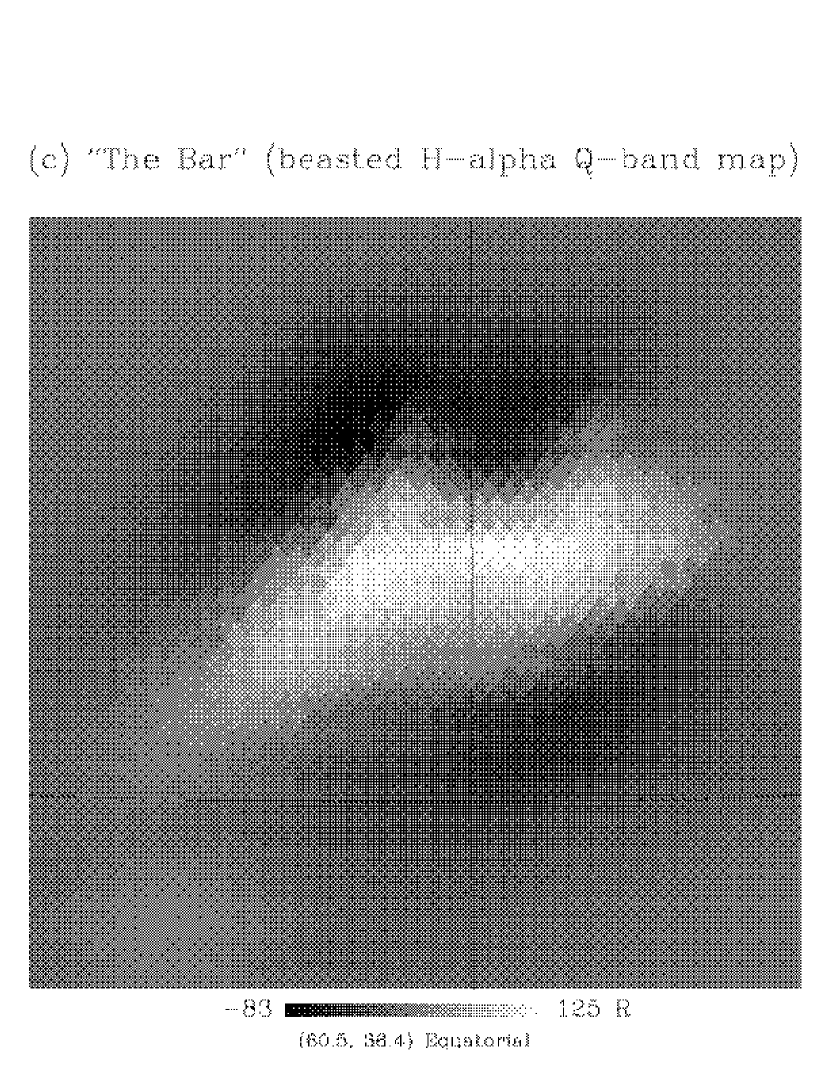
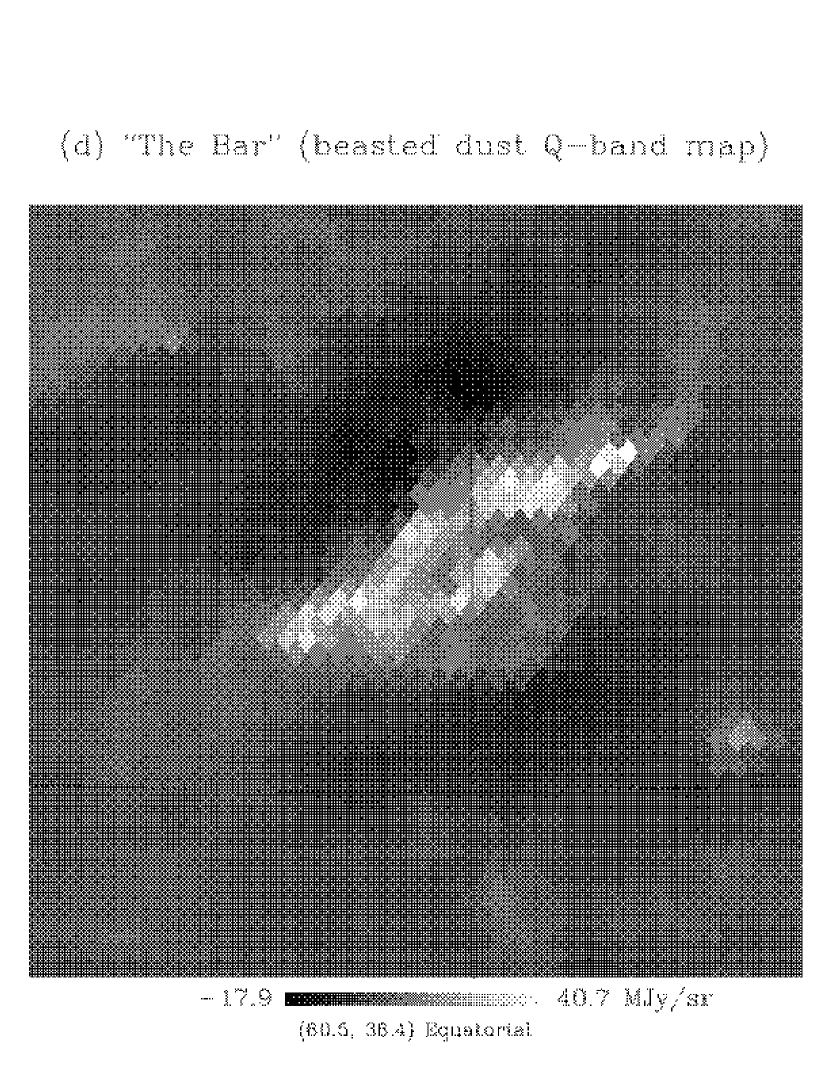
Due to the large number of pixels in the BEAST maps, we are able to determine the values corresponding to different regions of the Galaxy, which allow us to take into account spatial variations in the Galaxy foreground emission. For instance, we focused on one interesting feature found in BEAST maps, which we called “the bar” (Meinhold et al. 2003), centered around RA = 4.04 h () and = , shown in Figure 6, and performed the same calculation for the region located between 58.3 RA and 34.7 obtaining as results () K/R at 30 GHz and () K/R at 41.5 GHz. The corresponding Pearson’s correlation coefficients were 0.648 (Ka-band) and 0.623 (Q-band) (875 pixels; p 0.0001).
In order to determine regions of the sky to be avoided for BEAST CMB analysis due to Galactic foreground contamination, we applied the method outlined in the previous section to evaluate the Galactic foreground contribution in our data set. BEAST beams crossed twice the Galactic Plane in the observational campaign at WMRS. This allows us to examine in detail the extent of the Galactic contamination in our data. We began with a 2.5∘ cut above and below the Galactic Plane and estimated the individual contribution of each foreground component in the remaining part of the BEAST maps. We set a b step for further cuts. Tables 7 and 8 show the results of this procedure. The number of pixels left in the BEAST maps is presented in the second column of Tables 7 and 8. Columns 4, 6, and 8, in both tables, present the percentual temperature contribution of each foreground component, estimated from the templates, while columns 3, 5, and 7 show the corresponding parameters for the three foregrounds after each sucessive Galactic Plane remotion. It is clear from these tables that the Galactic foreground contamination is negligible after a b Galactic cut. This cut was then applied to our data set in order to generate BEAST CMB maps (Meinhold et al. 2003) and estimate CMB power spectrum (O’Dwyer et al. 2004).
References
- (1) Banday, A.J. et al., 2003, MNRAS, 345, 897.
- (2) Bennett, C.L. et al., 1993, ApJ, 414, L77.
- (3) Bennett, C.L. et al., 2003, ApJS, 148, 97.
- (4) Childers, J. et al., 2004, to be submitted to ApJ.
- (5) Dennison, B., Simonetti, J.H. & Topasna, G., 1998, PASA, 15, 147.
- (6) de Oliveira-Costa, A. et al., 1997, ApJ, 482, L17.
- (7) de Oliveira-Costa, A. et al., 1999, ApJ, 527, L9.
- (8) Dickinson, C., Davies, R.D. & Davis, R.J., 2003, MNRAS, 341, 369.
- (9) Draine, B.T. & Lazarian, A., 1998, ApJ, 494, L19.
- (10) Figueiredo, N. et al., 2004, submitted to ApJ.
- (11) Finkbeiner, D.P., 2003, astro-ph/0301558, ApJS, in press.
- (12) Finkbeiner, D.P., Davis, M. & Schlegel, D.J., 1999, ApJ, 524, 867.
- (13) Górski, K.M., Hivon, E. & Wandelt, B.D., 1999, in Proceedings of the MPA/ESO Cosmology Conference on Evolution of Large Scale Structure. Eds. A.J. Banday, R.S. Sheth & L. da Costa.
- (14) Gaustad, J.E., McCullough, P.R., Rosing, W. & Van Buren, D.,2001, PASP, 113, 1326.
- (15) Hamilton, J.Ch. & Ganga, K.M., 2001, A&A, 368, 760.
- (16) Haslam, C.G.T., Salter, C.J., Stoffel, H. & Wilson, W., 1982, A&AS, 47, 1.
- (17) Kogut, A. et al., 1996, ApJ, 460, 1.
- (18) Kogut, A. et al., 1996, ApJ Letters, 464, L5.
- (19) Meinhold, P. et al., 2003, astro-ph/0302034, submitted to ApJ.
- (20) Mukherjee, P. et al., 2002, ApJ, 579, 83.
- (21) Mukherjee, P. et al., 2003, ApJ, 592, 692.
- (22) O’Dwyer, I. et al., 2004, astro-ph/0312610, submitted to ApJ.
- (23) Platania, P. et al., 2003, A&A, 410, 847.
- (24) Reynolds, R.J., Haffner, L.M. & Madsen, G.J., 2002, in “Galaxies: the third dimension”, ASP Conf. Series, vol. 282. Eds. M. Rosado, L. Binette & L. Arias, in press.
- (25) Schlegel, D.J., Finkbeiner, D.P. & Davis, M., 1998, ApJ, 500, 525.


| Section | Number of | Correlation | Probability | |||||
|---|---|---|---|---|---|---|---|---|
| pixels | Coeff. | [] | [K/R] | [K/R] | [] | [K] | [] | |
| 0 | 7951 | 0.0013 | 45.41 | -0.334 | 9.848 | 0.343 | -0.11 | -0.14 |
| 1 | 7952 | -0.1171 | 0.01 | -50.643 | 18.460 | 0.214 | -10.84 | -12.00 |
| 2 | 7951 | 0.1784 | 0.01 | 50.981 | 12.498 | 0.310 | 15.78 | 17.08 |
| 3 | 7780 | 0.5631 | 0.01 | 8.318 | 0.440 | 9.241 | 76.87 | 56.48 |
| 4 | 2009 | 0.4701 | 0.01 | 6.393 | 0.391 | 20.624 | 131.84 | 49.00 |
| 6 | 5467 | -0.0395 | 0.17 | -25.822 | 28.888 | 0.181 | -4.68 | -4.95 |
| 7 | 7952 | 0.1215 | 0.01 | 101.153 | 41.827 | 0.102 | 10.34 | 12.00 |
| 8 | 7951 | 0.0133 | 11.80 | 19.786 | 71.587 | 0.058 | 1.14 | 1.18 |
| 9 | 7905 | 0.0669 | 0.01 | 302.061 | 127.176 | 0.032 | 9.55 | 9.57 |
| 10 | 7952 | 0.0305 | 0.33 | 112.272 | 106.123 | 0.038 | 4.32 | 4.34 |
| 11 | 7951 | 0.0311 | 0.28 | 122.695 | 133.724 | 0.031 | 3.83 | 3.68 |
| 12 | 7905 | 0.1272 | 0.01 | 529.030 | 159.984 | 0.025 | 13.13 | 13.00 |
| 13 | 7951 | -0.0377 | 0.04 | -110.799 | 101.603 | 0.040 | -4.46 | -3.53 |
| 14 | 7949 | -0.0763 | 0.01 | -195.850 | 112.354 | 0.038 | -7.43 | -6.58 |
| 15 | 7899 | -0.1142 | 0.01 | -303.971 | 112.344 | 0.038 | -11.46 | -11.16 |
| 16 | 7947 | 0.0383 | 0.03 | 113.628 | 80.361 | 0.056 | 6.36 | 5.34 |
| 17 | 7944 | 0.0531 | 0.01 | 46.845 | 44.450 | 0.098 | 4.60 | 4.43 |
| 18 | 7821 | 0.1542 | 0.01 | 54.151 | 13.304 | 0.316 | 17.09 | 14.58 |
| 19 | 3211 | -0.0430 | 0.75 | -4.796 | 13.634 | 0.493 | -2.36 | -2.09 |
| 21 | 4134 | 0.0722 | 0.01 | 5.826 | 3.541 | 1.449 | 8.44 | 8.74 |
| 22 | 7952 | 0.0274 | 0.73 | 1.547 | 1.219 | 2.883 | 4.46 | 4.98 |
| 23 | 7905 | -0.0229 | 2.08 | -17.183 | 16.594 | 0.219 | -3.76 | -4.41 |
| Section | Number of | Correlation | Probability | |||||
|---|---|---|---|---|---|---|---|---|
| pixels | Coeff. | [] | [K/R] | [K/R] | [] | [K] | [] | |
| 0 | 7866 | -0.0237 | 1.77 | -3.628 | 7.307 | 0.231 | -0.84 | -1.84 |
| 1 | 7866 | -0.1471 | 0.01 | -29.253 | 10.543 | 0.223 | -6.53 | -13.56 |
| 2 | 7866 | 0.0108 | 16.87 | -0.512 | 6.510 | 0.314 | -0.16 | -0.34 |
| 3 | 7723 | 0.6373 | 0.01 | 4.093 | 0.239 | 9.907 | 40.54 | 64.39 |
| 4 | 2059 | 0.4567 | 0.01 | 3.284 | 0.211 | 21.961 | 72.13 | 48.08 |
| 6 | 5361 | 0.0422 | 0.10 | 13.347 | 14.109 | 0.193 | 2.58 | 5.52 |
| 7 | 7866 | 0.0179 | 5.65 | 31.502 | 21.608 | 0.108 | 3.40 | 6.97 |
| 8 | 7866 | 0.0311 | 0.29 | 50.767 | 41.305 | 0.061 | 3.07 | 6.55 |
| 9 | 7820 | 0.0219 | 2.67 | 122.951 | 72.972 | 0.033 | 4.07 | 7.90 |
| 10 | 7866 | -0.0029 | 39.81 | 21.357 | 57.900 | 0.040 | 0.86 | 1.49 |
| 11 | 7866 | -0.1505 | 0.01 | -215.064 | 68.664 | 0.032 | -6.92 | -15.75 |
| 12 | 7820 | -0.0139 | 11.02 | -92.942 | 92.754 | 0.025 | -2.34 | -3.74 |
| 13 | 7866 | -0.0189 | 4.72 | -56.237 | 59.903 | 0.042 | -2.35 | -4.09 |
| 14 | 7866 | 0.0028 | 40.15 | -48.228 | 64.271 | 0.039 | -1.89 | -2.90 |
| 15 | 7820 | 0.0198 | 3.99 | -26.230 | 63.992 | 0.039 | -1.03 | -1.65 |
| 16 | 7866 | 0.0424 | 0.01 | 11.437 | 42.818 | 0.060 | 0.69 | 0.89 |
| 17 | 7866 | 0.0767 | 0.01 | 52.133 | 24.553 | 0.103 | 5.36 | 7.74 |
| 18 | 7820 | 0.0450 | 0.01 | 1.002 | 7.716 | 0.332 | 0.33 | 0.64 |
| 19 | 3135 | -0.1921 | 0.01 | -26.138 | 7.276 | 0.518 | -13.55 | -24.03 |
| 21 | 4187 | 0.1659 | 0.01 | 5.066 | 1.926 | 1.510 | 7.65 | 17.38 |
| 22 | 7866 | -0.0494 | 0.01 | -0.202 | 0.727 | 2.953 | -0.60 | -1.26 |
| 23 | 7820 | 0.0020 | 42.92 | 5.084 | 9.601 | 0.225 | 1.15 | 2.38 |
| Section | Number of | Correlation | Probability | |||||
|---|---|---|---|---|---|---|---|---|
| pixels | Coeff. | [] | [K/K] | [K/K] | [] | [K] | [] | |
| 0 | 7951 | 0.0800 | 0.01 | 34.971 | 19.561 | 0.190 | 6.64 | 8.25 |
| 1 | 7952 | -0.0422 | 0.01 | -21.833 | 27.558 | 0.133 | -2.91 | -3.23 |
| 2 | 7951 | 0.0497 | 0.01 | 26.748 | 22.201 | 0.172 | 4.60 | 4.98 |
| 3 | 7780 | -0.1052 | 0.01 | -88.337 | 23.274 | 0.166 | -14.65 | -10.76 |
| 4 | 2009 | 0.0683 | 0.11 | 124.116 | 36.736 | 0.204 | 25.35 | 9.42 |
| 6 | 5467 | 0.1011 | 0.01 | 56.083 | 28.984 | 0.175 | 9.83 | 10.40 |
| 7 | 7952 | 0.0622 | 0.01 | 27.298 | 27.256 | 0.154 | 4.21 | 4.88 |
| 8 | 7951 | -0.1843 | 0.01 | -101.841 | 25.641 | 0.161 | -16.39 | -16.87 |
| 9 | 7905 | 0.0081 | 23.59 | 0.660 | 23.600 | 0.169 | 0.11 | 0.11 |
| 10 | 7952 | -0.0123 | 13.66 | -5.424 | 28.091 | 0.149 | -0.81 | -0.81 |
| 11 | 7951 | 0.1237 | 0.01 | 65.980 | 28.340 | 0.148 | 9.73 | 9.35 |
| 12 | 7905 | 0.1181 | 0.01 | 88.272 | 27.529 | 0.144 | 12.71 | 12.57 |
| 13 | 7951 | -0.0814 | 0.01 | -52.196 | 25.107 | 0.162 | -8.46 | -6.69 |
| 14 | 7949 | 0.0550 | 0.01 | 31.858 | 26.020 | 0.163 | 5.20 | 4.60 |
| 15 | 7899 | -0.0379 | 0.04 | -25.449 | 25.558 | 0.159 | -4.06 | -3.95 |
| 16 | 7947 | 0.1510 | 0.01 | 126.873 | 27.972 | 0.157 | 19.98 | 16.78 |
| 17 | 7944 | -0.0147 | 9.50 | 3.388 | 23.043 | 0.189 | 0.64 | 0.62 |
| 18 | 7821 | 0.0151 | 9.07 | 4.883 | 15.154 | 0.280 | 1.37 | 1.17 |
| 19 | 3211 | -0.0144 | 20.66 | 1.086 | 4.729 | 1.382 | 1.50 | 1.33 |
| 21 | 4134 | -0.0633 | 0.01 | -26.173 | 18.433 | 0.284 | -7.44 | -7.70 |
| 22 | 7952 | 0.0742 | 0.01 | 22.775 | 15.579 | 0.227 | 5.17 | 5.77 |
| 23 | 7905 | 0.0385 | 0.03 | 12.597 | 20.843 | 0.183 | 2.30 | 2.70 |
| Section | Number of | Correlation | Probability | |||||
|---|---|---|---|---|---|---|---|---|
| pixels | Coeff. | [] | [K/K] | [K/K] | [] | [] | [] | |
| 0 | 7866 | -0.0816 | 0.01 | -22.379 | 11.054 | 0.199 | -4.45 | -9.79 |
| 1 | 7866 | -0.1009 | 0.01 | -39.178 | 15.506 | 0.135 | -5.30 | -11.00 |
| 2 | 7866 | -0.1038 | 0.01 | -28.106 | 12.827 | 0.177 | -4.98 | -10.40 |
| 3 | 7723 | -0.0139 | 11.12 | 2.197 | 11.932 | 0.171 | 0.37 | 0.60 |
| 4 | 2059 | 0.1265 | 0.01 | 117.535 | 19.753 | 0.219 | 25.79 | 17.20 |
| 6 | 5361 | -0.0378 | 0.28 | -9.900 | 16.454 | 0.180 | -1.78 | -3.82 |
| 7 | 7866 | 0.0985 | 0.01 | 43.436 | 14.335 | 0.160 | 6.97 | 14.29 |
| 8 | 7866 | -0.0551 | 0.01 | -13.540 | 14.155 | 0.164 | -2.23 | -4.74 |
| 9 | 7820 | 0.0461 | 0.01 | 19.541 | 12.704 | 0.174 | 3.40 | 6.61 |
| 10 | 7866 | 0.1218 | 0.01 | 47.519 | 15.324 | 0.156 | 7.44 | 12.91 |
| 11 | 7866 | -0.0565 | 0.01 | -26.170 | 14.895 | 0.156 | -4.08 | -9.29 |
| 12 | 7820 | -0.0063 | 28.90 | 1.703 | 16.089 | 0.143 | 0.24 | 0.39 |
| 13 | 7866 | -0.0983 | 0.01 | -38.581 | 14.201 | 0.166 | -6.39 | -11.13 |
| 14 | 7866 | -0.0006 | 47.78 | 9.103 | 14.197 | 0.170 | 1.55 | 2.38 |
| 15 | 7820 | -0.0605 | 0.01 | -24.101 | 14.103 | 0.167 | -4.02 | -6.41 |
| 16 | 7866 | 0.2135 | 0.01 | 79.253 | 16.046 | 0.163 | 12.89 | 16.70 |
| 17 | 7866 | -0.0650 | 0.01 | -5.030 | 12.205 | 0.200 | -1.00 | -1.45 |
| 18 | 7820 | -0.0299 | 0.41 | -8.900 | 8.736 | 0.297 | -2.64 | -5.09 |
| 19 | 3135 | 0.0355 | 2.35 | 0.257 | 3.491 | 1.069 | 0.27 | 0.49 |
| 21 | 4187 | -0.0692 | 0.01 | -13.168 | 10.879 | 0.296 | -3.90 | -8.86 |
| 22 | 7866 | -0.2265 | 0.01 | -49.490 | 9.234 | 0.228 | -11.26 | -23.78 |
| 23 | 7820 | 0.2248 | 0.01 | 58.077 | 11.559 | 0.191 | 11.08 | 23.05 |
| Section | Number of | Correlation | Probability | |||||
|---|---|---|---|---|---|---|---|---|
| pixels | Coeff. | [] | [K/(MJy/sr)] | [K/(MJy/sr)] | [] | [K] | [] | |
| 0 | 7951 | 0.0644 | 0.01 | 14.201 | 10.097 | 0.351 | 4.98 | 6.19 |
| 1 | 7952 | -0.0289 | 0.50 | -10.193 | 23.609 | 0.164 | -1.67 | -1.85 |
| 2 | 7951 | -0.0238 | 1.69 | -6.329 | 18.616 | 0.211 | -1.33 | -1.44 |
| 3 | 7780 | 0.4222 | 0.01 | 30.055 | 2.126 | 1.905 | 57.26 | 42.07 |
| 4 | 2009 | 0.6822 | 0.01 | 45.005 | 1.952 | 4.029 | 181.31 | 67.38 |
| 6 | 5467 | -0.0814 | 0.01 | -17.635 | 15.580 | 0.325 | -5.74 | -6.07 |
| 7 | 7952 | 0.0792 | 0.01 | 59.063 | 30.928 | 0.139 | 8.23 | 9.55 |
| 8 | 7951 | -0.0234 | 1.85 | 1.813 | 39.772 | 0.104 | 0.19 | 0.19 |
| 9 | 7905 | -0.0544 | 0.01 | -135.524 | 98.548 | 0.040 | -5.43 | -5.44 |
| 10 | 7952 | 0.0112 | 15.98 | 41.186 | 81.962 | 0.051 | 2.09 | 2.10 |
| 11 | 7951 | 0.0421 | 0.01 | 77.948 | 58.581 | 0.070 | 5.43 | 5.21 |
| 12 | 7905 | 0.0843 | 0.01 | 125.368 | 59.849 | 0.065 | 8.17 | 8.09 |
| 13 | 7951 | -0.0337 | 0.13 | -103.639 | 89.066 | 0.048 | -4.94 | -3.91 |
| 14 | 7949 | 0.0132 | 11.94 | 16.996 | 74.317 | 0.058 | 0.99 | 0.87 |
| 15 | 7899 | -0.0003 | 49.10 | 16.916 | 70.642 | 0.059 | 1.00 | 0.98 |
| 16 | 7947 | 0.0219 | 2.55 | 9.961 | 70.057 | 0.065 | 0.65 | 0.55 |
| 17 | 7944 | -0.0096 | 19.57 | -8.173 | 34.141 | 0.129 | -1.06 | -1.02 |
| 18 | 7821 | 0.0223 | 2.42 | 3.532 | 14.848 | 0.289 | 1.02 | 0.87 |
| 19 | 3211 | 0.1063 | 0.01 | 23.486 | 12.282 | 0.498 | 11.70 | 10.38 |
| 21 | 4134 | -0.0747 | 0.01 | -7.967 | 7.640 | 0.701 | -5.59 | -5.78 |
| 22 | 7952 | -0.0149 | 9.17 | -0.977 | 8.226 | 0.450 | -0.44 | -0.49 |
| 23 | 7905 | 0.0390 | 0.03 | 7.824 | 11.336 | 0.340 | 2.66 | 3.12 |
| Section | Number of | Correlation | Probability | |||||
|---|---|---|---|---|---|---|---|---|
| pixels | Coeff. | [] | [K/(MJy/sr)] | [K/(MJy/sr)] | [] | [K] | [] | |
| 0 | 7866 | -0.0143 | 10.21 | -1.108 | 5.800 | 0.308 | -0.34 | -0.75 |
| 1 | 7866 | -0.1378 | 0.01 | -33.899 | 12.862 | 0.174 | -5.90 | -12.25 |
| 2 | 7866 | -0.0010 | 46.51 | -2.607 | 11.030 | 0.222 | -0.58 | -1.21 |
| 3 | 7723 | 0.4429 | 0.01 | 14.550 | 1.183 | 2.034 | 29.60 | 47.02 |
| 4 | 2059 | 0.6713 | 0.01 | 23.965 | 1.074 | 4.224 | 101.22 | 67.48 |
| 6 | 5361 | 0.0149 | 13.72 | 3.324 | 8.136 | 0.348 | 1.16 | 2.48 |
| 7 | 7866 | 0.1098 | 0.01 | 39.823 | 17.641 | 0.144 | 5.73 | 11.75 |
| 8 | 7866 | -0.0469 | 0.01 | -9.518 | 22.134 | 0.108 | -1.03 | -2.20 |
| 9 | 7820 | 0.0602 | 0.01 | 60.040 | 54.567 | 0.041 | 2.46 | 4.78 |
| 10 | 7866 | 0.0502 | 0.01 | 79.322 | 46.521 | 0.054 | 4.27 | 7.42 |
| 11 | 7866 | -0.1068 | 0.01 | -91.406 | 33.964 | 0.069 | -6.30 | -14.33 |
| 12 | 7820 | 0.0491 | 0.01 | 27.629 | 35.994 | 0.065 | 1.80 | 2.88 |
| 13 | 7866 | -0.0949 | 0.01 | -139.652 | 49.966 | 0.049 | -6.88 | -12.00 |
| 14 | 7866 | 0.1019 | 0.01 | 14.798 | 39.502 | 0.062 | 0.92 | 1.41 |
| 15 | 7820 | -0.0165 | 7.19 | -23.783 | 40.560 | 0.061 | -1.45 | -2.32 |
| 16 | 7866 | 0.1248 | 0.01 | 121.100 | 41.298 | 0.068 | 8.21 | 10.63 |
| 17 | 7866 | -0.0393 | 0.02 | -37.852 | 19.775 | 0.134 | -5.07 | -7.33 |
| 18 | 7820 | -0.1362 | 0.01 | -19.961 | 7.869 | 0.293 | -5.86 | -11.28 |
| 19 | 3135 | -0.1578 | 0.01 | -19.227 | 7.309 | 0.497 | -9.55 | -16.93 |
| 21 | 4187 | -0.0319 | 1.94 | 0.070 | 4.039 | 0.731 | 0.05 | 0.12 |
| 22 | 7866 | -0.0297 | 0.42 | 2.066 | 4.462 | 0.458 | 0.95 | 2.00 |
| 23 | 7820 | -0.0121 | 14.17 | 1.747 | 6.321 | 0.371 | 0.65 | 1.35 |
| Galactic cut | Number of | ||||||
|---|---|---|---|---|---|---|---|
| b [∘] | pixels | [K/R] | [] | [K/K] | [] | [K/(MJy/sr)] | [] |
| 2.50 | 182349 | 5.5 0.2 | 14.11 | 4.2 0.1 | 34.61 | 11.9 0.3 | 25.53 |
| 7.50 | 165947 | 6.9 0.3 | 19.99 | 1.9 0.7 | 2.16 | 10.9 0.6 | 13.46 |
| 12.50 | 148942 | 8.3 0.4 | 15.89 | 14.0 5.1 | 2.44 | 35.0 2.2 | 13.86 |
| 17.50 | 130519 | -4.3 2.6 | -1.57 | 8.2 5.8 | 1.37 | 4.4 4.7 | 0.88 |
| 22.50 | 106959 | -5.0 12.0 | -0.45 | 10.0 6.7 | 1.63 | 9.5 8.7 | 1.2 |
| Galactic cut | Number of | ||||||
|---|---|---|---|---|---|---|---|
| b [∘] | pixels | [K/R] | [] | [K/K] | [] | [K/(MJy/sr)] | [] |
| 2.50 | 180412 | 2.4 0.1 | 12.47 | 1.73 0.04 | 27.42 | 7.0 0.2 | 29.45 |
| 7.50 | 164235 | 3.4 0.2 | 20.02 | 1.55 0.32 | 3.42 | 5.1 0.4 | 11.99 |
| 12.50 | 147474 | 4.2 0.2 | 16.14 | -3.7 2.9 | -1.24 | 16.2 1.2 | 12.65 |
| 17.50 | 129353 | -3.3 1.5 | -2.35 | -3.0 3.2 | -0.95 | -3.7 2.6 | -1.46 |
| 22.50 | 106350 | -15.0 6.9 | -2.47 | 1.6 3.8 | 0.46 | -3.9 4.9 | -0.90 |