The HDF-North SCUBA Super-map II: Multi-wavelength properties
Abstract
We present radio, optical and X-ray detected counterparts to the sub-mm sources found using SCUBA in the Hubble Deep Field North region (GOODS-N). A new counterpart identification statistic is developed to identify properties of galaxies detected at other wavelengths that can be used to aid counterpart identification. We discriminate between criteria that can use used to pre-select sub-mm bright objects, and those that identify the counterpart to a known sub-mm object. Optically faint galaxies detected in the deepest GHz radio continuum maps are the only effective way of pre-selecting SCUBA galaxies, and radio sources are the best way to identify counterparts to known sub-mm detections. Looking at radio spectral indices, only the steeper sources (indicative of star formation) are detected in the sub-mm. Although we find several X-ray identifications, we show that deep Chandra images do not contribute to counterpart identifications, since in all cases they are already detected in the more easily obtained VLA radio maps. We also find find no evidence for clustering between Chandra and SCUBA sources in this field. For a known SCUBA position, the reddest source tends to be the correct association, although we can find no cut on colour, magnitude, or clustering property that efficiently pre-selects for SCUBA sources. m ISO sources are statistically detected by SCUBA, but the limiting mid-IR flux is not low enough to provide useful constraints. We present postage stamp strips for each SCUBA detection in separate bands from X-ray to radio, providing direct visual evidence that approximately half of the sub-mm sources in this field remain unidentified, despite an abundance of deep multi-wavelength data.
keywords:
methods: statistical – methods: numerical – galaxies: formation – infrared: galaxies – galaxies: starburst1 Introduction
Finding distant IR luminous galaxies is now a routine occurrence for the Sub-millimetre Common User Bolometer Array (SCUBA Holland et al., 1999) on the James Clerk Maxwell Telescope (see Blain et al. 2002). Specifically, we estimate that there have been about 300 published detections in the first 5 years since the instrument was commissioned in 1997. Much more challenging is determining what the galaxies are. To get a complete picture it is necessary to compare the sub-mm sources against data obtained at other wavelengths, but this is often quite difficult for a number of reasons. First, the very dust responsible for the strong IR emission obscures and re-processes light at other wavelengths, making the objects more difficult to detect. Secondly, the negative K-correction in the sub-mm that allows an almost distance-independent ability to detect these galaxies does not apply in the optical and radio. The most serious issue, however, is the large beam-size in sub-mm surveys; often there are several sources within the SCUBA beam detected at other wavelengths, and without some means to discriminate among them, it is uncertain which (if any) of the sources is the host of the the far-IR emission.
Until the advent of the next generation of sub-mm interferometers (particularly ALMA), there is not much that can be done to significantly improve the resolution of the images. But we can address the other issues by obtaining very deep images of SCUBA fields at other wavelengths in order to better identify faint counterparts. The HDF-N (Williams et al., 1996; Ferguson et al., 2000) and its flanking fields, with its wide range of deep imaging across many wavebands, is arguably the best region to use for this purpose.
In this paper, we use this rich multi-wavelength data-set to determine counterparts to the SCUBA detected sources in a roughly region centred on the HDF-N, as described in Borys et al. (2003, hereafter called ‘Paper I’) Given the volume of data still being obtained in the region due to the the Great Observatories Origins Deep Survey (GOODS) programme, we choose to include only data published or obtained prior to the deep ACS images released in August 2003. A larger sub-mm map of the HDF-N, and the study of other GOODS data is reserved for future work.
2 Review of the HDF-N sub-mm maps
Sub-mm maps of the HDF-N were obtained using the SCUBA camera at the James Clerk Maxwell Telescope, including more than 60 shifts of telescope time. We combined the various data-sets into a single map, which we refer to as the Super-map. Combining this with detailed simulations allowed us to extract and assess the reliability of the sources. The full data reduction and source extraction algorithm are described in Paper I.
In summary, the Super-map contains 19 sources which were detected at 850m with a signal-to-noise ratio (SNR) . An additional list of 15 sources was presented between 3.5 and 4. Monte-Carlo simulations of the data suggest that the 4 catalogue should have at most one false detection, but that the number of spurious sources rises drastically for lower thresholds. Thus the catalogue is considered less reliable, although we later argue that at least a third are real. The reality of the 5 sources detected at 450m is much less secure however, since none were found coincident with a source at 850m.
Subsets of the data used here have been published by other groups, and in Paper I we compared them against our map, finding no serious discrepancies. However, a new survey by Wang, Cowie & Barger (2004) appeared after this work was submitted which takes a more critical view of other SCUBA analyses of the HDF-N. In Appendix B we compare our results with theirs, and find that in fact their results support the work here and in previous publications.
3 Statistical criteria for finding counterparts
To identify the most likely counterparts for our SCUBA detections, we need first to choose a method for associating counterparts. Since the Super-map has non-uniform noise, our catalogue includes sources at a variety of signal and SNR levels (including some faint high SNR sources, as well as brighter low SNR sources). Because of the variable effects of pointing uncertainty, noise and source confusion, we choose to adopt a single approach for all our sources, namely to use a fixed search radius. Next we have to choose a value for this radius, outside of which we reject sources. We are confident that our Super-map as a whole has astrometry reliable to within 3, since pointing corrections were rarely much larger, and in addition because the stacked radio/sub-mm flux density begins to drop if the map is shifted by more than this (see section 4.1). Since some parts of the map are dominated by single observations, we need to consider the typical 2 pointing uncertainty of the JCMT as well.
The Monte-Carlo simulations described in Paper I indicate an additional uncertainty of at most 5 for the simulated sources recovered at 850m, which is caused by a combination of confusion and residual sky noise altering the centroid of these faint sources. Adding these in quadrature leads to a conservative search radius of 7, which is comparable to values chosen by other groups. Although this choice of search radius is somewhat arbitrary, we now show that it is in some sense an ‘optimal’ value.
3.1 An alternative to the –statistic
Given the large positional uncertainty for SCUBA sources, several objects from an image in another waveband with higher resolution are possible counterparts to a given SCUBA source. But which one is the correct ID? A measure often adopted by the sub-mm community is the so-called ‘–statistic’ (e.g. Downes et al. 1986). A different approach, and one we advocate and derive next, is to compare the ensemble of SCUBA positions to see which types of counterparts are most likely associated with the sub-mm detections.
Given a surface density of some class of object of per unit area, the random probability that one or more lies within a distance of a specific SCUBA source is
| (1) |
This is the traditional –statistic, and the lower its value, the less likely it is that the object is associated with a source by chance. Table 1 lists the radii within which there is a 95 per cent chance that the object is the counterpart to the SCUBA galaxy. It can be misleading however. For example, if an ERO was found 9.3 away from a SCUBA source, the –statistic would suggest there is only a 5 per cent chance it is not the correct counterpart. However, this object should have been rejected outright because it lies well outside the estimated 7 uncertainty in the SCUBA position.
Identifying counterparts between catalogues of objects at different wavelengths is an endeavour with a long history in the radio and X-ray communities (see for example de Ruiter, Arp & Willis 1977; Prestage & Peacock 1983; Stocke et al. 1991). The ‘–statistic’ is not the only approach used, and there are many discussions in the literature of how to use special properties of candidate counterparts, how to include astrometric uncertainties, cuts on flux ratios, etc. However, these discussions tend to be focused entirely on identifying each individual source.
Since the detailed nature of SCUBA-bright galaxies is still largely unknown, then when comparing with other wavelength images, it is also useful to have a statistic which assesses the identification of the SCUBA sample as a whole. Such a statistic is also easier to interpret, particularly if we choose a fixed search radius. For what follows we assume a uniform probability of association over a 7 radius circle and zero outside. We can then straightforwardly estimate the probability of finding a set of objects within the search radius using Poisson statistics, as follows.
Given a population with a surface density of , the probability of finding no sources within a distance, , of a given point is (for a derivation see e.g. Scott & Tout 1989). This is just the same statement as in equation (1), and deals with the statistics of a single object. The probability that no counterparts are found for independent searches (e.g. in our case for separate SCUBA sources) is
| (2) |
Similarly, the probability of finding a single counterpart is
| (3) |
The pre-factor is needed because there are different ways to pick a single object from a set of objects. Using a similar argument, the probability that of the points, have at least one counterpart is
| (4) |
Therefore, of objects, the probability that or more of them have at least one counterpart is
| (5) |
where we have dropped the and . Note that .
We have applied this statistic to our data and present the results in Table 1. Note how striking some of the implications are. For instance, the probability that 11 of the 19 SCUBA sources have a 1.4 GHz radio source within 7 just by chance is essentially zero.
Still, one has to treat this statistic with some degree of caution. For example, these probabilities assume that the populations are unclustered; as we will comment on later in this paper, clustering evidence does exist for some of the populations we compare the SCUBA sources against. We simply state this caveat for now, and will describe clustering results on a case-by-case basis later.
Finally, is the choice of a 7 search radius a good one? For larger radii, one will get more counterparts, but the probability of more matches by chance will also increase. Therefore a trade-off exists between search radius and probability, and by calculating as a function of radius, we indeed find a minimum at 7. This is independent of which catalogue is used to compute the statistic.
| Class | Number within | sources | sources | |||||
|---|---|---|---|---|---|---|---|---|
| survey area | arcsec | |||||||
| VLA 1.4 GHz | 135 | 8.8 | 0.54 | 11/19 | 0.33 | 14/34 | ||
| VLA 8.5 GHz | 51 | 14.2 | 0.79 | 6/19 | 0.66 | 7/34 | ||
| ISO 15m | 99 | 4.1 | 0.26 | 4/9 | 0.14 | 6/13 | ||
| LBG | 132 | 5.6 | 0.38 | 1/12 | 0.23 | 1/18 | ||
| Chandra 2 Ms | 328 | 5.4 | 0.20 | 8/19 | 0.06 | 14/34 | ||
| 2626 | 2.0 | 0.00 | 9/19 | 0.00 | 17/34 | |||
| 454 | 4.8 | 0.12 | 1/19 | 0.02 | 3/34 | |||
| 801 | 3.7 | 0.03 | 4/19 | 0.00 | 7/34 | |||
| (ERO) | 121 | 9.3 | 0.58 | 0/19 | 0.37 | 1/34 | ||
3.2 Statistical measures of sub-mm flux density from known objects
One can compare a catalogue of objects against a sub-mm image via a ‘stacking’ analysis in order to get a sense of the average sub-mm properties of the sample. The procedure is to take a list of detected objects from a survey, make cuts of some sort (if desired), and then sum up the flux density from a map at the positions of all the objects. Specifically, we take
| (6) |
where and are the sub-mm flux density and error estimates at the position of object . This technique is not restricted to sub-mm maps; for instance, Nandra et al. (2002) have compared a sample of LBGs against Chandra X-Ray maps.
It is important to check for systematic effects in these analyses. We take the list of 51 stars in the HDF-N region from the work of Mendez & Guzman (1998) and correlate them against the HDF Super-map. One would expect no signal from these stars as they are not sub-mm emitters. The stacked average, mJy, is consistent with both the average value of the map (0.02 mJy), and the distribution of fluxes derived from many realizations of taking 51 random positions in the map. Therefore we can proceed with some assurance that any significant stacked signal is real.
Another effect to consider is the variation in the number of objects being compared. For large , the stacked flux density will approach the average value of the map if the objects are distributed randomly on the sky. Therefore the stacked flux density from objects cannot be directly compared to that from objects if they are significantly different (unless a correction is made). Hence in our stacking analyses we only make comparisons among sub-samples with equal number of objects.
4 Multi-wavelength database and sub-mm pre-selection criteria
We have obtained source catalogues and images of the HDF-N over a wide range of wavelengths that are relevant to understanding the nature of the sources detected in the sub-mm maps. Before discussing the sub-mm objects individually, we present an overview of each catalogue and explain their relation to the sub-mm population. In particular, we will search for any criterion that make it possible to pre-select sub-mm detections in our map. We will start with the radio associations, which, as seen in Table 1, are certainly the most important link to the SCUBA population.
4.1 VLA and WSRT radio observations
The entire region of our Super-map has been imaged to roughly RMS using both the VLA (Richards, 2000) and the WSRT (Garrett et al., 2000) radio telescopes at 1.4 GHz . A smaller area survey, covering surrounding the central HDF region, was conducted with the VLA at 8.5 GHz (Richards et al., 1998) to an RMS of . We have obtained the catalogues from each survey and the VLA maps at both frequencies in order to perform comparisons with our sub-mm map. Within the HDF-N Super-map there are 135 1.4 GHz VLA sources detected at . In the combined 8.5 GHz catalogues (the primary list plus some fainter, less securely detected objects), there are 51 sources, 26 of which have a 1.4 GHz counterpart within 3. We note that the WSRT and VLA 1.4 GHz catalogues generally agree, except that the WSRT positions are, on average, 1.5 West of the VLA positions. Unless otherwise noted, we will use the VLA catalogue.
Within the 7 search radius, 11(6) of the 19 objects from the Super-map list have a 1.4(8.5) GHz radio counterpart. 7 of these radio sources are detected at both 1.4 and 8.5 GHz. As shown in Table 1, the chance of 11 SCUBA objects having a nearby radio source just at random is less than . Based on the this result we will assume that a radio source within 7 is the correct SCUBA counterpart, unless other compelling evidence excludes it.
4.1.1 Radio source stacking analysis
When we stack all the 1.4 GHz radio positions on the Super-map, we calculate an average 850m flux density of mJy. This is a very significant detection, and comparable to results from Barger, Cowie & Richards (2000) and Chapman et al. (2002a). To see if there are correlations between radio objects and the sources we do not detect, we mask out a circular region of radius 8 (the half-width of the beam size at 850m) from each of the detected sub-mm sources in the full catalogue. The m flux density stacked at the radio positions is still mJy, suggesting that although the bulk of the radio-stacked flux density comes from the sub-mm detected sources, additional flux density associated with radio galaxies which are weakly detected in the sub-mm is still present. Stacking the 8.5 GHz sources yields an average 850m flux density of mJy, and drops to when the SCUBA sources are masked out.
Radio galaxies are often characterised by the slope of their spectrum (). Roughly speaking, an inverted spectrum () indicates the presence of self-absorbed synchrotron radiation from an AGN. Flat spectra () also suggest self-absorption and AGN, but in addition can be due to increased high frequency radio emission from star-formation. Steeper values of the index are associated with diffuse synchrotron radiation from star-forming galaxies (Condon, 1992), with the ‘canonical’ index being 0.8. In Fig. 1 we plot the 850m flux density at the position of the 30 galaxies detected at both 1.4 and 8.5 GHz (see Table 5 in Richards 2000) against the radio spectral index. The sample with is not significantly detected in the sub-mm, but the ‘star-forming’ sources are.

4.1.2 Registering sub-mm images using radio data
Based on the strength of the sub-mm/radio correlation we can test the astrometry of the sub-mm map by shifting it and re-calculating the stacked flux density at the radio positions. In Fig. 2 we plot the result. The correlation (as determined by the stacked flux) decreases quickly for distances greater than a SCUBA beam-size. A slight offset of 1.5 is seen between the VLA and SCUBA maps with a consistent shift found using only the positions of the radio counterparts to our SCUBA sources. Although no result in this paper is sensitive to such a small offset, we make the shift in order to have the best astrometry for the SCUBA Super-map. As a consequence, some of the ‘SMMJ’ source names have changed by 1 digit from the list in Paper 1. Note that the correlation in Fig. 2 seems to extend past the size of a theoretical, diffraction limited SCUBA beam. This would be the case if individual scans had small offsets between them and were then co-added. Fitting the FWHM of the brightest sources in the Super-map does show that some objects have profiles up to 15 per cent wider than the nominal 15 beam. However, it is also possible that there is a contribution from clustering of the radio sources. As noted in Richards (2000), there is a detection of radio source clustering on scales of –.
4.2 Chandra X-Ray imaging
ACIS, the Advanced CCD Imaging Spectrometer (Nousek et al., 1987) on board Chandra performed a 2 Msec integration on a region surrounding the HDF-N, making it the deepest X-ray observation yet obtained. The survey reaches keV (soft) and keV (hard) flux limits of about and W m-2, respectively (Alexander et al., 2003b). To examine the relationship between SCUBA sources and X-ray flux, we use the Chandra HDF-N catalogue of Alexander et al. (2003b) that covers our entire sub-mm map. The catalogue lists 503 objects, 451 in the soft band and 332 in the hard band, with many sources detected in both. The positions are accurate to within 0.3 near the centre of the field, but the uncertainty increases to 1.5 near the edge. Of these detections, 328 fall within our sub-mm map, and 8 of the 19 SCUBA sources have an X-ray source within our 7 search radius (3 of these have 2 X-ray sources within 7 ).
4.2.1 Chandra stacking analysis
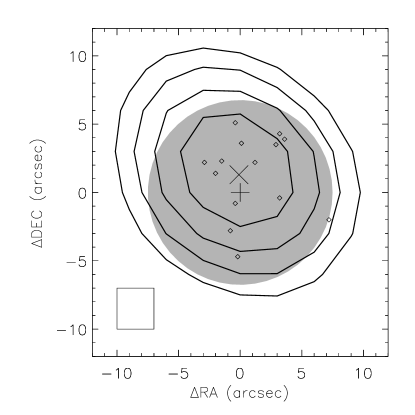
We can characterise the spectral shape of the X-ray emission via the hardness ratio, . For this purpose it is conventional to use the counts in the hard () and soft () bands instead of the fluxes. Fig. 3 reveals a strong correlation between those sources with a hard X-ray spectrum and stacked sub-mm flux density. We obtain an overall average 850m flux density of mJy. Most of this signal comes from the hardest third of the sources, although even the softer ones are significantly detected. In general the stacked flux density is due to SCUBA detected objects, and not from X-ray detected objects that are faint in the sub-mm. This is in stark contrast to the radio stacking results.

Within our 7 search radius we find 8 Chandra sources out of 19 SCUBA sources, and 14 in the full catalogue. However, with over twice as many X-ray detected objects (in the Chandra catalogue) than radio objects, the probability of a chance occurrence is much higher. None the less, the probability of this many matches is (as shown in Table 1), and therefore highly significant. This estimate could be biased if the SCUBA sources cluster around X-ray galaxies, as we now discuss.
4.2.2 The clustering of sub-mm and X-ray sources
Almaini et al. (2002, 2003) claim to detect a strong clustering signal between SCUBA and X-ray sources in the UK 8–mJy survey (Scott et al., 2002). They determined that although only 1 of 17 SCUBA sources in the 8–mJy catalogue had a genuine Chandra detected counterpart, X-ray and SCUBA sources tend to be found close together. The clustering signal at small angular separations can be due to objects which are the same galaxy identified at both wavelengths. However, a positive correlation out to must be due to the two populations tracing out the same large scale structure. Hence the 8–mJy results imply a spatial link between X-ray bright and sub-mm bright populations. It has been speculated that these two catalogues trace the same population, but at different stages in their evolution. This would explain why there is no enhanced overlap between SCUBA and X-ray sources, yet a clustering signal between the two populations can still be detected. High redshift clusters cover angles , which is consistent with this picture.
We performed a clustering analysis for sources found within the HDF-N Super-map using the statistic (Hamilton, 1993)
| (7) |
Here, is the angular correlation function and the pairs of sources are counted between different catalogues: and represent SCUBA and X-ray sources, while and are random X-ray and SCUBA catalogues. Monte-Carlos are required to generate the random catalogues. In these simulations, we assume that the sensitivity to X-ray sources is the same across the entire field, and can therefore place sources randomly on the sky using simple Poisson statistics. This is not precisely true, since the X-ray sensitivity decreases with off-axis distance. However, the sources we are using are quite significantly detected and therefore we can safely assume that we are not biasing our results. We cannot make the same assumption for the SCUBA detected galaxies, since the sensitivity is far from uniform across the field. Therefore we generated 500 simulated maps using the sub-mm source count model described in Paper I. Using these random catalogues and the estimator in equation 7, we calculated for 30 wide angular bins, and plot the results in Fig. 4. No clustering signal is found.

Why is there a discrepancy between the 8–mJy results and those here? First we note that of the 7 SCUBA sources with an X-ray source nearby, only 3 are brighter than the sensitivity limit of the X-ray observations in the 8–mJy region. Thus we repeated the analysis ignoring X-ray sources fainter than the 8–mJy sensitivity, but still no correlation was found. One idea is that the measured clustering signal is due to gravitational lensing of SCUBA sources behind the foreground large scale structures that host the X-ray objects (Almaini et al., 2003). If this were true, one might expect a stronger signal when using only the brightest (and presumably more strongly lensed) SCUBA sources, since the steepness of the source-counts here leads to a stronger bias in the number of objects detected. We therefore re-did the clustering analysis using only the mJy sources but still found no detection. Even including the detections to increase the sample size did not help.
We conclude there is no evidence of an X-ray/SCUBA clustering correlation in the HDF, and speculate that this may be due to field-to-field variation. On the other hand, Almaini et al. (2002) only report weak clustering in their HDF-N analysis. We also note that Almaini et al. (2003) used a different estimator than the one given in equation (7). This estimator is not symmetric between the sub-mm and X-ray, and thus may be prone to bias.
In defense of the foreground lensing hypothesis, there is one SCUBA object, SMMJ123621+621252, which has 7 Chandra detections within 20 none of which are the counterpart to the SCUBA source. This object is discussed in the next section. There are also 2 SCUBA sources in a crowded field (based on optical images) that have an apparent Chandra ID with a spectroscopic redshift, though the redshift is too low to be consistent with the radio-FIR (Far Infrared) correlation. These examples may indicate systems where foreground sources lens the background SCUBA galaxy. However, these are anecdotal suggestions, and we stress that we could find no statistical evidence for such associations.
4.2.3 Are Chandra sources a good way to identify SCUBA-bright galaxies?
Of the 8 SCUBA galaxies that have a Chandra detected galaxy within 7, only two were not first detected in the 1.4 GHz radio map: SMMJ123637+621155 and SMMJ123656+621201. In both cases, there is a radio detection that we call the counterpart, but the X-ray point source is not coincident with it. A third object, near SMMJ123652+621225 does have a radio ID, but (as explained in the next section) is not the correct counterpart.
Thus we conclude that all secure SCUBA IDs that have a Chandra detection are also seen in the 1.4 GHz radio maps. Indeed, the radio is much more efficient, with a success rate here of 10/18 compared with 5/18 objects (ignoring the peculiar object SMMJ123652+621225). The count rates for these 5 Chandra sources are such that only 1 would have been detected by Chandra in an exposure time equivalent to that used for the VLA 1.4 GHz image (50 hours). So, per unit integration time, it is currently much more efficient to find SCUBA counterparts with the VLA than with Chandra.
4.2.4 X-ray properties of SCUBA objects
Including sources from the supplementary SCUBA catalogue, we present a list of 10 X-ray detected SCUBA objects in Table 2; five from the list and five from the supplemental catalogue. Only 4 are in common with the list of 7 presented in Alexander et al. (2003b). From that work, which used the previous releases of HDF-N sub-mm data, we have rejected SMMJ123622+621618 because its large distance from the sub-mm galaxy renders it an unlikely ID. SMMJ123618+621552 is in a region of extended X-ray flux, and we were unable to determine if a point source was present. Alexander et al. (2003b) re-reduce the data using different detection parameters and do find a source here, but we choose to employ only the original Ms catalogue. Neither of the two Chandra galaxies in the vicinity of SMMJ123713+621204 stand out as the correct ID, so we reject those as well.
For these Chandra identifications we calculated radio and X-ray luminosities using the formulae in Alexander et al. (2003a). We assumed a radio spectral index of 0.8 and an unobscured photon index of for each source. These results are summarized in Table 2 and Fig. 5.
The luminosities of most of the sources lie within the range determined by Bauer et al. (2002) and Shapley, Fabbiano, & Eskridge (2001) for local star-forming galaxies. Four sources lie above the relation however, suggesting an AGN component. Alexander et al. (2003a) use templates of various galaxies and quasars to argue that, although these systems harbour an AGN, their FIR luminosity is still dominated by star-formation (see also Farrah et al., 2003). Better constraints on the FIR luminosity (via observations at other sub-mm wavelengths) along with optical spectroscopy could be used to strengthen this argument, but such data are not yet available for a significant sample.
| SMM ID | X-Ray | Hardness | Effective | X-Ray flux | ||||||
|---|---|---|---|---|---|---|---|---|---|---|
| Counts | Ratio | FB | SB | HB | Jy) | (erg s-1) | (W Hz-1) | |||
| 850m detections | ||||||||||
| J123616+621516 | 1.02 | |||||||||
| J123645+621449 | 0.08 | |||||||||
| J123650+621316 | 1.64 | |||||||||
| J123701+621146 | 0.09 | |||||||||
| J123707+621410 | 0.98 | |||||||||
| Additional 850m detections | ||||||||||
| J123607+621019 | 0.74 | |||||||||
| J123608+621431 | 0.25 | |||||||||
| J123628+621046 | 2.31 | |||||||||
| J123635+621237 | 0.29 | |||||||||
| J123652+621352 | 0.13 | |||||||||

4.3 Optical-NIR imaging
The most comprehensive published optical survey, aside from the HST imaging itself, is presented in Capak et al. (2004). They obtained deep optical and near-IR (NIR) images covering the entire HDF-N Super-map in the and bands, and made the images and catalogues publicly accessible via their web page. We use their and selected catalogues (consisting of almost 49,000 objects) which cover a 0.2 deg2 region. The sub-mm map is completely contained within this area. The catalogue uses the AB magnitude system, and we conform to that convention here unless otherwise noted.
With so many sources, it is impossible to distinguish which are the correct counterparts to the SCUBA detections without some other information, so we now examine the sub-mm properties of various sub-samples of optical-NIR detected galaxies.
4.3.1 Optically Faint Radio Sources (OFRS)
Observations by Barger, Cowie & Richards (2000) and Chapman et al. (2001a) find that optically faint () galaxies detected using deep 1.4 GHz radio observations are coincident with per cent of SCUBA sources with fluxes above 5 mJy. This population has been extensively modeled (Chapman et al., 2002a, 2003a) and exploited to obtain spectroscopic redshifts of the optically detected host galaxies (Chapman et al., 2003b).
We searched for galaxies within 2 of a 1.4 GHz radio detection, and found 17 candidates. There were an additional 13 radio sources with no optical counterpart, for a total of 30 optically faint radio sources. Of these, 9 are within 7 of a SCUBA detected object. These form a subset of the 11 1.4 GHz detections found coincident with SCUBA objects without any other selection criteria. Therefore the optically faint radio sources (OFRS) have a per cent success rate in picking out SCUBA sources in the HDF-N, while the radio sources alone give only per cent. Thus OFRS are more effective at selecting sub-mm bright galaxies than radio alone. We do not find as high a rate as some other studies, but it is unclear that these fractions can be applied directly to other surveys; in the HDF-N Super-map the sensitivity to sub-mm sources is strongly variable across the field. If we restrict this analysis to the region of the sub-mm map that has an RMS noise of 1.5 mJy or lower, there are 6 out of 13 optically faint radio sources coincident with SCUBA detections (46 per cent).
4.3.2 Galaxies with red optical-NIR colours
The dust responsible for the extreme IR luminosities that SCUBA detects is also responsible for reddening the optical-UV spectrum, making such galaxies appear very red compared with the field population. Wehner, Barger & Kneib (2002) compared 850m flux densities against a list of galaxies detected with , finding a significant trend of increasing sub-mm flux density with increasing optical-NIR redness. Fig. 6 presents the results from a similar analysis we conducted using the HDF-N maps. In general, the fainter, redder galaxies are more sub-mm bright. However, we cannot easily separate the effects of redness from faintness, since they are correlated (see left part of middle panel of Fig. 6). There is weak evidence that the stacked flux density does not continue to rise for the most extremely red sources, though the completeness at these faint flux levels is lower. One important thing to note is that the stacked average is dominated by detected sources, a point also raised in Webb et al. (2004).
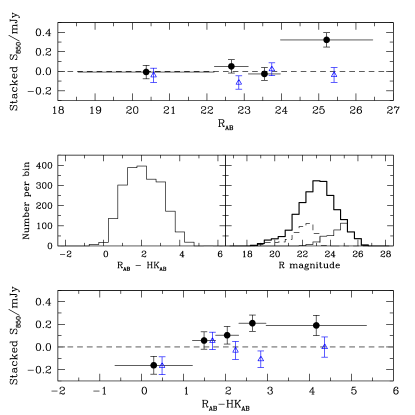
The criterion (Vega) can be used to define an ERO, motivated by being the approximate colour of an elliptical galaxy at . Applying a correction to the magnitudes to convert to (P. Capak, private communication), we calculate that is the equivalent criterion in AB magnitudes. We find 121 EROs within the Super-map. However, the stacked flux density at their positions is only mJy, indicating that EROs themselves are a poor way to pre-select SCUBA galaxies. This result echoes that of Mohan et al. (2002), who targeted a sample of 27 EROs with SCUBA and detected none down to an RMS of mJy. Only a single SCUBA source in our catalogue has an ERO within 7 (SMMJ123700+620910), and that was already detected in the radio. However, one has to be careful with direct comparisons, since the near-IR data we have used are shallower than those available in some other fields, and it may well be that one finds a higher ERO rate with deeper -band imaging.
4.3.3 Optical LBG drop-out surveys
Because of their inferred high star-formation rates and large co-moving number density, Lyman-Break Galaxies (LBGs, Steidel et al. 1998) make an interesting target for sub-mm studies. Using reasonable conversion factors based on local standards, the predicted 850m flux densities are expected to be on the order of 5 mJy. However, sub-mm surveys to date have failed to detect LBGs, except in a handful of cases (Chapman et al., 2000, 2001b; Peacock et al., 2000; Webb et al., 2003a).
The HDF-N Super-map covers much more area than previous attempts, and contains many more known LBGs. Steidel et al. (2003) find 132 LBG candidates (selected photometrically) in a 73 square arcminute region within the HDF. However, the stacked 850m flux density is mJy confirming previous results that LBGs are typically SCUBA-faint. We also performed a cross-clustering analysis like that described in the X-ray section, but failed to detect any signal.
In the HDF-N region, only two LBGs seem co-incident with a SCUBA source. SMMJ123656+621201 (also known as HDF 850.2) has a pair of possible LBG counterparts located within 5. However, as we discuss in Section 5, this pair may not constitute the correct ID. In any case, sub-mm bright galaxies are much rarer than LBGs, with only 1 SCUBA galaxy (with mJy) per 7 arcmin2, compared with roughly 8 LBGs (at ) over the same area. Hence, even if there is complete overlap between the populations, number counts alone suggest that the typical LBG must have an average 850m flux density of a fraction of a mJy.
4.3.4 Are optical surveys a good way to identify SCUBA sources?
Webb et al. (2003b) argue that NIR selected sources found in deep () imaging are just as effective at identifying SCUBA sources as 1.4 GHz images (with a RMS of Jy) in the CUDSS 14h sub-mm field (Eales et al., 1999). However, this only relates to finding a counterpart of a known SCUBA source. We have explored various brightness and colour cuts and find that no optical-only criteria is successful at pre-selecting SCUBA galaxies.
Nevertheless, we can examine the optical properties of the radio sources to see if they have anything in common that can be used to select the counterpart to a known SCUBA detection. In Table 3 we present a list of the radio detected SCUBA sources (from the catalogue) in the HDF-N with optical/NIR sources detected nearby . We restrict the list to the 6 radio detected objects that have an optically detected counterpart. There is one additional source that meets this criterion (SMMJ123652+621225), but we exclude it from the list for reasons explained later.
We find that of the 6 SCUBA galaxies we are considering, 3 have the radio source also coincident with the optical source closest to the centroid. Still, one would be hard-pressed, without the radio data, to decide between the objects around SMMJ123645+621449. In short, though some of the optical-only IDs would have selected the correct counterpart, there are many cases, especially in crowded fields, where it becomes too difficult to ascertain with any confidence. We do note, however, that in half the cases we would have chosen the correct ID just by picking the reddest galaxy within 7.
| Object Name | Radio | |||
|---|---|---|---|---|
| SMMJ123616+621516 | 3.1 | |||
| 4.2 | Y | |||
| SMMJ123618+621552 | 3.5 | Y | ||
| 6.6 | ||||
| SMMJ123645+621449 | 1.9 | |||
| 2.2 | Y | |||
| 2.9 | ||||
| 3.2 | ||||
| 5.4 | ||||
| SMMJ123650+121316 | 0.6 | |||
| 5.5 | ||||
| 6.7 | Y | |||
| SMMJ123707+621410 | 4.3 | Y | ||
| 4.6 | ||||
| 6.7 | ||||
| SMMJ123701+621146 | 2.6 | Y | ||
| 3.8 | ||||
| 4.9 | ||||
| 4.9 | ||||
| 5.9 |
Webb et al. (2003b) also claim that clumps of 2 or more nearby EROs demarcate regions where a sub-mm source can be found. It is certainly interesting to see if regions of over-density in one catalogue are good tracers of objects in another. Thus, we took the optical catalogues and counted the number of objects that have at least one neighbour within 10, 20, and 30 arcseconds of another. We then assess how many sub-mm sources would be detected within the size of the SCUBA array if clumps of red galaxies were targeted.
For galaxies with colours (EROs), we find 6 that have at least one neighbour within 10. The 3 SCUBA pointings required to cover these 6 objects would have found a single source in our sub-mm catalogue. This is roughly the same efficiency as simply pointing the telescope at random spots on the sky. Overall, we can find no cut on the optical catalogues using spatial correlations, colour, or magnitude that would allow us to pre-select regions where SCUBA sources would be found.
4.4 ISO mid-IR imaging
ISO observed a roughly area around the HDF-N at both 7 and 15m. The data were reduced separately by three different groups (Goldschmidt et al., 1997; Aussel et al., 1999; Désert et al., 1999), and here we use the 15m catalogue found in Aussel et al. (1999). They present a list of 49 objects with high SNR, and an additional 50 with lower confidence, covering a total area of 24 arcmin2. The positions are accurate to within 3.
Concentrating first on the 49 secure ISO 15m detections, we find a stacked 850m flux density of mJy, which drops to mJy after removing sections around SCUBA sources. The list of 50 less secure detections gives similar results, and the overall (99 sources) stacked flux density is significantly detected at mJy. The brightest third of the ISO sources (mJy) have the strongest stacked flux density, with an average value of mJy. We later conclude that only 1 object from our catalogue has a 15m counterpart, despite the low probability that 4 of 13 SCUBA galaxies would have an ISO source within 7 by chance (see Table 1). Of the other SCUBA sources with nearby ISO sources, one is identified with an unrelated radio source and the remaining are inconclusive.
5 Counterparts of each SCUBA object
5.1 General criteria for counterpart identification
We now come to a detailed description of the counterparts of the SCUBA detected objects. Of all the correlations presented thus far, the 1.4 GHz–850m overlap is by far the strongest. Thus in this section there will naturally be an emphasis on the radio sources. Based on the strength of this correlation, we will not only consider the sources formally detected at in the 1.4 GHz map presented by Richards (2000), but fainter ones as well. Richards (2000) find that the 1.4 GHz differential number counts are well fit by a power law of index . Assuming uniform noise, the number of sources brighter than an noise limit goes as . Thus for a cut, there are about twice as many sources. This is still small enough that chance overlap with a large number of SCUBA detected galaxies is negligible. There is no question that a few of these fainter sources will be spurious however, so we lend them weight only if there is an object detected in the optical, NIR, or X-ray bands at the same position.
We will not assign a secure ID to SCUBA sources unless they are detected at in the radio, but will offer tentative IDs for sources that are faint and red, or are the only object detected within the error circle. Together, this leads to a reasonable recipe for identifying counterparts for the SCUBA objects:
-
1.
Strongly detected () 1.4 GHz sources within 7 of the SCUBA centroid will be deemed the host of the sub-mm emission. Optical, NIR, and X-ray properties will be based on the object that is coincident with the radio position (if any).
-
2.
Weakly detected ( 1.4 GHz sources within 7, with a counterpart in another band that has similar or better resolution, will be chosen as the identification with the sub-mm source.
-
3.
A detection in any band, within the search radius, will be flagged as a possible identification if and only if no other candidate in the vicinity is detected.
A description of each source, and images of each are presented in the appendices (Figs. 7–9). We summarize the counterparts in Table 4. We suggest 10 secure identifications in the SCUBA source list, and a further 2 tentative IDs, as well as 5 secure IDs for the 3.5– sources and 1 tentative for the m sources. Although in each case the radio galaxy is used for the secure counterpart, our selection criterion apparently fails for the one special source we have alluded to throughout this paper.
5.2 The curious case of SMMJ123652+621225
The radio detected Chandra galaxy 5.7 to the South-west of this SCUBA source seemingly obvious choice. However, deeper observations have revealed that this is not the case. This sub-mm source, usually called HDF 850.1, has been the subject of intense scrutiny since its discovery in the initial deep sub-mm survey of the HDF by Hughes et al. (1998). After years of effort, Dunlop et al. (2004) now claim that the counterpart for 850.1 has been determined.
Using the IRAM interferometer, the sub-mm flux was resolved with a positional uncertainty of (Downes et al., 1999). However, it was not found coincident with the VLA source mentioned above, but rather a new and very faint radio source found by co-adding VLA and MERLIN data.
It cannot be stressed how difficult obtaining this (tentative) counterpart has been. Fortunately, the majority of SCUBA objects do not appear to suffer from being in a such a complicated system. Nevertheless, experience with this object only highlights the need for better angular resolution and sensitivity for sub-mm observations, as it calls into question the validity of any counterpart.
| SMM ID | J2000 | Optical | Bands | Comments | |||||||
| 12h | ( ) | (Jy) | (Jy) | (mJy) | (mJy) | (Jy) | |||||
| 850m detections | |||||||||||
| J123607+621143 | |||||||||||
| J123608+621249 | 36:08.530 | 12:49.61 | 0.4 | O | Tentative | ||||||
| J123616+621516 | 36:16.148 | 15:13.67 | 4.4 | RXO | Secure | ||||||
| J123618+621007 | |||||||||||
| J123618+621552 | 36:18.328 | 15:50.48 | 3.5 | RO | Secure | ||||||
| J123621+621252 | |||||||||||
| J123621+621710 | 36:21.272 | 17:08.40 | 2.5 | R | Secure | ||||||
| J123622+621616 | 36:22.625 | 16:21.28 | 4.4 | O | Tentative (pair) | ||||||
| J123634+621407 | |||||||||||
| J123637+621155 | 36:37.565 | 11:56.32 | 4.0 | R | Secure | ||||||
| J123645+621449 | 36:46.049 | 14:48.69 | 2.2 | R8XO | Secure | ||||||
| J123650+621316 | 36:49.708 | 13:12.78 | 7.0 | RXOI | Secure | ||||||
| J123652+621225 | 36:51.760 | 12:21.30 | 5.7 | (HDF 850.1) | |||||||
| J123656+621201 | 36:56.605 | 12:07.62 | 5.8 | R | Secure | ||||||
| J123700+620910 | 37:00.256 | 09:09.75 | 1.5 | R8 | Secure | ||||||
| J123701+621146 | 37:01.574 | 11:46.62 | 2.3 | R8XO | Secure (ERO) | ||||||
| J123702+621301 | |||||||||||
| J123707+621410 | 37:07.208 | 14:08.08 | 4.4 | R8XO | Secure | ||||||
| J123713+621204 | |||||||||||
| 850m detections – | |||||||||||
| J123607+621019 | 36:06.850 | 10:21.38 | 3.2 | RXO | Secure | ||||||
| J123608+621431 | 36:08.592 | 14:35.77 | 4.1 | RX | Secure | ||||||
| J123611+621213 | |||||||||||
| J123628+621046 | 36:29.134 | 10:45.79 | 3.4 | RXO | Secure | ||||||
| J123635+621237 | 36:34.515 | 12:41.01 | 7.6 | R8XOI | Secure | ||||||
| J123636+620658 | |||||||||||
| J123647+621840 | |||||||||||
| J123652+621352 | 36:52.76 | 13:54.1 | 2.0 | 8XO | Secure | ||||||
| J123653+621119 | |||||||||||
| J123659+621452 | |||||||||||
| J123706+621849 | |||||||||||
| J123719+621107 | |||||||||||
| J123730+621055 | |||||||||||
| J123730+621855 | |||||||||||
| J123741+621225 | |||||||||||
| 450m detections | |||||||||||
| J123619+621127 | 36:19.370 | 11:25.6 | 2.0 | Tentative | |||||||
| J123632+621542 | |||||||||||
| J123702+621009 | |||||||||||
| J123727+621042 | |||||||||||
| J123743+621609 | |||||||||||
5.3 Available redshift information for the SCUBA sources in the HDF-N
Determining redshifts of the SCUBA population is critical in order to place these systems in their correct cosmological context, but this has proven difficult observationally.
Extensive spectroscopic redshift campaigns have been performed in the HDF-N over the past several years (Cohen et al., 2000; Barger, Cowie & Richards, 2000; Barger et al., 2002). An accounting of available spectroscopic and photometric redshifts was recently presented in Cowie et al. (2004) and Wirth et al. (2004). Unfortunately the overlap with SCUBA counterparts is low, so we are forced to use FIR photometric redshift estimators as well. In Table 5 we provide estimates based on the sub-mm only data, as well as those derived using the Carilli-Yun method (Carilli & Yun, 1999, 2000, hereafter called the ‘CY estimator’) which also employs radio information. Since none of the sources are detected at 450m, the sub-mm limits are essentially useless, but even with high signal-to-noise detections at 450 and 850m, estimating redshifts using FIR SEDs is difficult (Blain, Barnard, & Chapman, 2003). The CY-estimator is much more constraining.
For the few sources that do have spectroscopic redshifts, the photometric redshifts seem reasonable, although the agreement is far from perfect. The most obvious exceptions are SMMJ123607+621019 and SMMJ123608+621431, which prefer larger redshifts than found by optically based measurements. We already noted that the field around both are quite complex, and lensing may be a factor. However, without confirmation from a CO line detection, higher resolution sub-mm data, or further SED information, we are unable to determine whether these are unusual SCUBA galaxies or the wrong identification.
| ID | |||
|---|---|---|---|
| 850m detections | |||
| SMMJ123607+621143 | |||
| SMMJ123608+621249 | ? | ||
| SMMJ123616+621516 | 2.06a,b | ||
| SMMJ123618+621007 | |||
| SMMJ123618+621552 | ? | ||
| SMMJ123621+621252 | |||
| SMMJ123621+621710 | ? | ||
| SMMJ123622+621616 | ? | ||
| SMMJ123634+621407 | |||
| SMMJ123637+621155 | ? | ||
| SMMJ123645+621449 | ? | ||
| SMMJ123650+621316 | 0.475c | ||
| SMMJ123652+621225 | |||
| SMMJ123656+621201 | ? | ||
| SMMJ123700+620910 | ? | ||
| SMMJ123701+621146 | 1.52a,b | ||
| SMMJ123702+621301 | |||
| SMMJ123707+621410 | ? | ||
| SMMJ123713+621204 | |||
| Additional 850m detections | |||
| SMMJ123607+621019 | 0.47a,b | ||
| SMMJ123608+621431 | 0.472c | ||
| SMMJ123611+621213 | |||
| SMMJ123628+621046 | 1.013d | ||
| SMMJ123635+621237 | 1.219d | ||
| SMMJ123636+620658 | |||
| SMMJ123647+621840 | |||
| SMMJ123652+621352 | 1.355d | ||
| SMMJ123653+621119 | |||
| SMMJ123659+621452 | |||
| SMMJ123706+621849 | |||
| SMMJ123719+621107 | |||
| SMMJ123730+621055 | |||
| SMMJ123730+621855 | |||
| SMMJ123741+621225 | |||
6 Caveats to source identifications
It cannot be stressed strongly enough that the Jy 1.4 GHz radio detections have a high degree of overlap with SCUBA sources, and that they currently constitute the best way to find counterparts to the sub-mm detected objects. However, there are some cases where the ID still remains ambiguous. HDF 850.1 (SMMJ123652+621225) is a particularly pathological example of how the nearby VLA source may not be the correct ID. SMMJ123645+621449 is a case where 2 radio sources are present near the sub-mm source, and it is difficult to choose which might be the correct ID. Thus the radio-detected sub-mm galaxies that are shaping our understanding of the entire SCUBA population are by no means immune to selection biases. However, it is encouraging that follow-up IRAM observations are detecting CO emission at the redshifts determined via optical spectroscopy (Frayer et al., 1999; Greve, Ivison, & Papadopoulos, 2003; Neri et al., 2003).
One also has to be aware of two other complications with the identification process – clustering and lensing. Since sub-mm galaxies are believed to be associated with merging systems, then it is likely that in many cases the sub-mm bright galaxy will be physically associated but distinct from one or more other galaxies which may be sub-mm faint. So one has to be careful when investigating the SEDs, that one is not combining data from multiple objects with very different spectral properties.
Lensing is a further complication, which we know is an important issue for some sub-mm sources in rich cluster fields (Kneib et al., 2004; Borys et al., 2004) and has been suggested for a couple of sources in the HDF region (SMMJ123652+621225 and SMMJ123637+621155). Lensing may make a sub-mm source apparently associated with a galaxy which actually in the foreground.
7 Summary and Future Work
Concentrating on the more secure () SCUBA sources, we find that 10 out of 19 have a VLA 1.4 GHz radio counterpart, and at least one more has radio detected at a fainter level in a combined map (J123652+6211225, a.k.a. HDF 850.1). This is in line with results from Ivison et al. (2002), Chapman et al. (2002a), Barger, Cowie & Richards (2000), and Greve et al. (2004). This strong overlap, along with the well determined radio positions, has recently been exploited to obtain redshifts for a large fraction of this subset of sources (Chapman et al., 2003b). However, significant improvements in radio sensitivity are required in order to detect the fainter SCUBA sources, particularly if some of them lie at higher redshifts. Because of this, one cannot simply accept the nearest detected radio source as the correct ID. For example, we argue (see Appendix) in the case of SMMJ123622+621618 that the radio source 13 away is not responsible for the sub-mm emission (as reported in Barger, Cowie & Richards 2000). Radio sources on their own are not a good way to pre-select SCUBA galaxies, but we note that the sub-sample of radio detections with have at least a roughly 30 per cent detection rate in the SCUBA map of HDF-N. This is a lower limit, since much of the sub-mm map is simply too insensitive to sources with mJy, which is the flux density level where Chapman et al. (2002a) find a much higher (roughly 70 per cent) success rate.
Although X-ray observations help us understand the nature of the SCUBA detected galaxies, they are not useful in the counterpart ID process in the HDF region. The ID rate is such that the VLA can detect, in a tenth of the time, all the SCUBA galaxies detected by Chandra.
There is weak evidence suggesting that the reddest object in the vicinity of a SCUBA source is correct optical counterpart, but we found no compelling evidence that optical properties alone aid in determining counterparts.
Despite the wealth of deep multi-wavelength data in this part of the sky, almost half of our sources have an undetermined counterpart, clearly demonstrating how difficult it is to make secure identifications. Nevertheless, continued sub-mm imaging in concert with deep HST and Spitzer data in the region should allow us to characterise the rest-frame UV-NIR spectra of at least the radio-identified galaxies. Confidence in the radio-unidentified half needs to wait for higher resolution sub-mm images from ALMA. But in the meantime there is a realistic hope of being able to obtain a full accounting of the sub-mm galaxies in this one small field, and in particular to find out the nature of the currently unidentified half.
Acknowledgments
We would like to thank Peter Capak, Chuck Steidel, Mark Dickinson, Seb Oliver, and Tracy Webb for useful discussions. CB also thanks Ian Smail and Andrew Blain for useful advice on the content and presentation of this paper. We also appreciate advice from the referee which helped streamline the text. This work was supported in part by the Natural Sciences and Engineering Research Council of Canada, as well as by a grant from NASA administered by the American Astronomical Society. The James Clerk Maxwell Telescope is operated by The Joint Astronomy Center on behalf of the Particle Physics and Astronomy Research Council of the United Kingdom, the Netherlands Organisation for Scientific Research, and the National Research Council of Canada. Much of the data for this paper was obtained via the Canadian Astronomy Data Centre, which is operated by the Herzberg Institute of Astrophysics, National Research Council of Canada.
References
- Alexander et al. (2003a) Alexander D.M., et al., 2003a, AJ, 125, 383
- Alexander et al. (2003b) Alexander D.M., et al., 2003b, AJ, 126, 539
- Almaini et al. (2003) Almaini O., et al., 2003, MNRAS, 338, 303
- Almaini et al. (2002) Almaini O., et al., 2002, A New Era in Cosmology, ed. Shanks T., Metcalfe N., ASP Proc. 283, Astron. Soc. Pac., San Francisco, p.377
- Aussel et al. (1999) Aussel H., Cesarsky C.J., Elbaz D., Starck J.L., 1999, A&A, 342, 313
- Barger et al. (2002) Barger A.J., Cowie L.L., Brandt W.N., Capak P., Garmire G.P., Hornschemeier A.E., Steffen A.T., Wehner E.H., 2002, AJ, 124, 1839
- Barger, Cowie & Richards (2000) Barger A.J., Cowie L.L., Richards E.A., 2000, AJ, 119, 2092
- Bauer et al. (2002) Bauer F.E., Alexander D.M., Brandt W.N., Hornschemeier A.E., Vignali C., Garmire G.P., Schneider D.P., 2002, AJ, 124, 2351
- Blain, Barnard, & Chapman (2003) Blain A.W., Barnard V.E., Chapman S.C., 2003, MNRAS, 338, 733
- Blain et al. (2002) Blain A.W., Smail I., Ivison R.J., Kneib J.-P., Frayer D.T., 2002, Phys. Rep., 369, 111
- Borys et al. (2002) Borys C., Chapman S.C., Halpern M., Scott D., 2002, MNRAS, 330, L63
- Borys et al. (2003) Borys C., Chapman S., Halpern M., Scott D., 2003, MNRAS, 344, 385
- Borys et al. (2004) Borys C., et al., 2004, MNRAS, in press (astro-ph/0404473)
- Capak et al. (2004) Capak P., et al., 2004, AJ, 127, 180
- Carilli & Yun (1999) Carilli C.L., Yun M.S., 1999, ApJ, 513, L13
- Carilli & Yun (2000) Carilli C.L., Yun M.S., 2000, ApJ, 530, 618
- Chapman et al. (2000) Chapman S.C., et al., 2000, MNRAS, 319, 318
- Chapman et al. (2001a) Chapman S.C., Richards E.A., Lewis G.F., Wilson G., Barger A.J., 2001a, ApJ, 548, L147
- Chapman et al. (2001b) Chapman S., Scott D., Borys C., Halpern M., 2001b, Deep Millimeter Surveys, ed. J.D. Lowenthal, D.H. Hughes, World Scientific, Singapore, p.
- Chapman et al. (2002a) Chapman S.C., Lewis G.F., Scott D., Borys C., Richards E., 2002a, ApJ, 570, 557
- Chapman et al. (2002b) Chapman S.C., Shapley A., Steidel C., Windhorst R., 2002b, ApJ, 572, L1
- Chapman et al. (2003a) Chapman S.C., et al., 2003a, ApJ, 585, 57
- Chapman et al. (2003b) Chapman S.C., Blain A.W., Ivison R.J., Smail I.R., 2003b, Nature, 422, 695
- Cohen et al. (2000) Cohen J.G., Hogg D.W., Blandford R., Cowie L.L., Hu E., Songaila A., Shopbell P., Richberg K., 2000, ApJ, 538, 29
- Condon (1992) Condon J.J., 1992, ARA&A, 30, 575
- Cowie et al. (2004) Cowie L.L., Barger A.J., Hu E.M., Capak P., Songaila A., 2004, ApJ, submitted
- de Ruiter, Arp & Willis (1977) de Ruiter H.R., Arp H.C., Willia A.G., A&AS, 28, 211
- Désert et al. (1999) Désert F.-X., Puget J.-L., Clements D.L., Pérault M., Abergel A., Bernard J.-P., Cesarsky C.J., 1999, A&A, 342, 363
- Downes et al. (1986) Downes A.J.B., Peacock J.A., Savage A., Carrie D.R., 1986, MNRAS, 218, 31
- Downes et al. (1999) Downes D., et al., 1999, A&A, 347, 809
- Dunlop et al. (2004) Dunlop J. S., et al., 2004, MNRAS, 350, 769
- Eales et al. (1999) Eales S., Lilly S., Gear W., Dunne L., Bond J.R., Hammer F., Le Fèvre O., Crampton D., 1999, ApJ, 515, 518
- Farrah et al. (2003) Farrah D., Afonso J., Efstathiou A., Rowan-Robinson M., Fox M., Clements D., 2003, MNRAS, 343, 585
- Ferguson et al. (2000) Ferguson H., Dickinson M., Williams R., 2000, ARAA, 38, 667
- Fixsen et al. (1998) Fixsen D.J., Dwek E., Mather J.C., Bennett C.L., Shafer, R.A. 1998, ApJ, 508, 123
- Frayer et al. (1999) Frayer D.T., et al., 1999, ApJ, 514, L13
- Garrett et al. (2000) Garrett M.A., de Bruyn A.G., Giroletti M., Baan W.A., Schilizzi R.T., 2000, A&A, 361, L41
- Goldschmidt et al. (1997) Goldschmidt P., et al., 1997, MNRAS, 289, 465
- Greve, Ivison, & Papadopoulos (2003) Greve T.R., Ivison R.J., Papadopoulos P.P., 2003, ApJ, 599, 839
- Greve et al. (2004) Greve T.R., Ivison R.J., Bertoldi F., Stevens J.A., Dunlop J.S., Lutz D. ,Carilli C.L., 2004, MNRAS, submitted (see astro-ph/0405361)
- Hamilton (1993) Hamilton A.J.S., 1993, ApJ, 417, 19
- Hauser et al. (1998) Hauser M.G., et al. 1998, ApJ, 508, 25
- Holland et al. (1999) Holland W.S., et al., 1999, MNRAS, 303, 659
- Hughes et al. (1998) Hughes D.H., et al., 1998, Nature, 394, 241
- Ivison et al. (2002) Ivison R.J., et al., 2002, MNRAS, 337, 1
- Johnstone et al. (2000) Johnstone D., Wilson C. D., Moriarty-Schieven G., Giannakopoulou-Creighton J., Gregersen E., 2000, ApJS, 131, 505
- Kneib et al. (2004) Kneib J., van der Werf P.P., Kraiberg Knudsen K., Smail I., Blain A., Frayer D., Barnard V., Ivison R., 2004, MNRAS, 349, 1211
- Mendez & Guzman (1998) Mendez R.A., Guzman R., 1998, A&A, 333, 106
- Mohan et al. (2002) Mohan N.R., Cimatti A., Röttgering H.J.A., Andreani P., Severgnini P., Tilanus R.P.J., Carilli C.L., Stanford S.A., 2002, A&A, 383, 440
- Nandra et al. (2002) Nandra K., Mushotzky R.F., Arnaud K., Steidel C.C., Adelberger K.L., Gardner J.P., Teplitz H.I., Windhorst R.A., 2002, ApJ, 576, 625
- Neri et al. (2003) Neri R., et al., 2003, ApJ, 597, L113
- Nousek et al. (1987) Nousek J.A., Garmire G.P., Ricker G.R., Collins S.A., Reigler G.R., 1987, ApL&C, 26, 35
- Peacock et al. (2000) Peacock J.A., et al., 2000, MNRAS, 318, 535
- Prestage & Peacock (1983) Prestage R.M., Peacock J.A., 1983, MNRAS, 204, 355
- Puget et al. (1996) Puget J.-L., Abergel A., Bernard J.-P., Boulanger F., Burton W.B., Desert F.-X., Hartmann D. 1996, A&A, 308, L5
- Richards (2000) Richards E.A., 2000, ApJ, 533, 611
- Richards et al. (1998) Richards E.A., Kellermann K.I., Fomalont E.B., Windhorst R.A., Partridge R.B., 1998, AJ, 116, 1039
- Scott et al. (2002) Scott S.E., et al., 2002, MNRAS, 331, 817
- Scott & Tout (1989) Scott D., Tout C.A. 1989, MNRAS, 241, 109
- Serjeant et al. (2003) Serjeant S., et al., 2003, MNRAS, 344, 887
- Shapley, Fabbiano, & Eskridge (2001) Shapley A., Fabbiano G., Eskridge P.B., 2001, ApJS, 137, 139
- Steidel et al. (1998) Steidel C.C., Adelberger K.L., Dickinson M., Giavalisco M., Pettini M., Kellogg M., 1998, ApJ, 492, 428
- Steidel et al. (2003) Steidel C.C., Adelberger K.L., Shapley A.E., Pettini M., Dickinson M., Giavalisco M., 2003, ApJ, 592, 728
- Stocke et al. (1991) Stocke J.T., Morris S.L., Gioia I.M., Maccacaro T., Schild R., Wolter A., Fleming T.A., Patrick H.J., 1991, ApJS, 76, 813
- Webb et al. (2003a) Webb T.M., et al., 2003a, ApJ, 582, 6
- Webb et al. (2003b) Webb T.M.A., Lilly S.J., Clements D.L., Eales S., Yun M., Brodwin M., Dunne L., Gear W.K., 2003b, ApJ, 597, 680
- Wehner, Barger & Kneib (2002) Wehner E.H., Barger A.J., Kneib J.-P., 2002, ApJ, 577, L83
- Williams et al. (1996) Williams R.E., Blacker B., Dickinson M., et al., 1996, AJ, 112, 1335
- Wirth et al. (2004) Wirth G. D., et al., 2004, AJ, 127, 3121
- Wang, Cowie & Barger (2004) Wang W.-H., Cowie L., Barger A., 2004, ApJ in press
- Webb et al. (2004) Webb T. M. A., Brodwin M., Eales S., Lilly S. J., 2004, ApJ, 605, 645
- Webb & Sawicki (2004) Webb T. M. A., Sawicki M., 2004, ApJL, in press, see astro-ph/0402454
Appendix A Multi-wavelength description of sub-mm detected sources in GOODS-N
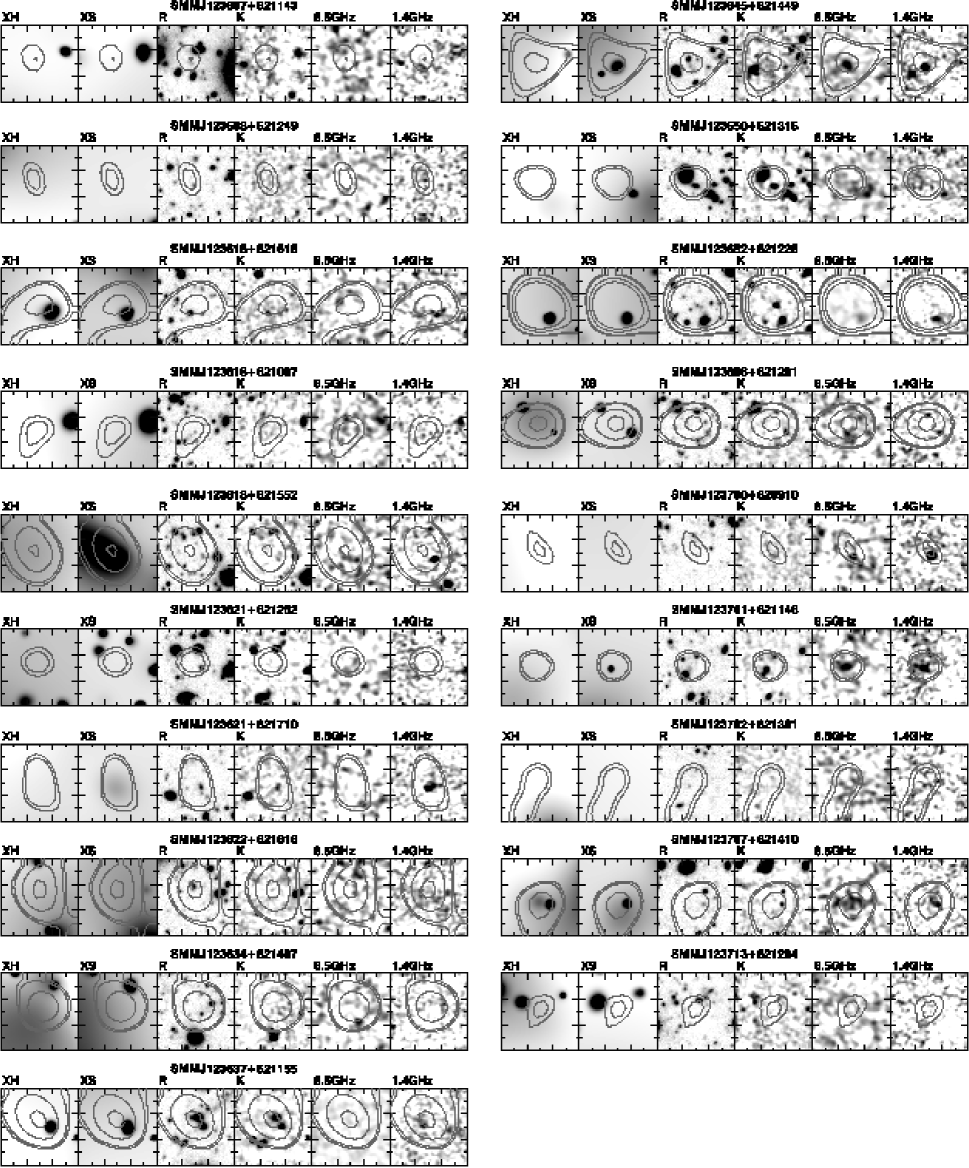
A.1 850m sources from the primary catalogue
Here we describe the 19 objects in the HDF-N SCUBA catalogue. We name the objects according to their positions and using the ‘SMMJ’ prefix, which has become conventional. In square brackets we use the letters J, S, and P to indicate that the data were collected by jiggle-map, scan-map, or photometry observations, respectively. All optical magnitudes are given in the AB system. The 19 strips of postage stamps are shown in Fig. 7, and some of the collected photometry can be found in Tables 2 and 4.
SMMJ123607+621143 [S]: A weak radio source detected by WSRT lies 8 to the East. An inspection of the VLA map shows a peak near this position, although it is 2 even further East from the SCUBA galaxy (but consistent with the offset between the catalogues as discussed previously). Interestingly, the weak VLA source is coincident with a red ( galaxy. Given the rarity of such sources, it is tempting to associate the sub-mm galaxy with it, despite the offset. However, this is well outside our 7 search radius, so we dismiss it. There are 5 optically detected objects within the search area but with no further information we cannot assign a robust counterpart to this source.
SMMJ123608+621249 [S]: This source lies directly on top of a very faint object (). There are no other optical counterparts within 7, and no radio or X-ray objects anywhere near the SCUBA source, thus suggesting this as the tentative ID.
SMMJ123616+621516 [JS]: 2 radio sources are found within 7, one from the WSRT and one from the VLA. These are not spatially coincident, but given that the fluxes are comparable, and the WSRT position is West of the VLA source (again consistent with the offset between the catalogues), they are likely to be the same source. The optical counterpart is fairly faint, and appears to have a faint red companion 1 to the North-west. Coincident with the radio ID is a blended Chandra source. Note that this object is discussed in some detail in Alexander et al. (2003a). They describe the second X-ray source as invisible in the radio and optical, and though not formally detected, the postage stamps do suggest that the second object is red and radio faint. We choose the radio detected X-ray source as the ID, though point out that the sub-mm flux may be due to the much fainter optically detected galaxy, or a combination of both.
SMMJ123618+621007 [JS]: The VLA source (detected in X-ray and optical images) 13 away is too far to comfortably call it the counterpart. Within 20 there are 3 LBGs, but the closest is 8.3 away. Since we find 2 optically detected galaxies within 6, we cannot assign an ID. We note an even fainter galaxy which, although not in the optical catalogue, is seen in the optical thumb-nails and seems to lie directly on the SCUBA centroid.
SMMJ123618+621552 [JS]: A strong 1.4 GHz VLA source (Jy) with a very steep spectrum lies 3.5 to the South-west. An 8.5 GHz source is also seen there, though not formally listed in the catalogue. We consider this radio source to be the counterpart. The only optically detected galaxy in the search region is a faint optical source 2 North of the VLA position, but a fainter (and formally undetected) source is coincident with the radio.
SMMJ123621+621252 [JS]: Two optically detected galaxies are present within the search area, meaning we cannot assign a robust ID. Outside of the 7 search radius, the field is rather dense with optically detected galaxies. There are also 7 Chandra sources in total within 18 of the SCUBA source.
SMMJ123621+621710 [JS]: An extended radio source is coincident with the SCUBA position. Its North-western end is coincident with an optically detected galaxy that has an elongated morphology perpendicular to the radio extension. Although not listed in the 2 Ms Chandra catalogue, there is extended soft X-ray emission clearly seen. We use this VLA source as the SCUBA counterpart.
SMMJ123622+621616 [JS]: Barger, Cowie & Richards (2000) associates this object with the radio source 13 to the North. This is well outside our search radius however, and we do not assign it as the correct ID. Alexander et al. (2003a) use this object as a possible example of a Compton-thick AGN, but they noted the inferred redshift (), based on a iron line in the X-ray spectrum, was considerably different than that obtained via fits to the FIR-radio SED of the galaxy (). In the optical catalogues, there is a pair of galaxies separated by less than 1 and 3 other objects within the 7 search radius.
SMMJ123634+621407 [JS]: Although the field is dense in optically detected sources, one unique object in the vicinity is an X-ray detected LBG with . The 11.4 offset is rather large, especially considering the 850m flux density is well above the confusion level and the SNR is high. The ISO 15m detection 5.3 to the South is the more appealing counterpart, and there is an 8.5 GHz object coincident with the ISO centroid. However it is not listed in the 8.5 GHz catalogue, and no 1.4 GHz or optical flux is detected here. We conclude that there is no robust counterpart.
SMMJ123637+621155 [JSP]: A radio detection by the WSRT (but not VLA) does not appear coincident with any other object, but the VLA map does reveal radio flux, though not quite at the same position. Seemingly unrelated are two optical candidates, which both have spectroscopic redshifts, and lie within 4 of the SCUBA source. The first is a galaxy with . The second is a galaxy with , which also happens to line up with a soft X-ray source. At these redshifts it is difficult to understand the lack of a radio detection if one of these two objects were the SCUBA counterpart. As explained in Section 4.2.3, we suggest that these optically detected galaxies are lensing the SCUBA source, and that the radio object is the true ID.
SMMJ123645+621449 [SP]: There are two 1.4 GHz VLA sources coincident with Chandra detections near the SCUBA source, and we choose the one closest to the SCUBA centroid (also the brighter of the two). This object is also detected at 8.5 GHz. The other radio source is detected by ISO. Redshifts would be useful for determining if the radio pair is indeed spatially related.
SMMJ123650+621316 [JSP]: The counterpart that meets our criterion is detected in most wave-bands – both radio frequencies, 15m, X-ray, and optical, and also has a redshift of . The faintness of this sub-mm source suggests that confusion noise may be a particular problem, but if the radio flux is coming from the SCUBA source, then the radio/sub-mm flux density ratio is a factor of 10 too low for this redshift. Note that this SCUBA source is considered as two distinct objects (HDF 850.4/HDF 850.5) by Serjeant et al. (2003), but the combined sub-mm data that make up the Super-map yield only a single source. Since its profile is quite Gaussian, we do not treat the possibility of it being two sources.
SMMJ123652+621225 [JSP]: This object (a.k.a. HDF850.1) is discussed at length in Section 5.2.
SMMJ123656+621201 [JSP]: This SCUBA object is commonly called HDF 850.2, and at only 3.7 mJy, has a position that may be affected by confusion noise. The faint radio source 5.8 to the North seems like the correct ID, but has no optical counterpart. We note that there is a pair of LBGs just to the South-west, one of which is Chandra detected and has radio emission just below the VLA catalogues’ threshold. The LBG was discussed by Nandra et al. (2002), who noted that if at redshift 3, this galaxy is almost certainly an AGN, given its X-ray luminosity. If at the same redshift, the small separation of the LBGs suggests they are interacting, which makes it an appealing choice for the SCUBA counterpart. Another mark in its favour is that the sub-mm flux density is very small, which would be in line with the rare sub-mm detections of LBGs. Although the LBGs are the more interesting case, our counterpart criterion favours the faint radio detected object.
SMMJ123700+620910 [JS]: The only obvious contender is an optically invisible radio source (detected by the VLA at both frequencies) only a few arcseconds away from the SCUBA position.
SMMJ123701+621146 [JS]: Directly on top of the SCUBA centroid is a striking radio and X-ray detected ERO. The object 2 to the South-east of the ERO has a redshift of 0.884 and an ISO 15m detection. However, it is possible that the ISO flux is actually coming from the ERO. Given the proximity of the source, the ERO may well be lensed by the foreground () galaxy.
SMMJ123702+621301 [JSP]: The elongated contours suggest the blending of 2 nearby sources. The lower part does seem to be centred on an optically detected galaxy. However, we find no convincing counterpart to the SCUBA source.
SMMJ123707+621410 [JSP]: The correct identification seems highly likely to be the optically red radio and X-ray detected object right on top of the SCUBA source.
SMMJ123713+621204 [JS]: There are no radio, red objects, or X-ray sources nearby that are convincing enough to call a counterpart. Two galaxies in the -selected catalogue fall within 7, but we are unable to determine which (if either) is the correct ID.
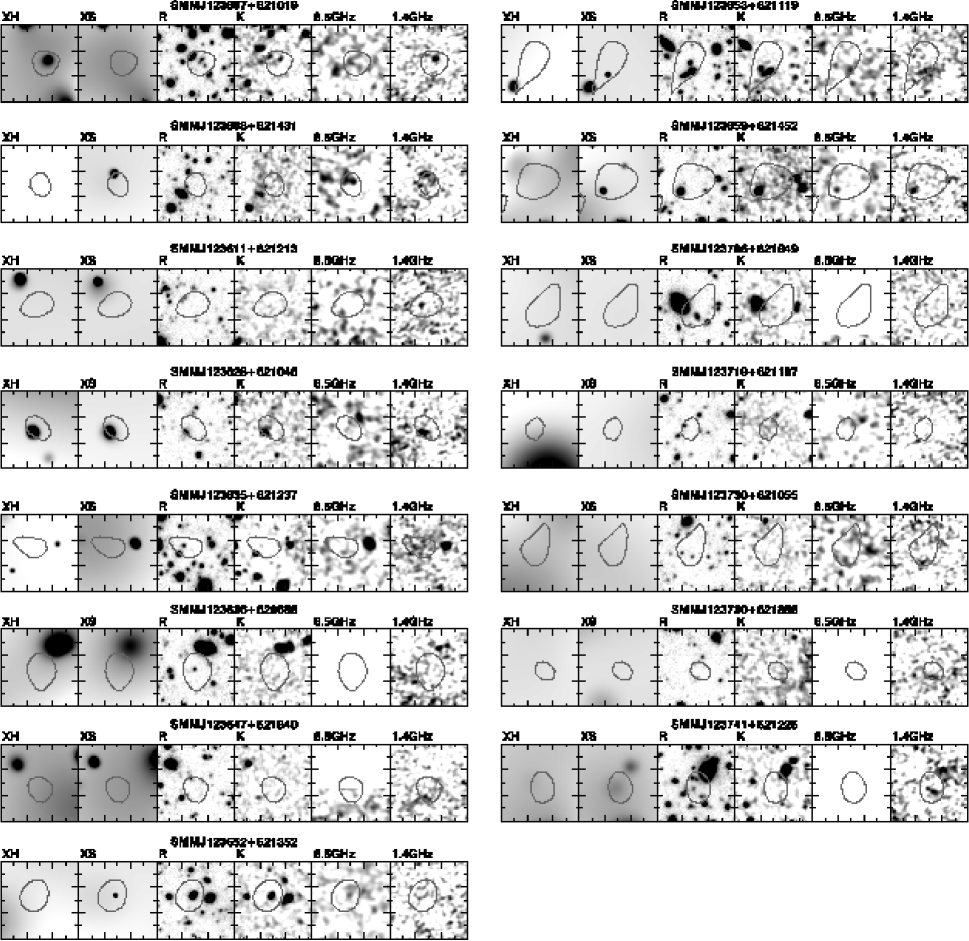
A.2 850m sources from the supplementary catalogue
In this sub-section we describe the 15 objects in the supplementary HDF-N SCUBA catalogue of sources detected with a SNR between and . The postage stamps are shown in Fig. 8.
SMMJ123607+621019 [S]: A Chandra detected radio galaxy seems the obvious ID, although the radio/sub-mm flux density ratio is too low for the redshift of 0.47 (determined from optical photometry). The optical emission suggests a disturbed system, and the surrounding area is very dense with galaxies. Indeed, Barger et al. (2002) note that the photometric redshift may be contaminated by flux from neighbouring galaxies.
SMMJ123608+621431 [JS]: The ID is likely to be the X-ray and radio detected object to the North.
SMMJ123611+621213 [S]: The radio map shows a source 4 East of the SCUBA position, but with no optical counterpart. Although deeper observations may confirm this radio identification, for now we conclude that there is no counterpart.
SMMJ123628+621046 [JS]: The very red object that has detections in the optical, radio, and X-ray is the counterpart.
SMMJ123635+621237 [JSP]: This faint sub-mm source is HDF 850.7 in the Serjeant et al. (2003) catalogue. It lies in a complex field, with the most appealing candidate being a red galaxy. This has detections in the radio, mid-IR, and X-ray. Unfortunately this candidate lies 7.6 to the West of the SCUBA centre, but again this may be due to confusion noise. The redshift is compatible with that derived from the CY estimator. Despite the slightly large offset, we will select this as the counterpart.
SMMJ123636+620658 [S]: There is a very bright (presumably foreground) galaxy with radio emission to the North. A fainter source next to it appears distorted (and perhaps redder). From this fainter object there is radio emission and hard X-ray flux. However, this radio source is distant (over 11 away), and sub-mm confusion is not a big issue here, since the source is so bright. We therefore conclude there is no counterpart.
SMMJ123647+621840 [S]: This is also scan-map only (like the previous source), but near the northern edge of the map. It is apparently a blank field to the limit of the observations.
SMMJ123652+621352 [JSP]: 3 moderate redshift ISO objects are within 11, but the SCUBA centre lies on top of non-ISO detected galaxy which also has Chandra and 8.5 GHz detections. This is the only case where we base the radio ID on the 8.5 GHz data and not the 1.4 GHz. Serjeant et al. (2003) note that this source (HDF 850.8) is part of an interacting pair of galaxies.
SMMJ123653+621119 [SP]: There are too many optically detected sources present to choose from. The nearby soft X-ray source does not have any detectable radio flux, but is present in the X-ray study of star-forming galaxies by Nandra et al. (2002). This Balmer-break galaxy has a redshift of 0.89 and an inferred SFR of 30. The small sub-mm flux density is still moderately high for this SFR, and without a radio detection we can only speculate that this is the correct ID.
SMMJ123659+621452 [SP]: 7 to the South-east is a X-ray, 1.4 GHz radio and ISO detected object. 7 to the West lies a 8.5 GHz radio and ISO detected object. This latter object also has a faint 1.4 GHz flux. Both objects have very similar radio and 15m fluxes, and hence both predict a similar redshift when using the 850m fluxes as a photometric redshift indicator.
SMMJ123706+621849 [S]: It is difficult to choose among the 3 (at least) optical sources in the region, especially in the absence of any other multi-wavelength data. Note the extended soft X-ray flux overlapping the 850m contours.
SMMJ123719+621107 [JS]: There are 4 optically detected galaxies within 7 of the SCUBA position, none of which have a radio detection that can be used to help discern if any are the SCUBA counterpart.
SMMJ123730+621055 [S]: No obvious counterpart.
SMMJ123731+621855 [S]: No obvious counterpart.
SMMJ123741+621225 [S]: There is a radio source 7.6 to the North. It overlaps with soft X-ray flux as seen in the Chandra image, although it is not formally listed in the Alexander et al. (2003) Chandra catalogue. The SCUBA contours prefer a very faint galaxy pair which appears to have some radio flux.
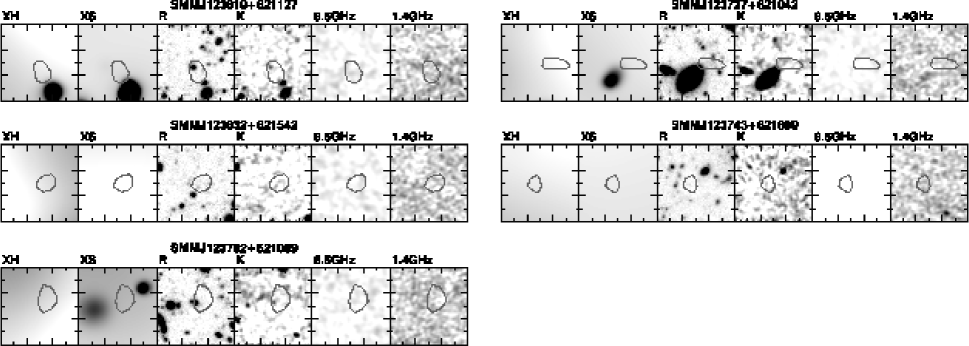
A.3 450m detections
We now describe the 5 objects in the HDF-N SCUBA map that were detected at confidence at 450m. Here we search for counterparts within 4 of the SCUBA centroid. Although the beam-size is smaller at 450m (7.5 ), the search radius still needs to be reasonably large, because of the other systematic effects described in Section 3. It is also worth noting that anything detected at 450m should have been seen at 850m, unless the source has an extremely steep emissivity (). We are much less confident about the reliability of our 450m candidates, but nevertheless present them for completeness (see also Fig. 9).
SMMJ123619+621127 [JS]: Since there is only 1 optically detected galaxy within the search radius, we assign it as the tentative ID.
SMMJ123632+621542 [JS]: No obvious counterpart.
SMMJ123702+621009 [JS]: 2 optical galaxies relatively near to the centroid make it impossible to tell which is the counterpart.
SMMJ123727+621042 [S]: A large elliptical galaxy is nearby, but still too far to have it be the unambiguous ID.
SMMJ123743+621609 [S]: No obvious counterpart.
Appendix B Other interpretations
Using existing and new sub-mm data, Wang, Cowie & Barger (2004) have recently presented another SCUBA map of the HDF-N. They provided a catalog of 17 objects111Wang, Cowie & Barger (2004) label their objects GOODS850-01 through GOODS850-17, while we use the prefix SMMJ combined with the coordinates of the object, as well as several more between . Given the strong interest in the GOODS-N region by many in the community, we briefly discuss the similarities and differences between the different analyses.
B.1 Source catalogues
Ignoring 3 Super-map sources that were found in regions sampled mainly in the scan-map mode, we find that 14 of 16 Super-map sources are recovered in the list provided by Wang, Cowie & Barger (2004). SMMJ123701+621146 (a.k.a. HDF850.6) and SMMJ123702+621301 are not detected in their list because they use less data and are hence less sensitive. A full comparison is presented in Table 6.
| ID | S850 (mJy) | ||||
|---|---|---|---|---|---|
| B03 | W04 | ( ) | B03 | W04 | |
| J123607+621143 | 31 | 18 | a | ||
| J123608+621249 | 40 | 10 | a | ||
| J123616+621516 | 07 | 4 | |||
| J123618+621007 | 24 | 4 | |||
| J123618+621552 | 03 | 1 | |||
| J123621+621252 | 14 | 26 | a | ||
| J123621+621710 | 15 | 2 | |||
| J123622+621616 | 02 | 5 | |||
| J123634+621407 | 05 | 6 | |||
| J123637+621155 | 04 | 13 | |||
| J123645+621449 | 11 | 1 | |||
| J123650+621316 | 10 | 5 | |||
| J123652+621225 | 01 | 1 | |||
| J123656+621201 | 12 | 0 | |||
| J123700+620910 | 16 | 5 | |||
| J123707+621410 | 09 | 7 | |||
| J123713+621204 | 13 | 2 | |||
a Scan-map sources
Of their 17 objects, 14 are already detected in our catalogue. Of the missing 3, GOODS850-06 is in a region where the Super-map has low sensitivity (which they supplemented with deeper jiggle-maps), another (GOODS850-17) is detected in our catalogue at just under , and the final object (GOODS850-08) is in a suspicious region that we address shortly. It is encouraging that separate groups can reproduce similar sources using different techniques. We do note that the correlation between sources detected under is much weaker, but one would expect this given the poor reliability of low signal-to-noise sources.
B.2 Jiggle-map ‘noise-spike’
The only significant differences seem to be around SMMJ123607+621143 and SMMJ123608+62124, which were first detected in the scan-map of Borys et al. (2002). Wang, Cowie & Barger (2004) claim scan-map data are suspect since they fail to recover them in new jiggle-map data. Their source catalogue contains three objects between , two more between , and one within a SCUBA array size centered on these sources. This is an unusually large number for a typical ‘blank field’ SCUBA observation222The number counts at this flux level suggest there should be at most two sources in an area the size of the SCUBA array., and none of them have a plausible radio counterpart, nor are coincident with any of the scan-map sources.
We believe some of the discrepancy arises due to the ‘noise-spike’ issue discovered by one of us (Borys) in jiggle-map observations taken around the same time333Semesters 02B and 03A seem particularly affected, the problem was noted in other semesters to varying degrees as well. (see Fig. 10). This instrumental fault has manifested itself in the map published in Webb & Sawicki (2004), as well as in data from the SHADES survey (J. Dunlop, private communication). Roughly of the array is affected (24 bolometers) by noise that is scan-synchronous; i.e. the noise-spike occurs at the same frequency as the dither pattern cycle that makes up the jiggle-map. Therefore the noise is projected into discrete places on the sky, and does not integrate down as . Though it is known that the problem affects source fluxes and increases the number false positives, there is currently no proven algorithm which removes this. Wang, Cowie & Barger (2004) note their data are affected by this issue and removed a small number of especially noisy bolometers. Our own research has shown that this may not be sufficient, since during the sky subtraction phase of the data reduction, the bolometers affected by the noise corrupt the bolometers which are not. Fixes are being developed by our own group, the SHADES team (A. Mortier private communication), and T. Webb (private communication). IDL based code to identify the data affected by this issue is available from the author by request.

Still, it useful to check to see how consistent scan-map and jiggle-map data are. As described in Paper I, we cross-correlated the jiggle and scan-maps in order to check the relative calibration and pointing offsets (none of the ‘corrupt’ jiggle-map data was used). Fig. 11 verifies that the two maps are sensitive to the same sources. Given the success in using the scan-map mode for other projects (e.g. Johnstone et al., 2000), there is no a priori reason to suspect that the scan-map technique is not viable. It is likely that a resolution between the recent results in Wang, Cowie & Barger (2004) and our Super-map will require new observations from a well characterised and healthy sub-mm instrument. Nevertheless, we stress that aside from this one region, the final source catalogues in Wang, Cowie & Barger (2004). and Paper I are very consistent.

B.3 Multi-wavelength identifications
Regarding the multi-wavelength IDs, Wang, Cowie & Barger (2004) find a similar radio association rate. Though by including HDF850.1 (SMMJ123652+621225) and SMMJ123622+621616 (which is uncomfortably far away from the nearest radio source), they have estimated a higher radio-ID fraction than we found with our more rigorous identification recipe. However, the most significant difference between the multi-wavelength IDs is that Wang, Cowie & Barger (2004) use X-ray or ISO detected objects that have no radio counterpart to tag some SCUBA objects. As we have demonstrated in this paper, unless there is a believable radio source as the counterpart, we find no convincing evidence that an association can be made with another wavelength.