Abstract
At the earliest evolutionary stages, massive star-forming regions are deeply embedded within their natal cores and not observable at optical and near-infrared wavelengths. Interferometric high-spatial resolution mm dust continuum observations of one very young high-mass star-forming region disentangle its cluster-like nature already at the very beginning of the star formation process. The derived protocluster mass function is consistent with the stellar IMF. Hence, fragmentation of the initial massive cores may determine the IMF and the masses of the final stars. This implies that stars of all masses can form via accretion, and coalescence of protostars appears not to be necessary.
Fragmentation of a high-mass star-forming core
Fragmentation in massive star formation
Introduction
One mystery in star formation is at
what evolutionary stage in the cluster formation process the shape of
the IMF gets established. For low-mass clusters, [Motte et al. (1998)] have
shown that the protocluster mass function of Ophiuchus
resembles already the final IMF, but so far no comparable study exist
for very young high-mass star-forming regions. Additionally, I like to
address how far studying the earliest fragmentation processes of
massive star-forming regions helps to differentiate between the two
proposed scenarios for massive star formation: accretion versus
coalescence (e.g., [McKee & Tan 2002, Bonnell et al. 1998]). Employing the
Plateau de Bure Interferometer (PdBI), we studied the dust continuum
emission at 1.3 and 3 mm toward the massive star-forming region
IRAS 19410+2336. This region of L⊙ at a distance of
kpc is at an early evolutionary stage prior to forming a hot
core. The results of this study have recently been reported by
[Beuther & Schilke (2004)].
Results
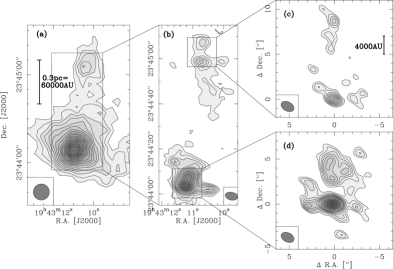
The large scale continuum emission observed
at 1.2 mm with the IRAM 30 m telescope (Fig. 1a) shows two
massive gas cores. Based on the intensity profiles, we predicted that
the cores should split up into sub-structures at scales between
and ([Beuther et al. 2002a]). The PdBI 3 mm data at more than
twice the spatial resolution show that both sources split up into
sub-structures at the predicted scales, about four sources in the
southern core and four in the northern core (Fig. 1b). At
the highest spatial resolution (Figs. 1c & d), we observe
that the gas clumps resolve into even more sub-sources. We find small
clusters of gas and dust condensations with 12 sources per
protocluster over the limit of 9 mJy/beam. Both
protoclusters are dominated by one central massive source and
surrounded by a cluster of less massive sources. This provides
evidence for the fragmentation of a high-mass protocluster down to
scales of 2000 AU at the earliest evolutionary stages.
Assuming the mm continuum flux to be due to optically thin thermal dust emission, one can calculate the masses following the method outlined in [Hildebrand (1983)]. Based on IRAS far-infrared observations we estimate the average dust temperature to be around 46 K ([Sridharan et al. 2002]), the dust opacity index is set to 2 ([Beuther et al. 2002a]). At the given temperature, the 9 mJy/beam sensitivity corresponds to a mass sensitivity limit of 1.7 M⊙. The range of clump masses is 1.7 to 25 M⊙. Combining the data from both clusters, we can derive a protocluster mass spectrum , with the number of clumps per mass bin (Fig. 2). The best fit to the data results in a mass spectrum with the power law index and a mean deviation .
![[Uncaptioned image]](/html/astro-ph/0408374/assets/x2.png)
Fig. 2: The mass spectrum of IRAS 19410+2336. The clump-mass bins are [1.7(),4], [4,6], [6,8], [8,10] and [10,25] M⊙. The best fit to the data is , the dashed and dotted lines show the IMFs derived from Salpeter (1955) with and Kroupa et al. (1993) with , respectively.
Caveats: One uncertainty is the assumption of a uniform dust
temperature because higher temperatures for the massive clumps would
decrease their masses whereas lower temperatures for the less massive
clumps would increase those. These effects could result in a somewhat
flattened slope . However, the protocluster is at an early
evolutionary stage prior to forming a significant hot core, and the
temperature variations in the protocluster should still be
small. Hence, it is plausible to assume a similar dust temperature for
all sub-sources, and the relative accuracy between the clumps
masses – and thus the slope of the mass spectrum – is high. An
additional caveat is that we are dealing with low-number statistics
and just five mass bins. Only future more sensitive observations of a
statistical significant number of massive protoclusters will allow to
handle the statistics better. In contrast to this, we do not believe
that the spatial filtering properties of the interferometer affect our
results because the size of all clumps is far smaller than the spatial
structures filtered out (of sizes ). Consequently, only a
large-scale halo common to all sources is affected by the filtering,
whereas the sources we are interested in are not. Another uncertainty
is whether all mm continuum emission is really due to protostellar
condensations, because [Gueth et al. (2003)] have shown that such emission
can also be caused by molecular outflows. Since at least seven
outflows are observed toward IRAS 19410+2336 ([Beuther et al. 2003]),
one or the other emission feature could be due an outflow as
well. However, outflow associated emission features are expected to be
rather weak. As a consistency check, we increased the lower mass limit
slightly including less clumps in the power spectrum. The resulting
values of the power-law index varied only within the error
margins. Therefore, we conclude that possible outflow contributions should
not alter the derived slope significantly.
Discussion
The derived power-law spectrum can be
compared with the IMFs of more evolved clusters. Although open issues
remain, this conference has confirmed the general consensus that the
IMF for stars M⊙ can be approximated by
(e.g.,
[Pudritz 2002, Salpeter 1955, Miller & Scalo 1979, Scalo 1998, Kroupa et al. 1993]). Furthermore,
[Motte et al. (1998)] have shown that a similar slope is found between 0.5
and 3 M⊙ toward the young low-mass protocluster
Ophiuchus. While the observations of Ophiuchus already
suggested that the IMF of low-mass stars is determined at early
evolutionary stages, this was not obvious for more massive clusters
because competitive accretion and merging of intermediate-mass
protostars could establish the IMF at later stages as well (e.g.,
[Bonnell et al. 2004]). The new data now indicate that the upper end of
the IMF is also determined at the earliest evolutionary stages. This
supports the disk-accretion scenario for stars of all masses. However,
the observations do not rule out that coalescence might occur within
the dense centers of individual sub-ores.
References
- [Adams & Shu 1985] Adams, F. C. & Shu, F. H. 1985, ApJ, 296, 655
- [Beuther & Schilke (2004)] Beuther, H. & Schilke, P. 2004, Science, 303, 1167
- [Beuther et al. 2002a] Beuther, H., Schilke, P., Menten, K. M., et al. 2002a, ApJ, 566, 945
- [Beuther et al. 2003] Beuther, H., Schilke, P., & Stanke, T. 2003, A&A, 408, 601
- [Beuther et al. 2002b] Beuther, H., Walsh, A., Schilke, P., et al. 2002b, A&A, 390, 289
- [Bonnell et al. 1998] Bonnell, I. A., Bate, M. R., & Zinnecker, H. 1998, MNRAS, 298, 93
- [Bonnell et al. 2004] Bonnell, I. A., Vine, S. G., & Bate, M. R. 2004, MNRAS, 349, 735
- [Gueth et al. (2003)] Gueth, F., Bachiller, R., & Tafalla, M. 2003, A&A, 401, L5
- [Hildebrand (1983)] Hildebrand, R. H. 1983, QJRAS, 24, 267
- [Kroupa et al. 1993] Kroupa, P., Tout, C. A., & Gilmore, G. 1993, MNRAS, 262, 545
- [McKee & Tan 2002] McKee, C. F. & Tan, J. C. 2002, Nature, 416, 59
- [Miller & Scalo 1979] Miller, G. E. & Scalo, J. M. 1979, ApJS, 41, 513
- [Motte et al. (1998)] Motte, F., Andre, P., & Neri, R. 1998, A&A, 336, 150
- [Pudritz 2002] Pudritz, R. E. 2002, Science, 295, 68
- [Salpeter 1955] Salpeter, E. E. 1955, ApJ, 121, 161
- [Scalo 1998] Scalo, J. 1998, in ASP Conf. Ser. 142: The Stellar Initial Mass Function
- [Sridharan et al. 2002] Sridharan, T. K., Beuther, H., Schilke, P., et al., 2002, ApJ, 566, 931