Search for Small-Scale Anisotropy of Cosmic Rays above eV with HiRes Stereo
Abstract
We present the results of a search for small-scale anisotropy in the distribution of arrival directions of cosmic rays above eV measured in stereo by the High Resolution Fly’s Eye (HiRes) experiment. Performing an autocorrelation scan in energy and angular separation, we find that the strongest correlation signal in the HiRes stereo data set recorded between December 1999 and January 2004 is consistent with the null hypothesis of isotropically distributed arrival directions. These results are compared to previous claims of significant small-scale clustering in the AGASA data set.
1 Introduction
Among the most striking astrophysical phenomena today is the existence of cosmic ray particles with energies in excess of eV. While their presence has been confirmed by a number of experiments, it is not clear where and how these particles are accelerated to these energies and how they travel astronomical distances without substantial energy loss.
At energies above several eV, cosmic ray particles are believed to be of extragalactic origin. If charged cosmic ray particles do not suffer considerable deflections in Galactic and extragalactic magnetic fields, one can hope to identify the sources and understand the underlying acceleration mechanism by a detailed study of their arrival directions. The strength and orientation of these fields is poorly known and estimates vary [1, 2], but their impact should decrease at the largest energies; here, cosmic ray astronomy might be possible.
The small cosmic ray data set has been subjected to extensive searches for an autocorrelation signal, i.e. clustering of arrival directions on small angular scales, and there have been a variety of attempts to correlate catalogs of known astrophysical sources with cosmic ray arrival directions.
So far, all efforts to identify the sources from the sparsely populated skymap have not produced statistically convincing evidence for autocorrelation or correlations with any class of objects. “Statistically convincing” should be emphasized here, as there is actually no shortage of claims for both clustering and correlation with catalogs. Small-scale clustering of ultrahigh energy cosmic rays above eV has, for example, been repeatedly reported [3, 4, 5, 6, 7], with analyses mainly based on arrival directions recorded with the Akeno Giant Air Shower Array (AGASA) in Japan. If correct, these results could indicate that cosmic rays originate in nearby, compact sources.

However, there is considerable disagreement over the statistical significance of this clustering signal. The problem arises from the way the chance probability of the signal is evaluated. Quite often, the data set used to formulate the correlation hypothesis is also used for evaluating its significance. Problems with published claims of significant small-scale clustering have been pointed out by various authors [8, 9, 10], and it has become clear that ultimately, only statistically independent data sets will allow a rigorous test of these claims.
Such a data set has recently become available. The High Resolution Fly’s Eye (HiRes) experiment in Utah has operated in stereo mode since December 1999. The operation of HiRes stereo and AGASA overlaps only a few months in time, but both detectors are located in the northern hemisphere and probe approximately the same part of the northern sky. The HiRes stereo data set therefore provides an opportunity to independently test previous claims that the arrival direction of ultrahigh energy cosmic rays shows statistically significant small-scale clustering.
2 HiRes Stereo


HiRes is an air fluorescence experiment with two sites (HiRes 1 and 2) at the US Army Dugway Proving Ground in the Utah desert ( W longitude, N latitude, vertical atmospheric depth ). The two sites are separated by a distance of 12.6 km. A general description of the HiRes detector is given in [11].
Air fluorescence detectors observe air showers from the fluorescence light emitted by air molecules excited by particles in the shower. Tracks of air showers developing in the atmosphere are directly viewed by photomultiplier cameras that continuously watch the night sky.
With showers detected out to distances of about 60 km, the instantaneous aperture of an air fluorescence telescope is quite large. However, the operating conditions of such an instrument – dark, moonless nights with a clear atmosphere – restrict its duty cycle to about . Moreover, the sidereal time distribution (Fig. 1) is modulated by overall seasonal variations as a result of the extended observation time during the winter months.
In monocular reconstruction, the so-called shower detector plane, which is the plane that contains the shower track and the detector, is very well-defined, whereas the location of the shower within that plane has to be reconstructed from the trigger times of individual phototubes along the shower track. This leads to fairly large errors, of order several degrees, on the angle describing the shower in the plane. The ambiguity is resolved if the shower is seen by two detectors. Stereo data has the distinct advantage that error bars on the arrival direction are fairly symmetric for most azimuth angles. A global -minimization using all available information, including the tube trigger times, gives an angular resolution which is typically about half a degree.
The angular resolution of HiRes is determined using simulated showers. We use a full detector simulation of proton showers generated with CORSIKA 6 [12] using QGSJET for the first interaction. The showers are thrown isotropically and undergo a full detector simulation and event reconstruction including all cuts that are applied to the real data [13]. As shown in Fig. 2, 68 % of all showers generated at eV are reconstructed within less than of the true shower direction. The angular resolution depends weakly on energy; the 68 % error radius grows to and for showers generated at eV and eV, respectively, because at higher energies, showers are on average farther away.
Fig. 3 shows the angular distance between true and reconstructed shower direction for a large number of showers with energy eV as a function of zenith and azimuth angle of the arrival direction. The angular resolution is essentially constant in zenith and azimuth angle, varying by less than for zenith angles less than . There is a small range of azimuthal angles where the angular reconstruction is notably worse: for azimuth angles where the shower and the two sites are in the same plane, the stereo reconstruction looses its advantage and is essentially reduced to a monocular reconstruction. Showers having poor angular resolution as a result of this ambiguity fail the quality cuts.
The major systematic errors on the arrival directions are due to uncertainties in the mirror pointing directions. Reconstruction of laser tracks and observation of UV bright stars in the field of view of the cameras [14] indicate that this error is not larger than .
No explicit weather cut is applied for this data set. Simulations show that as long as weather conditions are known, their impact on the determination of the shower geometry is minimal. The reconstruction uses an hourly atmospheric data base built from reconstructed laser shots. Note that stereo data provides us with a consistency check regarding the weather corrections applied to the data. If the distance of the shower to the two detectors is notably different, any inaccurate correction for light scattering and absorption will result in a mismatch of energy estimates for the two sites.
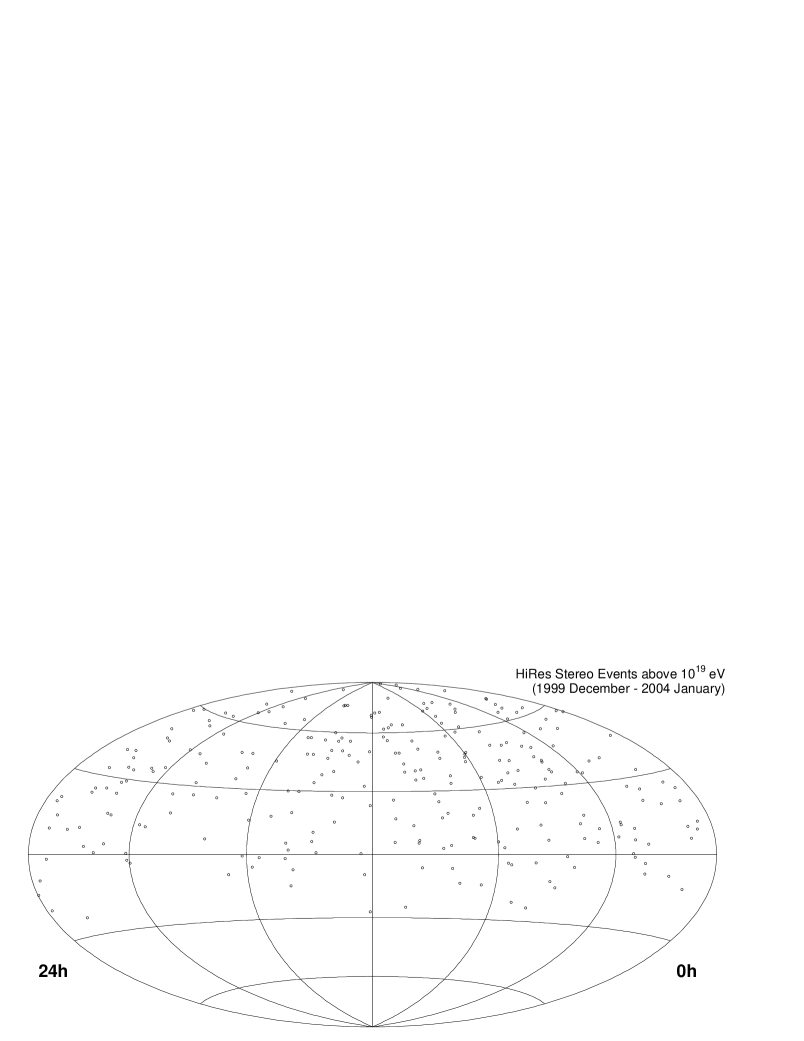
After quality cuts [13], the stereo data set used in this analysis comprises 271 events above eV recorded between December 1999 and January 2004. Fig. 4 shows a skymap of their arrival directions in equatorial coordinates.
3 Small-Scale Clustering
As described in [13], we search for small-scale clustering by performing an autocorrelation scan in energy and angular separation. For a given energy , we count the number of pairs separated by less than . We then use sets of simulated showers with the same number of events as the HiRes stereo data set, but with an isotropic distribution of arrival directions, to estimate the chance probability of finding or more pairs in a random data set just by chance. We identify the energy threshold and the angular distance which gives the smallest chance probability, . This is the most promising potential clustering signal, and its statistical significance can be determined by performing the same scan over data sets with isotropic arrival directions, finding the minimum probability for each of these sets, and counting the number of data sets for which . Simulations show [13] that despite the statistical penalty incurred by scanning, this procedure results in a final chance probability of about () for as few as 3 (4) clusters in 47 events, assuming that cosmic rays are not subject to strong deflections in magnetic fields.
For the HiRes stereo data set, we perform this scan over the 271 events with energies above eV. We scan from to in steps of in angular separation. The energy threshold is lowered one event at a time, starting at the highest energy event and decrementing to eV.
For the HiRes stereo data set, the strongest potential signal is found at eV and . The chance probability for this potential signal is , but the final chance probability after accounting for the scan is . The signal is therefore not significant, and we conclude that the HiRes stereo data above eV is consistent with the null hypothesis of isotropic arrival directions. As a consequence of our approach, we find that this conclusion is indeed very general. There is no evidence for significant clustering for any energy threshold above eV on all angular scales of or less. This indicates that clustering of arrival directions is weaker than previously suggested and might not be a general feature of ultrahigh energy cosmic rays after all.
4 Comparison to the AGASA Data Set
The HiRes stereo data set is still smaller than the published AGASA data set. In the energy range of interest, above eV, it has significantly less statistical power than the AGASA data set, but the difference in the number of events stems largely from a difference in observed flux rather than from a large difference in exposure. The discrepancy in flux is larger than the statistical errors of the experiments, and the possibility of a systematic energy shift of order as studied in [15] implies that by using the same energy threshold for both experiments, we are not comparing equivalent data sets. Our scan over energies is partly motivated by this energy discrepancy. If the HiRes counterpart to the AGASA energy threshold is somewhat lower than eV, then the scan at least ensures that we have tested for small-scale clustering in a HiRes data set equivalent in energy threshold to the published AGASA set.
In order to evaluate the sensitivity of the current HiRes stereo data set to ultrahigh energy cosmic ray point sources, we can set upper flux limits on sky locations which might harbor sources. The flux limits will be a function of the equatorial coordinates of any potential source, since the detector exposure is not uniform. As an example, we determine upper flux limits for proton sources of constant intensity at the locations of the AGASA multiplets.
To do this we track the “source” on its path over the (local) sky for every day of data taking between December 1999 and January 2004, and simulate a constant rate of events with a differential energy spectrum from these positions using the correct zenith and azimuth angles. We use an hourly database of running times, weather conditions, and detector parameters to generate events. After reconstruction, the quality cuts applied to the real data are also applied to the simulated events. We determine the number of events reconstructed within of the “source” direction and compare this number to the generated flux to calculate a upper flux limit using [16]. Table 1 shows the result for the positions of the 5 AGASA multiplets above eV.
| equatorial coord. | |||
|---|---|---|---|
| Cluster | |||
| 1 | 18.6 | 20.6 | 0.023 |
| 2 | 169.7 | 56.9 | 0.016 |
| 3 | 283.0 | 48.1 | 0.026 |
| 4 | 63.9 | 30.0 | 0.021 |
| 6 | 213.1 | 37.4 | 0.021 |
AGASA cluster numbers according to ref. [4].
For AGASA, we calculate a flux from the locations of the clusters by using the exposure published for the data set until May 2000. For each of the doublets (clusters 1, 3, 4, and 6 in Table 1), the flux is about , while for the triplet (cluster 2 in Table 1), the flux is . The HiRes stereo flux upper limits can at this point not rule out the flux estimated from the AGASA clusters. Nevertheless, for some regions of the sky, the HiRes stereo exposure comes to within about of the exposure of the published AGASA data set.
5 The AGASA Clustering Signal
To understand the extent of the inconsistency between the HiRes result and AGASA’s claim that ultrahigh energy cosmic ray arrival directions exhibit significant small-scale clustering, we must better understand the AGASA clustering signal itself. An unbiased test of the clustering hypothesis is only possible if the data set used for formulating the hypothesis is not also used for evaluating the significance. Crucial parameters defining this signal, i.e. the energy threshold eV and the maximum angular distance between cluster events of , were first described by the AGASA collaboration in [3]. Based on data recorded through October 1995, these cuts are justified a posteriori as cuts that lead to a significant clustering signal. Consequently, the strength of this signal should be evaluated using only data recorded since then. This split in “original” and “new” data was introduced in [10], and the chance probability of the clustering signal in the new data set based on the cuts defined by the original set was found to be . If one allows for cross-correlations with the original set while replacing its clusters by single events at their averaged position, the statistical power of the new set can be increased, but the chance probability for clustering in the new set is still , implying that the clustering signal in the “new” set is consistent with the null hypothesis.
One can take this independent test one step further. With 27 events, the new data set is slightly smaller than the original data set with 30 events. If we extend the new data set by including the data taken since May 2000, summarized in a skymap on the AGASA web page [17], the original claim can now be tested with a larger data set comprising 42 events. The chance probability for the clustering observed in the enlarged new set is , so the larger data set fails to confirm the clustering hypothesis formulated using the original data set.
These tests show that the persistent claims that the clustering signal has chance probabilities as low as [5] are a direct consequence of the bias carried over from the original data set if the pre- and post-October 1995 data are not clearly separated.
With evidence of small-scale clustering in the AGASA data set being weak to insignificant, our result is therefore consistent with AGASA’s. It appears that at present, both data sets show no clustering signal.
HiRes is currently the only cosmic ray detector probing the northern sky. The statistical power of the HiRes data set is increasing, and the important topic of small-scale anisotropies in the arrival directions of cosmic rays at the highest energies will be revisited once more data becomes available.
We thank the organizers of CRIS2004 for an exciting conference and for their hospitality. The HiRes project is supported by the National Science Foundation under contract numbers NSF-PHY-9321949, NSF-PHY-9322298, NSF-PHY-9974537, NSF-PHY-0098826, NSF-PHY-0245428, by the Department of Energy Grant FG03-92ER40732, and by the Australian Research Council. The cooperation of Colonels E. Fisher and G. Harter, the US Army and Dugway Proving Ground staff is appreciated. We thank the authors of CORSIKA for providing us with the simulation code.
References
- [1] G. Sigl, F. Miniati, and T. Ensslin, Phys. Rev. D 68 (2003) 044008.
- [2] K. Dolag, D. Grasso, V. Springel, and I.I. Tkachev, JETP Lett. 79 (2004) 583.
- [3] N. Hayashida et al., Phys. Rev. Lett.77 (1996) 1000.
- [4] M. Takeda et al., Astrophys. J. 522 (1999) 225.
- [5] M. Takeda et al., Proc. 27th ICRC, Hamburg, Germany (2001) 345.
- [6] P.G. Tinyakov and I.I. Tkachev, JETP Lett. 74 (2001) 1.
- [7] M. Teshima et al., Proc. 28th ICRC, Tsukuba, Japan (2003) 437.
- [8] A.A. Watson, Proc. XIII Rencontres de Blois (2001), also arXiv: astro-ph/0112474.
- [9] N.W. Evans, F. Ferrer, and S. Sarkar, Phys. Rev. D 67 (2003) 103005.
- [10] C.B. Finley and S. Westerhoff, Astroparticle Phys. 21 (2004) 359.
- [11] G.B. Thomson et al., these proceedings.
- [12] D. Heck et al., CORSIKA: A Monte Carlo Code to Simulate Extensive Air Showers, Forschungszentrum Karlsruhe, Wissenschaftliche Berichte FZKA 6019 (1998).
- [13] R.U. Abbasi et al. (HiRes Collaboration), Astrophys. J. 610 (2004) L73.
- [14] P.A. Sadowski et al. (HiRes Collaboration), Astroparticle Phys. 18 (2002) 237.
- [15] D. De Marco, P. Blasi, and A.V. Olinto, Astroparticle Phys. 20 (2003) 53.
- [16] O. Helene, Nucl. Instr. Meth. 212 (1983) 319.
- [17] http://www-akeno.icrr.u-tokyo.ac.jp/AGASA/results.html.