Dwarf Novae with Newly Determined Parallaxes: Model Analyses of VY Aquari, RU Pegasi, and T Leonis
Abstract
Using newly determined parallaxes for dwarf novae, we have derived outburst accretion rates for VY Aqr, RU Peg and T Leo and for T Leo during quiescence. The two short-period dwarf novae, VY Aqr and T Leo, show good agreement with optically thick steady-state accretion disks in outburst, whereas RU Peg shows a significant departure from a steady-state disk. We have determined that the white dwarf in T Leo has T K, a value consistent with long term compressional heating when gravitational wave emission drives mass transfer. The white dwarf in T Leo has a temperature in the same narrow range as other WZ Sge-like dwarf novae.
1 Introduction
Distances from accurate parallaxes for cataclysmic variables are critically important to model-fitting determinations of the mass accretion rates, accreting white dwarf temperatures, and the identification of the source of far UV (FUV) continuum during quiescence and outburst states. Recently, Thorstensen (2003) and Harrison et al. (2004) have presented new parallaxes for dwarf novae from ground-based and Hubble Fine Guidance Sensor (FGS) determinations respectively. These parallaxes offer the opportunity to more accurately analyze the IUE archival spectra of dwarf novae during outburst and quiescence. By knowing the distance, model-derived accretion rates and white dwarf properties are known more reliably. Only with good distances can it be known what fraction of the FUV flux is being contributed by what radiating component, be it the white dwarf, the boundary layer or the accretion disk. We have selected three dwarf novae systems with recently measured parallaxes: VY Aquari, an SU UMa system below the period gap; RU Peg, a U Gem system above the period gap; and T Leo, an SU UMa system below the period gap. A summary of these systems and their associated properties can be found in Table 1.
2 The IUE Archival Observations
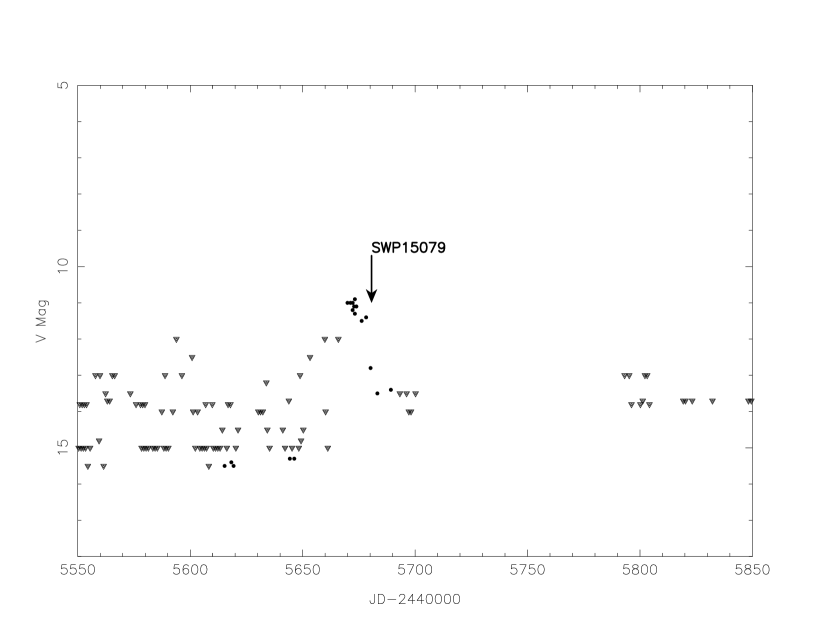
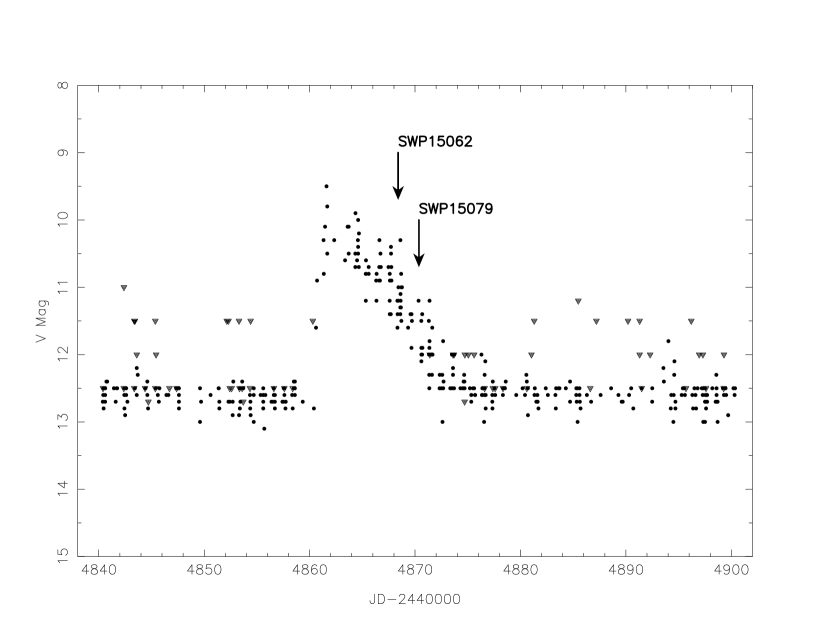
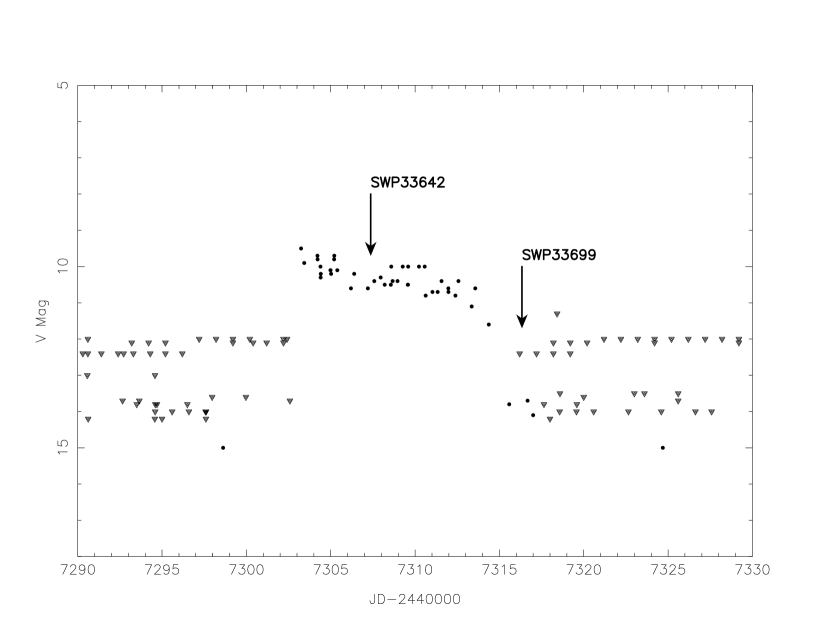
All three systems were observed with IUE and have usable spectra taken with the Short Wavelength Prime (SWP) camera covering the wavelength region from 1170 - 2000 Å. We obtained the spectra through the MAST IUE archive, and then applied the Massa & Fitzpatrick (2000) flux calibrations to correct the NEWSIPS data. For VY Aquari, a characteristic outburst spectrum, whose time placement is shown in the AFOEV light curve in Figure 1, was chosen for analysis. The quiescent state of VY Aqr has already been analyzed by Sion et al. (2003) using HST STIS spectra. For the analysis of RU Peg, we chose two usable outburst spectra in the MAST IUE archive: one near the peak of outburst (SWP15062), and one occurring on the decline from an outburst (SWP15079) as seen in the AAVSO lightcurve in Figure 2. Quiescent IUE spectra of RU Peg has already been analyzed by Sion & Urban (2002). The IUE spectra of T Leo covers both the outburst and quiescent states, with outburst spectra having been previously analyzed by Belle et al. (1998) and the quiescent spectra available having no previous model analysis. We present a new analysis of T Leo’s outburst spectrum utilizing an updated grid of steady-state accretion disk models and white dwarf photospheres. The time placement of the outburst and quiescent spectra chosen for our analysis of T Leo are shown in the AAVSO lightcurve in Figure 3. The outburst spectrum is seen to occur just after peak outburst, and the quiescent spectrum shown just after the return to optical quiescence.
A summary of the IUE spectra can be found in Table 2. We have listed the system name, SWP image number of the specific observation, date, and exposure length. All were obtained through the large aperture of IUE with the exception of SWP21720 as indicated in the table.
3 Synthetic Spectral Fitting Technique
We pursued three avenues in modeling the observations with synthetic spectra: an accretion disk model alone, a single white dwarf photosphere, or a combination of the two.
For the accretion disks, we adopted models from Wade & Hubeny (1998). Using IUEFIT, a minimization routine, the model disk was scaled and fit to the spectrum. The fitting scale factor can then be shown to be related to the white dwarf distance in pc though where S is the scale factor given by the IUEFIT routine, d is the system distance in pc, and the factor of 100 arises from the fact that the theoretical disk fluxes are normalized to a distance of 100 pc. Using this approach we have two parameters in determining the goodness of a fit: a minimum and a scale-factor distance to compare with the parallax distance.
For single photospheres, we used the codes TLUSTY (Hubeny 1988) in conjunction with SYNSPEC with ROTIN3 (Hubeny & Lanz 1995) to generate synthetic photosphere spectra convolved with the IUE instrumental profile. We generated a new grid of solar abundance models, covering a range of temperatures from 15,000 - 50,000 K in increments of 1000 K with ranging from 7.0 to 8.6 in increments of 0.2. This grid of models was then applied to the observations using IUEFIT. The scale factor S for the photosphere fits is related to the radius of the white dwarf given by , where is the radius of the Sun ( cm), d is the known system distance in pc, and the factor of 1000 arises from the fact that the theoretical photosphere fluxes are normalized to a distance of 1000 pc. This again gives two parameters for determining the goodness of the fit, and the white dwarf radius computed using the parallax distance.
The best fitting accretion disk and photosphere models were also combined in an attempt to achieve a better fit. We used our code DISKFIT, which allows us to vary the accretion rate linearly between 0.1 and 10. This effectively alters the contribution of the disk to the observed flux, giving the underlying white dwarf a greater or lesser flux contribution depending on the ratio. The fitting routine computes a scale factor that is related to the system distance as given by with distance given in pc.
4 Model Fitting Results
4.1 VY Aquari in Outburst
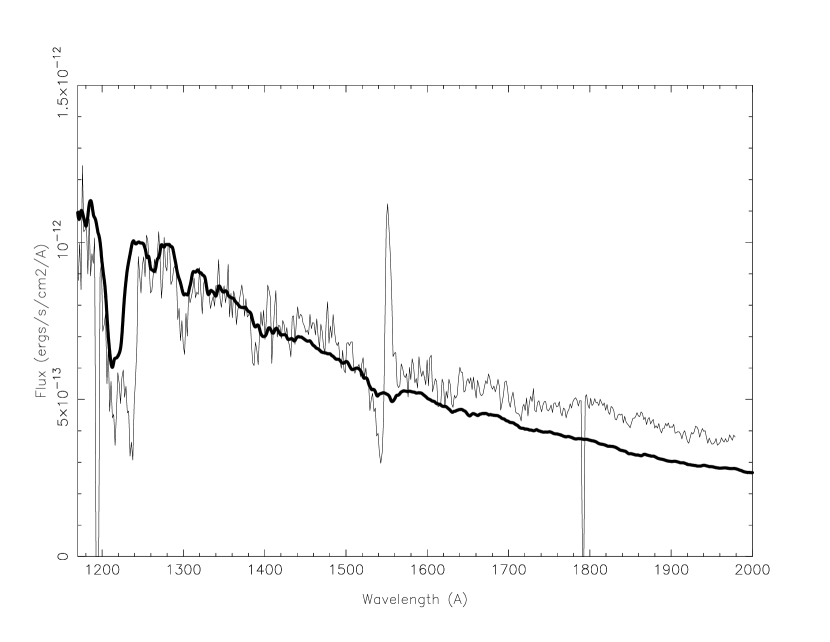
For VY Aquari, the best fitting optically thick steady-state accretion disk model yields an accretion rate of M☉ yr-1. This compares to the prediction of a time averaged accretion rate of approximately M☉ yr-1 for OY Car, an SU UMa system with an orbital period very similar to that of VY Aqr, given by Patterson (1984).
The white dwarf mass and disk inclination used in this best fit (shown in Figure 4) are M☉ and 41° respectively, giving a scale-factor distance of 93 pc. This is in very good agreement with the parallax distance of pc obtained by Thorstensen (2003). Notice that this best fit agrees well with the observations, and does not show any significant deviations from a steady-state disk longward of 1600 Å.
Note that in the case of VY Aqr, no previous mass determinations existed and the inclination was uncertain. In our fitting therefore, we examined the widest range of and the inclination i. Since the goodness-of-fit is sensitive to both and i, it is most helpful to know or constrain one of the two parameters. The fits are based upon both the continuum slope and Lyman Alpha wings. However, an important additional clue was provided by the depth of the Lyman alpha profile before it is reversed by the geocoronal emission. This allowed us to rule out three models having different Mwd giving an acceptable distance and values close to the best-fitting one.
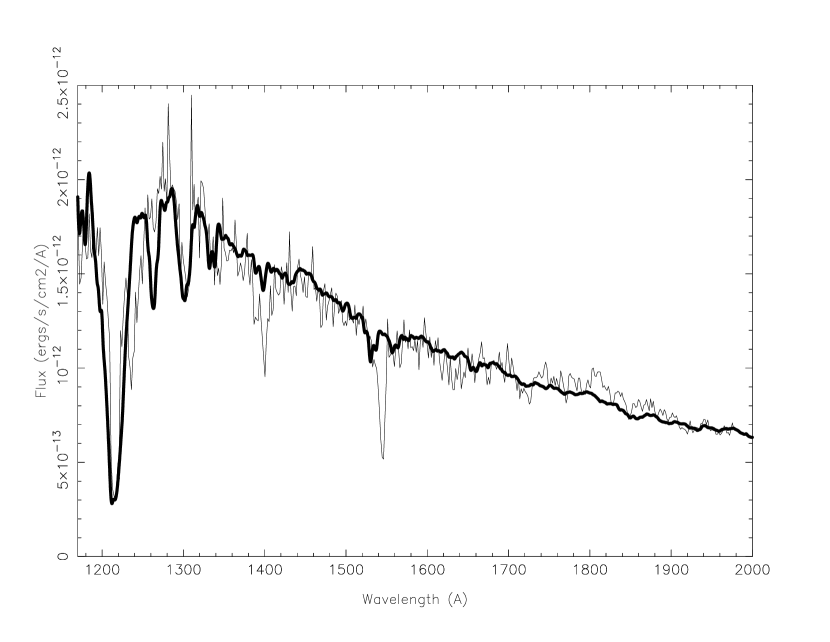
4.2 RU Peg in Outburst
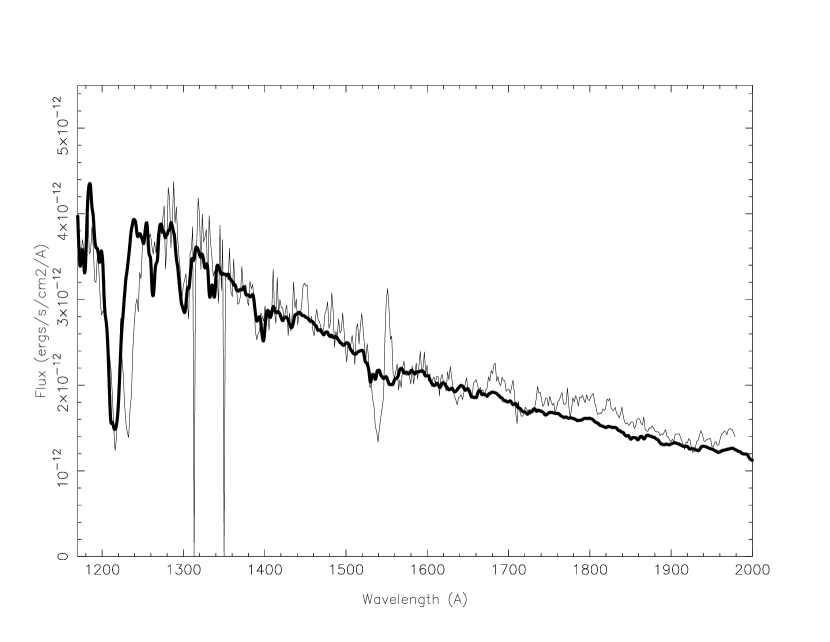
For RU Peg, our best fitting steady-state optically thick disk model yields an accretion rate of M☉ yr-1 with a white dwarf mass of 1.21 M☉ and an inclination of 41° (shown in Figure 5). This accretion rate is within a factor of 10 lower than that of Patterson (1984). The resulting scale factor distance of 278 pc gives excellent agreement with the parallax distance of pc by Harrison et al. (2004). However, there is a significant deviation from a steady-state disk flux distribution in the observed spectrum longward of 1600 Å that could not be accounted for by a single disk, white dwarf photosphere, or combination of the two. The poor agreement between the accretion disk models and the outburst spectrum also occurred for the fitting of the outburst spectrum (SWP15062) obtained two days closer to peak outburst.
4.3 T Leo in Outburst
For T Leo in outburst, we found that the spectrum is best fit by a steady-state optically thick disk with an accretion rate of M☉ yr-1, a white dwarf mass of 0.35 M☉, and an inclination of 60° (shown in Figure 6). The resulting scale factor distance of 113 pc is close to the parallax distance of pc by Thorstensen (2003). It is interesting that the steady-state disk fit to T Leo, like the fit to VY Aqr, shows good agreement with the observations. There is no significant deviation from a steady-state flux distribution as is seen in RU Peg.
4.4 T Leo in Quiescence
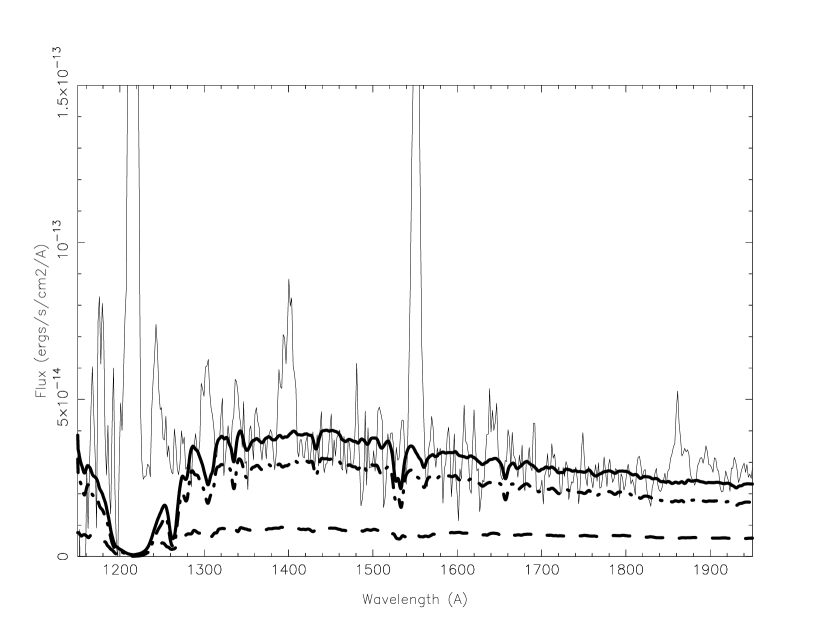
For T Leo in quiescence, we found that the spectrum is not best fit by either a single disk or white dwarf photosphere but by a combination of the two. Using the mass and inclination obtained from the best fit to the outburst spectrum, we found that the quiescent spectrum is best fit by the combination of a white dwarf with Teff of 16,000 K and of 7.5, an accretion disk with a white dwarf mass of 0.35 M☉, an inclination of 60° and a combined accretion rate of M☉ yr-1. We estimate the error in our temperature determination to be 1000 K. This accretion rate is within a factor of 10 of Patterson’s (1984) time averaged rate of M☉ yr-1. The best fit (shown in Figure 7) also gives a scale-factor distance of 101 pc, again in excellent agreement with the parallax distance of pc by Thorstensen (2003). Our finding that the white dwarf dominates the flux in the FUV wavelength range during quiescence is consistent with the fact in the short period, large outburst amplitude long recurrence time dwarf novae such as WZ Sge or AL Com during quiescence, the accretion disk is not expected to be the major contributor to the flux (Szkody et al. 2002).
5 Conclusions
We have derived accretion rates for 3 dwarf novae in outburst, and have provided the first temperature determination of the white dwarf in T Leo derived from the analysis of its quiescent IUE spectrum. For the best accretion disk fits to the outburst spectra of VY Aquari and T Leo, a steady-state optically thick accretion disk represents the observed FUV energy distribution very well with no significant deviations. For RU Peg in outburst, however, there is a large deviation from the observation longward of 1600 Å. This implies an additional radiating component (secondary star or hot spot?) or that the temperature distribution, T(r), in the disk differs from the steady-state T(r).
The relatively low signal-to-noise of the IUE spectra introduces considerable uncertainty in the accretion rates we have derived. By comparison with the comparable quality IUE spectra of EM Cygni and CZ Ori which were analyzed by Winter and Sion (2003) with a formal error analysis, we estimate uncertainties in the accretion rates Log Ṁ of for the three outburst spectra in this paper while for T Leo’s fainter spectrum in quiescence, we estimate a uncertainty in Log Ṁ.
The temperature of the white dwarf in T Leo is consistent with the predicted range of temperature expected from long term compressional heating at a rate of mass transfer driven by gravitational wave emission as shown by Sion et al. (2003) and Townsley and Bildsten (2002). As seen in Table 3, the effective temperature of the T Leo white dwarf agrees with the white dwarf effective temperatures in dwarf novae with similar orbital periods. Recently, Vrielmann et al. (2004) provided evidence from T Leo’s XMM-Newton X-ray light curve that it might contain a magnetic white dwarf and hence be the first superoutbursting intermediate polar (IP). They found a 414s signal which could be due to the rotation of the white dwarf. However, it is also possible this signal could be an ordinary QPO. If T Leo is an IP, our temperature for the white dwarf is one of only three white dwarf temperatures known in intermediate polars.
References
- Augusteijn (1994) Augusteijn, T., 1994, A&A, 292, 481
- Belle et al. (1998) Belle, K., Nguyen, Q., Fabian, D., Sion, E.M., Huang, M., 1998, PASP, 110, 47
- Downes & Shara (1993) Downes, R., & Shara, M., 1993, PASP, 105, 127
- Harrison et al. (2004) Harrison, T., Johnson, J., McArthur, B., Benedict, G., Szkody, P., Howell, S., Gelino, D., 2004, AJ, 127, 460
- Hubeny (1998) Hubeny, I., 1988, Comput. Phys. Commun., 52, 103
- Hubeny & Lanz (1995) Hubeny, I., & Lanz, T., 1995, ApJ, 439, 875
- Massa & Fitzpatrick (2000) Massa, F., & Fitzpatrick, E., 2000, ApJS, 126, 517
- Patterson (1984) Patterson, J., 1984, ApJS, 54, 433
- Ritter & Kolb (2003) Ritter, H., & Kolb, U., 2003, A&A, 404, 301
- Shafter (1984) Shafter, A., 1984, Ph.D. Thesis, UCLA
- Shafter & Szkody (1984) Shafter, A., & Szkody, P., 1984, ApJ, 276, 305
- Sion et al. (2003) Sion, E.M., Szkody, P., Cheng, F., G nsicke, B., Howell, S, 2003, ApJ, 583, 907
- Sion & Urban (2002) Sion, E.M., & Urban, J., 2002, ApJ, 572, 456
- Stover (1981) Stover, R., 1981, ApJ, 249, 673
- Szkody et al. (2002) Szkody, P., Sion, E., G nsicke, B., Howell, S., 2002, ASP Conf. Ser. 261, ed. B. G nsicke, K. Beuermann, & K. Reinsch (San Francisco: ASP), 21
- Thorstensen & Taylor (1997) Thorstensen, J., & Taylor, C., 1997, PASP, 109, 1359
- Thorstensen (2003) Thorstensen, J., 2003, AJ, 126, 3017
- Townsley & Bildsten (2002) Townsley, D., & Bildsten, L., 2002, ASP Conf. Ser. 261, ed. B. G nsicke, K. Beuermann, & K. Reinsch (San Francisco: ASP), 31
- Vrielmann et al. (2004) Vrielmann, S., Ness, J.-U., Schmitt, J.H.M.M. 2004, A&A, 419, 673
- Wade & Hubeny (1998) Wade, R., & Hubeny, I. 1998, ApJ, 509, 350
| System Name | VY Aqr | RU Peg | T Leo |
|---|---|---|---|
| Subtype | SU UMa | U Gem | SU UMa |
| Porb (d) | 0.06309 aafootnotemark: | 0.3746 fffootnotemark: | 0.05882 iifootnotemark: |
| (MAS) | bbfootnotemark: | ggfootnotemark: | bbfootnotemark: |
| Distance (pc) | |||
| (°) | 30 - 40 ccfootnotemark: | 41 ggfootnotemark: | 46 - 84 ddfootnotemark: |
| (M☉) | 0.6 - 1.2 ccfootnotemark: | 1.21 hhfootnotemark: | 0.35 - 0.4 iifootnotemark: |
| (d) ddfootnotemark: | 350 | 76 | 420 |
| Vmax eefootnotemark: | 8.4 | 9.0 | 10.0B |
| Vmin eefootnotemark: | 17.2 | 13.2 | 15.7B |
| Name | IUE Spectrum | Date of Observation | Exposure Length (s) |
|---|---|---|---|
| VY Aqr | SWP21720 (Sm. Aperture) | 12/8/1983 | 1200 |
| RU Peg | SWP15062 | 9/20/1981 | 600 |
| SWP15079 | 9/22/1981 | 840 | |
| T Leo | SWP33642 (Outburst) | 5/25/1988 | 300 |
| SWP33699 (Quiescence) | 6/3/1988 | 2100 |
| System | P (hours) | Twd (K) | Distance (pc) |
|---|---|---|---|
| WZ Sge | 1.30 | 14,800 | 43 |
| AL Com | 1.36 | 16,300 | 845 |
| SW Uma | 1.36 | 14,000 | 159 |
| T Leo | 1.41 | 16,000 | 101 |
| BC Uma | 1.52 | 15,200 | 287 |
References. — Adapted from Szkody et al. 2002
| System | Mwd | i | Distance | ||
|---|---|---|---|---|---|
| (M☉) | (M☉ yr-1) | (°) | (pc) | ||
| VY Aqr (Outburst): | 0.55 | 41 | 93 | ||
| RU Peg (Outburst): | 1.21 | 41 | 278 | ||
| T Leo (Outburst): | 0.35 | 60 | 113 | ||
| WD Teff (K) | Flux Contrib. | Dist. (pc) | |||
| T Leo (Quiescence): | 0.35 | 16,000 | 77% WD | 101 | |
| 23% Disk |