Heavy elements and chemical enrichment in globular clusters††thanks: Based on data collected at the European Southern Observatory with the VLT–UT2, Paranal, Chile (ESO-LP 165.L-0263).
High resolution () and high spectra have been acquired with UVES on the VLT-Kueyen (Paranal Observatory, ESO Chile) for several main sequence turnoff stars ( mag) and subgiants at the base of the Red Giant Branch ( mag) in three globular clusters (NGC 6397, NGC 6752 and 47 Tuc/NGC 104) at different metallicities (respectively ). Spectra for a sample of 25 field halo subdwarves have also been taken with equal resolution, but higher . These data have been used to determine the abundances of several neutron-capture elements in these three clusters: strontium, yttrium, barium and europium. This is the first abundance determination of these heavy elements for such unevolved stars in these three globular clusters. These values, together with the [Ba/Eu] and [Sr/Ba] abundance ratios, have been used to test the self-enrichment scenario. A comparison is done with field halo stars and other well known Galactic globular clusters in which heavy elements have already been measured in the past, at least in bright giants (–12 mag). Our results show clearly that globular clusters have been uniformly enriched by – and –process syntheses, and that most of them seem to follow exactly the same abundance patterns as field halo stars, which discards the “classical” self-enrichment scenario for the origin of metallicities and heavy elements in globular clusters.
Key Words.:
Stars: abundances – Galaxy: globular clusters: 47 Tuc / NGC 104, NGC 6397, NGC 67521 Introduction
Since almost every evolutionary phase of the stellar life can be found in globular clusters, these very old stellar systems are often considered as ideal natural laboratories for testing different theories of stellar evolution. It has therefore always been very interesting to compare globular cluster stars to other stars that can be observed in the Galaxy, such as field halo, bulge or disk stars, and that could present the same kind of chemical history.
Most globular clusters are very homogeneous in the abundances of Fe-peak elements, and we could expect them to show abundance patterns quite similar to those of field stars at the same metallicities. But in the 1970s, several spectroscopic observations of light metals revealed star-to-star inhomogeneities that had not been observed in field stars (Osborn 1971; and later, Norris et al. 1981, who describe a bi-modality in the distribution of CN and CH band strenghts in NGC 6752). The first high-resolution observations of cluster stars in the late ’70s and the following studies of the late ’80s and ’90s showed variations in the abundances of other (light) elements (O, Na, Mg, Al…) in the vast majority of the observed clusters, leading for example to the discovery of the O–Na and Mg–Al anticorrelations, and to the first assumptions on the “primordial” or “evolutionary” origins of these so-called “abundance anomalies” (e.g. see the first reviews of Gratton 1993, and Kraft 1994).
Most of the heavier elements () are produced either by slow or rapid neutron-capture reactions (the so-called – and –processes), where both processes occur in different physical conditions and are thus likely to happen in different astrophysical sites. Basically, it is commonly assumed that the –process elements and a fraction of the light –elements (weak s–process) are probably only produced at the end of life of high-mass stars, while He-burning in low- and intermediate-mass stars is responsible for the production of the other –elements (main s–process). But it seems possible that other sites or at least different processes could also be involved in the production of the heavy elements (Truran et al. 2002; Cowan & Sneden 2004; Travaglio et al. 2004). The first spectroscopic observations of neutron-capture elements in globular clusters at intermediate- and high-resolution were made in the late ’70s, and in the particular case of Cen they showed a large dispersion and an overabundance of the –process elements Sr and Ba (Dickens & Bell 1976; Mallia 1977). In comparison, previous studies of a few individual field stars had shown an underabundance of the barium to iron ratio at (Wallerstein et al. 1963; Spite & Spite 1978). More recent works have established that the barium abundance decreases at low metallicities111We use the usual spectroscopic notations where , and , for two elements A and B. We assume that the term “metallicity” is equivalent to the stellar value., and becomes subsolar at least in field stars with (e.g. Gratton & Sneden 1994; McWilliam 1998; Burris et al. 2000; Fulbright 2002, and references therein).
The systematic comparison of heavy element abundance patterns in globular clusters and in field stars at different metallicities requires high-resolution spectroscopy and high signal-to-noise observations because the transitions of –capture elements are quite hard to detect in cluster stars. In fact, until very recently, the size of the largest available telescopes (3–4 m) did not allow easy spectroscopic observations at high-resolution and with high ratios for stars much fainter than –12 mag. In the case of globular clusters, this means that until now it was almost impossible to work with stars others than bright giants at the top of the cluster’s color-magnitude diagram. And considering that until very recently almost no spectrograph had a large UV-visible wavelength coverage, the spectra of globular cluster stars were most often obtained only for the yellow-red region, where cool giants emit the most, and where most of the transitions necessary to study the different “abundance anomalies” of the light metals can be found. But most of the –capture elements transitions occur in the violet-blue region, where only little flux is available, and which is extremely blended in these cool stars, making such an analysis very difficult (the –capture lines are either too strong, or too blended), so that most of the few measurements of heavy elements abundances that have been made until now in globular clusters were not very reliable and almost always limited to barium and europium, which are the only heavy elements that show a few detectable absorption lines in the red. Precise heavy elements abundances can be obtained from weaker and less blended lines. As globular clusters often present almost every evolutionary phase of the stellar life, this is possible by going deeper in their color-magnitude diagram and searching for scarcely evolved stars (e.g. main-sequence and turnoff stars, subgiants…), which are fainter and hotter than bright giants. This can now be achieved with the recent 8–10 m–class telescopes (VLT, Subaru, Keck…).
Testing the chemical evolution of globular clusters has recently made a step forward with the first high-resolution and high spectroscopic analyses of globular cluster stars in different evolutionary sequences and at different metallicities. The ESO-Large Programme 165.L-0263 (PI: R. G. Gratton) was dedicated to this purpose. Two groups of stars (near the turnoff, and at the base of the RGB, with magnitudes ) were selected in three globular clusters at different metallicities (NGC 6397, NGC 6752 and 47 Tuc, respectively at ). One of the major results concerning the abundance anomalies in globular clusters is that the presence of the O–Na anticorrelation has been established also in scarcely evolved stars (Gratton et al. 2001; Carretta et al. 2004), showing that these “anomalies” are independent of the evolutionary phase. This was confirmed by other groups for other clusters (Ramírez & Cohen 2003, and references therein). These and other results of the recent analyses of scarcely evolved stars in globular clusters are summarized in Gratton (2004).
These recent results have been interpreted in the light of different self-pollution scenarios (Ventura et al. 2001; D’Antona et al. 2002), and an emerging hypothesis is that we are observing a second generation of stars, formed in a very short period (108 yrs) from material processed in previous intermediate-mass stars (the original cluster population, with the same chemical composition as field stars at the same metallicity) during their AGB phase, when the cluster was 108 years old. Such a scenario could explain the abundance anomalies observed in globular clusters, but there are still questions about the mass range of these first cluster stars. Knowing that no (or very little) variations are seen in the abundances of the –capture elements, in particular that no correlations have been found between –capture elements and light metals (Na, Mg…) that show abundance anomalies (Armosky et al. 1994; James et al. 2004), might indicate a restricted mass range of the hypothetical first generation of AGB stars. But up to now no model has been developped for the synthesis of heavy elements in globular clusters, and the models of self-pollution do not explain the origin of the cluster metallicities.
Truran (1988) suggested a test for the self-enrichment scenario, which is one of the scenarios that could explain the metallicities and the abundances of heavy elements in the clusters: if self-enrichment occured in globular clusters, even the most metal-rich clusters would show both high ratios and –process dominated heavy element patterns which characterize massive star ejecta as is seen in the most metal-poor stars. The aim of this paper, which continues the previous work of James et al. (2004, hereafter referred to as Paper I) in the framework of the ESO-LP 165.L-0263, is to determine the ratio of the –process to the –process elements in scarcely evolved stars belonging to globular clusters at different metallicities in order to test the models of self-enrichment, and to possibly give a clue on the problem of the mass range of the first AGBs if a self-pollution scenario is assumed. The UVES high-resolution spectrograph at the VLT–UT2 has therefore been extremely interesting because it allowed the observation of many scarcely evolved stars in several globular clusters with a very large wavelength coverage. These observations permitted the study of the violet-blue region of the spectra, where most of the –capture elements transitions can be found. In this work we present new abundance ratios for several –capture elements (Sr, Y, Ba and Eu) in stars near the turnoff and in early subgiants of our three main programme clusters: 47 Tuc (NGC 104), NGC 6752 and NGC 6397.
2 Observations
| Star ID | @ | @ | |||
|---|---|---|---|---|---|
| 4500 Å | 6500 Å | (K) | (km s-1) | ||
| CD-35 0360 | 123 | 204 | 5048 | 4.53 | 1.00 |
| HD 010607 | 97 | 187 | 5757 | 4.01 | 1.50 |
| HD 029907 | 138 | 189 | 5351 | 4.57 | 1.00 |
| HD 031128 | 158 | 196 | 5970 | 4.45 | 1.00 |
| HD 108177 | 145 | 170 | 6133 | 4.41 | 1.00 |
| HD 116064 | 110 | 184 | 5964 | 4.32 | 1.00 |
| HD 120559 | 135 | 151 | 5383 | 4.57 | 1.00 |
| HD 121004 | 138 | 194 | 5583 | 4.37 | 1.00 |
| HD 126681 | 103 | 208 | 5574 | 4.55 | 1.00 |
| HD 132475 | 134 | 201 | 5541 | 3.79 | 1.27 |
| HD 134169 | 115 | 184 | 5850 | 3.95 | 1.10 |
| HD 134439 | 118 | 179 | 4996 | 4.65 | 1.00 |
| HD 134440 | 103 | 196 | 4714 | 4.61 | 1.00 |
| HD 140283 | 151 | 229 | 5657 | 3.69 | 1.42 |
| HD 145417 | 93 | 174 | 4869 | 4.62 | 1.00 |
| HD 159482 | 128 | 153 | 5713 | 4.35 | 0.96 |
| BD+05 3640 | 83 | 134 | 5023 | 4.61 | 1.00 |
| HD 166913 | 151 | 190 | 6070 | 4.17 | 1.10 |
| HD 181743 | 154 | 165 | 5968 | 4.40 | 1.00 |
| HD 188510 | 147 | 235 | 5503 | 4.55 | 1.00 |
| HD 189558 | 104 | 195 | 5668 | 3.79 | 1.36 |
| HD 193901 | 111 | 183 | 5779 | 4.54 | 1.08 |
| HD 194598 | 132 | 175 | 6023 | 4.31 | 1.26 |
| HD 204155 | 105 | 171 | 5772 | 4.03 | 0.98 |
| HD 205650 | 124 | 156 | 5810 | 4.50 | 1.00 |
| Cluster ID | Type(a) | (K) | (km s-1) | |
|---|---|---|---|---|
| NGC 104 / 47 Tuc | SG | 5134 | 3.65 | 0.90 |
| TO | 5832 | 4.05 | 1.07 | |
| NGC 6752 | SG | 5347 | 3.54 | 1.10 |
| TO | 6226 | 4.28 | 0.70 | |
| NGC 6397 | SG | 5478 | 3.42 | 1.32 |
| TO | 6476 | 4.10 | 1.32 |
(a) SG = subgiants, TO = turnoff stars.

The observations were carried out in several runs at the Kueyen Telescope (VLT–UT2, ESO) with the UVES high-resolution echelle spectrograph between June 2000 and October 2001 in the framework of the ESO Large Programme 165.L-0263 (PI: R. G. Gratton). For NGC 6752 data have been obtained for 9 dwarves around the turnoff (TO) and 9 subgiants at the base of the Red Giant Branch (RGB), and for NGC 6397 spectra have been collected for 5 TO stars and for 3 subgiants (Gratton et al. 2001). Finally, for the cluster 47 Tuc (NGC 104), spectra have been acquired for 3 TO stars and 8 subgiants as reported in Carretta et al. (2004). A sample of 25 field halo stars was selected to compare the abundance patterns relative to our three globular clusters (hereafter “GCs”). A detailed abundance analysis of these field stars can be found in Gratton et al. (2003a, b).
Individual cluster stars are listed in previous publications of this Large Programme (e.g. Gratton et al. 2001; Bonifacio et al. 2002; Carretta et al. 2004; James et al. 2004). Exposure times are typically of about 1–2 hours for the brightest subgiants in the clusters ( mag) and most of the field stars, to about 4–5 hours (split in 3 to 4 exposures) for the faintest TO stars ( mag). The observations have been done with the UVES dichroic beamsplitter #2, which makes it possible to cover a wide spectral range (3500–4700 Å for the blue spectra, and 5700–8700 Å for the red). The slit length was always set at 8. The resolution () is always over 40 000, depending mainly on the slit width which was mostly set at 1 (depending on the seeing). In the blue region near 4500 Å individual ratios range from 15–45 in NGC 6752 and 20–30 in 47 Tuc to 50 in NGC 6397. In the red portion of the spectra (near 6500 Å) values spread from 30–65 in NGC 6752 and 40 in 47 Tuc, to 90–100 in NGC 6397.
The observed field stars are listed in Table 1. Their spectra have been taken using the dichroic beamsplitter #1, and have a resolution of 50 000 and ratios around 200 (see Table 1). All our spectra (GCs and field stars) have been reduced using the UVES context within ESO–MIDAS222European Southern Observatory Munich Image Data Analysis System, http://www.eso.org/projects/esomidas/.
3 Abundance analysis
3.1 Model atmospheres and stellar parameters
We have adopted OSMARCS LTE model atmospheres, computed using the grid defined by Edvardsson et al. (1993) with the last updated version of the MARCS code of Gustafsson et al. (1975) with improved UV-line blanketing (see also Edvardsson et al. 1994). The abundances of Grevesse & Sauval (2000) have been used as the reference for solar abundances.
For our sample of field stars we have used the atmospheric parameters (effective temperatures , surface gravities , and microturbulent velocities ) published in Gratton et al. (2003a), which we recall in Table 1. We only had to adjust the microturbulent velocities for some stars (values of written in italic in Table 1) to according to comparisons with theoretical curves of growth. In addition we have added ratios at 4500 and 6500 Å to show the quality of these UVES spectra near regions in which we have searched for heavy element signatures.
The procedure was different for the GCs. In each one of the three clusters the sample stars near the TO point on one hand, and the sample of subgiants on the other hand, are all very close to each other in the colour-magnitude (CM) diagram of the corresponding cluster. As a consequence, like in Gratton et al. (2001) and Carretta et al. (2004), we have used two sets of atmospheric parameters: one for subgiants and one for TO stars. Concerning the cluster NGC 6752, we have already described the procedure that was used to check these parameters in Paper I. In the same way, we have checked –and then adopted– the parameters published by Gratton et al. (2001) for NGC 6397 and by Carretta et al. (2004) for 47 Tuc. The only difference is that for this last cluster, unlike in Carretta et al. (2004), we have chosen to use mean parameters not only for the TO stars but also for the subgiants. As the effective temperatures determined by Carretta et al. (2004) for the subgiants are all similar within 100 K, we have chosen to adopt the mean value of K for these stars. This value was checked with the excitation equilibrium method, asking that lines of the same species with different excitation potentials should produce the same abundance. This method was applied to Fe i lines with equivalent widths . We have also used a slightly lower value of the gravity ( instead of 3.84), which was adjusted using comparisons to theoretical curves of growth so that the ionization equilibrium of iron and titanium were both respected. Table 2 summarizes the different parameters adopted in each cluster. These sets of parameters were then used for each cluster to recompute the metallicity with our OSMARCS code, which we finally used as input parameter in our detailed computations.
3.2 Abundance determinations
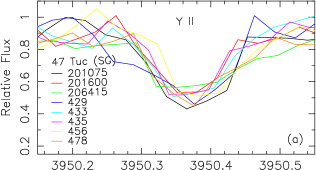
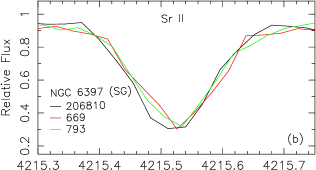
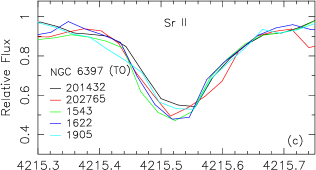
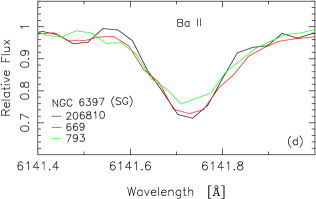
Even with these high-resolution spectra it was not always possible to determine precise abundances for several heavy elements in single stars of 47 Tuc due to the low ratios and very strong lines at this metallicity (), or even to detect weak lines such as those of europium in the faint and metal-poor () TO stars of NGC 6397 (see Fig. 1 for a comparison of the line intensities in these two clusters) as it had been possible in NGC 6752 (see Paper I, ).
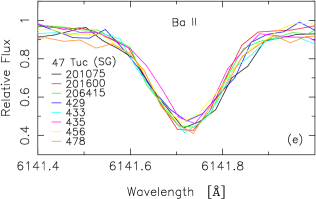
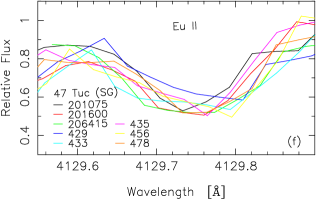
A careful inspection of the individual spectra revealed that the detected lines of a given –capture element (Sr, Y, Ba, or Eu) all have the same intensity in stars of the same sub-sample (subgiants or TO stars in each of the two clusters 47 Tuc or NGC 6397). Furthermore, when overplotted, the different profiles are almost undistinguishable (as is illustrated in Fig. 2). This means that the stars of each sub-sample are not only very similar concerning the atmospheric parameters, but that there is also almost no dispersion in the abundance of these elements in the considered sub-samples of the two GCs. As we are using the same atmospheric parameters for each single star of a given sub-sample, the computed abundances should be exactly the same (within the errors, see Sect. 3.5). Moreover, adding the spectra increases the per pixel around the lines of the –capture elements, making some lines easier to detect and thus providing very accurate mean values for the metallicity and also for the abundances of heavy elements in each sub-sample. As a matter of fact, this makes it possible to make much better determinations in the noisy spectra of 47 Tuc, and to obtain at least upper limits close to detection for the Eu abundance in NGC 6397 (see Table 4). The ratios in these summed spectra range from 45–55 in the blue and 70–90 in the red spectra of 47 Tuc, to 80–90 in the blue and 150–180 in the red spectra of NGC 6397 (see Sect. 2 for a comparison with typical individual values).
| Star ID | [Fe/H] | [Sr/Fe] | [Y/Fe] | [Ba/Fe] | [Eu/Fe] | ||||||||
|---|---|---|---|---|---|---|---|---|---|---|---|---|---|
| CD-35 0360 | –1.17 | +0.16 | 0.19 | 2 | +0.19 | 0.03 | 5 | +0.66 | 0.03 | 3 | +0.46 | … | 1 |
| HD 010607 | –1.04 | +0.05 | 0.30 | 2 | –0.21 | 0.11 | 4 | +0.18 | 0.06 | 3 | +0.25 | … | 1 |
| HD 029907 | –1.55 | –0.08 | 0.20 | 2 | –0.22 | 0.09 | 5 | +0.11 | 0.04 | 3 | +0.66 | … | 1 |
| HD 031128 | –1.55 | +0.18 | 0.15 | 2 | +0.04 | 0.06 | 5 | +0.34 | 0.07 | 3 | +0.47 | … | 1 |
| HD 108177 | –1.72 | +0.32 | 0.18 | 2 | +0.02 | 0.08 | 7 | +0.14 | 0.07 | 4 | +0.41 | … | 1 |
| HD 116064 | –1.93 | … | … | 0 | +0.83 | … | 1 | +0.08 | 0.15 | 4 | +0.52 | … | 1 |
| HD 120559 | –0.89 | –0.05 | 0.13 | 2 | –0.13 | 0.12 | 4 | +0.15 | 0.12 | 4 | +0.32 | … | 1 |
| HD 121004 | –0.70 | –0.03 | 0.06 | 2 | –0.07 | 0.08 | 3 | +0.26 | 0.11 | 4 | +0.29 | … | 1 |
| HD 126681 | –1.21 | +0.27 | 0.06 | 2 | +0.26 | 0.13 | 7 | +0.60 | 0.11 | 4 | +0.48 | … | 1 |
| HD 132475 | –1.68 | +0.30 | 0.11 | 2 | +0.18 | 0.06 | 7 | +0.56 | 0.06 | 4 | +0.35 | … | 1 |
| HD 134169 | –0.82 | +0.07 | 0.12 | 2 | –0.08 | 0.03 | 3 | +0.37 | 0.14 | 4 | +0.24 | … | 1 |
| HD 134439 | –1.38 | –0.26 | 0.23 | 2 | –0.47 | 0.03 | 3 | –0.01 | 0.11 | 4 | +0.50 | 0.02 | 2 |
| HD 134440 | –1.27 | –0.55 | 0.39 | 2 | –0.68 | 0.05 | 4 | –0.06 | 0.14 | 4 | +0.41 | … | 1 |
| HD 140283 | –2.55 | –0.44 | 0.04 | 2 | –0.49 | 0.17 | 3 | –0.90 | 0.04 | 2 | +0.39 | … | 1 |
| HD 145417 | –1.37 | … | … | 0 | –0.05 | 0.12 | 4 | +0.39 | 0.09 | 3 | +0.86 | … | 1 |
| HD 159482 | –0.82 | +0.12 | … | 1 | –0.04 | 0.09 | 4 | +0.29 | 0.09 | 4 | +0.31 | … | 1 |
| BD+05 3640 | –1.10 | … | … | 0 | +0.24 | 0.12 | 4 | +0.74 | 0.06 | 3 | +0.39 | … | 1 |
| HD 166913 | –1.64 | +0.42 | 0.16 | 2 | +0.22 | 0.08 | 4 | +0.33 | 0.10 | 4 | +0.33 | … | 1 |
| HD 181743 | –1.87 | +0.23 | 0.11 | 2 | –0.01 | 0.05 | 5 | +0.19 | 0.07 | 2 | +0.56 | … | 1 |
| HD 188510 | –1.55 | –0.04 | 0.17 | 2 | –0.28 | 0.07 | 4 | +0.25 | 0.12 | 4 | +0.39 | … | 1 |
| HD 189558 | –1.19 | +0.28 | … | 1 | +0.07 | 0.11 | 6 | +0.51 | 0.13 | 4 | +0.33 | … | 1 |
| HD 193901 | –1.14 | –0.01 | 0.22 | 2 | –0.17 | 0.09 | 6 | +0.36 | 0.16 | 4 | +0.48 | … | 1 |
| HD 194598 | –1.18 | –0.16 | 0.53 | 2 | –0.19 | 0.09 | 6 | +0.28 | 0.10 | 4 | +0.32 | … | 1 |
| HD 204155 | –0.73 | … | … | 0 | +0.07 | 0.08 | 3 | +0.37 | 0.10 | 4 | +0.27 | … | 1 |
| HD 205650 | –1.20 | +0.10 | 0.17 | 2 | +0.07 | 0.10 | 5 | +0.37 | 0.14 | 4 | +0.61 | 0.11 | 2 |
(a) = standard deviation around the mean value; (b) = number of lines used for the element X.
| Cluster ID | Type(a) | [Fe/H] | [Sr/Fe] | [Y/Fe] | [Ba/Fe] | [Eu/Fe] | ||||||
| NGC 104 / 47 Tuc | SG | 8 | –0.69 | 0.06 | +0.36 | 0.16 | –0.11 | 0.10 | +0.35 | 0.12 | +0.17 | … |
| TO | 3 | –0.68 | 0.01 | +0.28 | 0.14 | +0.06 | 0.01 | +0.22 | 0.12 | +0.11 | … | |
| NGC 6397 | SG | 3 | –2.08 | 0.01 | –0.04 | 0.14 | –0.20 | 0.09 | –0.17 | 0.06 | +0.41 | 0.09 |
| TO | 5 | –2.07 | 0.01 | –0.06 | 0.15 | –0.17 | 0.13 | –0.31 | 0.06 | +0.46 | … | |
| Data for NGC 6752 (from James et al. 2004). | ||||||||||||
| NGC 6752 | SG | 9 | –1.49 | 0.07 | –0.01 | 0.09 | –0.01 | 0.13 | +0.25 | 0.08 | +0.40 | 0.09 |
| TO | 9 | –1.48 | 0.07 | +0.12 | 0.19 | –0.03 | 0.11 | +0.11 | 0.09 | +0.47 | 0.08 | |
(a) SG = subgiants, TO = turnoff stars; (b) = number of stars in each group; (c) = standard deviation around the mean value.
3.3 Iron abundances
The iron abundances for all our stars (field sample and clusters) were deduced from equivalent width measurements made with an automatic line fitting procedure based on the algorithms of Charbonneau (1995), which perform both line detection and gaussian fits of lines including blends. We made a selection of 30–40 (depending on the quality of the spectra) Fe i lines with and kept all the detected Fe ii lines.
Table 3 lists iron abundances (the average of Fe i and Fe ii) in our field stars, and Table 4 gives the mean values in the clusters. All these metallicities are fully compatible with previous studies (Gratton et al. 2001; Bonifacio et al. 2002; Gratton et al. 2003a; Carretta et al. 2004, and references therein). We note that there is almost no dispersion between the metallicities found in the subgiants or in the TO stars, especially in NGC 6397, as was emphasized by Gratton et al. (2001) and Bonifacio et al. (2002).
3.4 Heavy element abundances
Heavy element abundances were measured in the same way for field and cluster stars. Strontium, yttrium, barium and europium lines were detected using the same automatic line fitting procedure as for iron lines, but abundances were determined using synthetic spectra: we used an updated version of the synthetic spectrum code of Spite (1967). This allowed us to take into account the hyperfine structure (hereafter “hfs”) of several barium and europium lines (e.g. McWilliam 1998, and references therein), and it was also more efficient for the very strong and broad lines of strontium where a simple gaussian fit did not always match the line profile. The computations were done using LTE model atmospheres but we are aware that heavy elements can be affected by non-LTE (e.g. Mashonkina et al. 1999; Mashonkina & Gehren 2000, 2001). At intermediate metallicities, in most of the cases the corrections to be applied do not exceed 0.15 dex. The size of these corrections depends on the observed line and on the atmospheric parameters, but in the present case, as we are especially interested in abundance determinations in GCs, regarding the uncertainties in the atmospheric parameters in our clusters combined with the error in the measurements, a real change in the abundance patterns of our sample is not expected.
The line parameters for Sr ii and Y ii were taken from Sneden et al. (2003). Strontium abundances were obtained from the lines at 4077.71 and 4215.52 Å, and yttrium abundances were deduced from the lines at 3950.36 and 4398.01 Å in the clusters, and for the field stars also from the lines at 3549.01, 3600.74, 3611.04, 3774.33, and 3788.70 Å. Barium and europium hfs parameters were taken respectively from McWilliam (1998) and Lawler et al. (2001). The Ba ii lines at 5853.69, 4554.03, 6141.73 and 6496.91 Å and the Eu ii line at 4129.70 Å could almost always be detected in the whole sample (field and cluster stars). Sometimes we also had the Eu ii line at 4205.05 Å, but it was almost always very strongly blended.
3.5 Error estimations
| El. | ||||
|---|---|---|---|---|
| +100 K | +0.2 dex | +0.2 km s-1 | ||
| Field stars (e.g. HD132475) | ||||
| Fe i | +0.09 | –0.01 | –0.03 | 0.10 |
| Fe ii | +0.01 | +0.09 | –0.03 | 0.10 |
| Sr ii | +0.09 | –0.02 | –0.02 | 0.09 |
| Y ii | +0.06 | +0.07 | –0.10 | 0.14 |
| Ba ii | +0.07 | +0.02 | –0.10 | 0.12 |
| Eu ii | +0.05 | +0.08 | –0.02 | 0.10 |
| 47 Tuc – Subgiants | ||||
| Fe i | +0.10 | –0.04 | –0.09 | 0.14 |
| Fe ii | –0.06 | +0.08 | –0.06 | 0.12 |
| Sr ii | +0.04 | +0.01 | –0.03 | 0.05 |
| Y ii | +0.03 | +0.07 | –0.12 | 0.14 |
| Ba ii | +0.04 | +0.01 | –0.10 | 0.11 |
| Eu ii | +0.03 | +0.07 | –0.09 | 0.12 |
| 47 Tuc – TO stars | ||||
| Fe i | +0.09 | –0.04 | –0.08 | 0.13 |
| Fe ii | –0.01 | +0.06 | –0.07 | 0.09 |
| Sr ii | +0.06 | –0.01 | –0.02 | 0.06 |
| Y ii | +0.04 | +0.07 | –0.10 | 0.13 |
| Ba ii | +0.05 | +0.03 | –0.11 | 0.12 |
| Eu ii | +0.03 | +0.08 | –0.05 | 0.10 |
| NGC 6397 – Subgiants | ||||
| Fe i | +0.10 | –0.01 | –0.07 | 0.12 |
| Fe ii | +0.02 | +0.08 | –0.04 | 0.09 |
| Sr ii | +0.10 | +0.01 | –0.13 | 0.16 |
| Y ii | +0.07 | +0.08 | –0.08 | 0.13 |
| Ba ii | +0.07 | +0.05 | –0.06 | 0.10 |
| Eu ii | +0.04 | +0.07 | –0.01 | 0.08 |
| NGC 6397 – TO stars | ||||
| Fe i | +0.08 | –0.04 | –0.07 | 0.11 |
| Fe ii | +0.01 | +0.06 | –0.03 | 0.07 |
| Sr ii | +0.05 | +0.03 | –0.18 | 0.19 |
| Y ii | +0.05 | +0.07 | –0.01 | 0.09 |
| Ba ii | +0.05 | +0.05 | –0.03 | 0.08 |
| Eu ii | +0.05 | +0.06 | –0.03 | 0.08 |
We assumed that the total error budget was due to random uncertainties in the oscillator strenghts ( values) and in the measurement of the equivalent widths (or to fitting uncertainties), and to errors in the stellar parameters. When lines of a given element are observed, the random uncertainties can be estimated using the standard deviation around the mean abundance (see Tables 3 and 4). The errors linked to the uncertainties in the stellar atmosphere parameters were estimated assuming the following variations: , , and .
Table 5 summarizes the typical error estimates for field stars and for GC stars. Computations of the errors for the other stars of our sample give similar results. The total error given in the last column of Table 5, , is the quadratic sum of all the individual uncertainties linked to the atmospheric parameters, and does not take into acount the uncertainty coming from the measurements of the equivalent widths (or the fitting errors). From this table, we can see that the total error due all the uncertainties in the atmospheric parameters almost never exceeds 0.15 dex.
4 Results
4.1 Abundance patterns
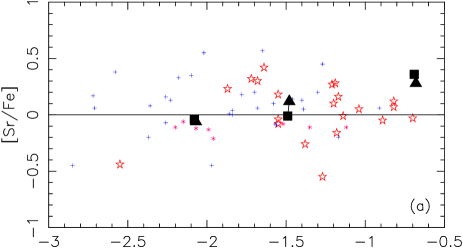
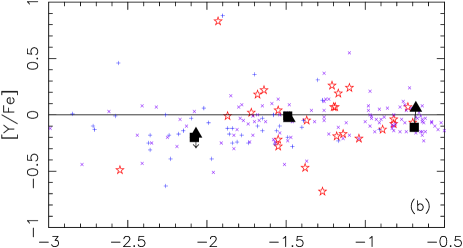
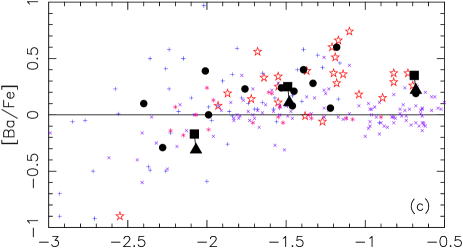
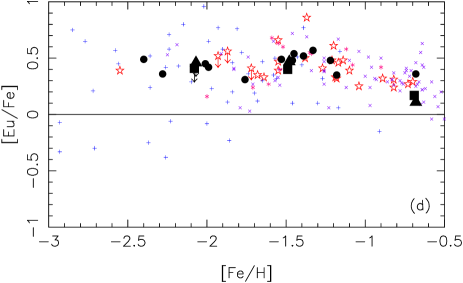
Figure 3 displays the [–capture/Fe] ratios as a function of the metallicity for our sample stars. To increase the field halo star sample, we have added data points from Burris et al. (2000), Fulbright (2000), and the halo stars of Mashonkina & Gehren (2001) and Mashonkina et al. (2003). We have used the following symbols for Figs. 3 and 4: Filled squares () indicate the subgiants in our three GCs, and filled triangles () indicate the TO stars in the same clusters (for a given cluster, the two data points are joined by a line); open stars () stand for our field stars, and other GCs and field stars –from the literature– are respectively represented by filled circles () and small crosses (, , ); limits are always indicated by an arrow plotted on one of the previous symbols. The data for other GCs that we show here for comparison have all been obtained from the analyses of bright giant stars near the top of the color-magnitude diagrams of the corresponding clusters. Only the analysis of Ramírez & Cohen (2003) goes as deep as ours and provides data for some heavy elements in M 71 and M 5, and also barium for some stars near the turnoff point of these two clusters.
-
Strontium (Fig. 3a): there is some (expected, see Ryan et al. 1991) spread in the [Sr/Fe] ratios of our field halo stars, but these ratios still follow the general trend found in other studies (e.g. Burris et al. 2000; Mashonkina et al. 2003, and references therein). Strontium abundances could be determined for almost the whole sample, with the exception of four stars –owing to strong blends in the Sr ii lines– (see Table 3). Most of the strontium to iron ratios are solar or slightly oversolar.
The three GCs also follow this trend. NGC 6397 and NGC 6752 have both [Sr/Fe] ratios very close to the solar value:
and
for NGC 6397;
and
for NGC 6752, and 47 Tuc seems definitively to have a rather oversolar strontium to iron ratio:
and .
The abundance spreads among the two star types in the clusters (subgiants or dwarves) are comparable, but as we already noticed in Paper I, there seems to be a larger spread for dwarves than for subgiants in NGC 6752. We can add that the abundance spreads are probably due in major part to the difficulty of positioning the continuum level in the fits of the Sr ii lines in the three clusters. In any case, the standard deviations given here (see also Table 4) are larger than the difference between the ratios in the subgiants and in the dwarves, which we can remark is quite small ( 0.1 dex). -
Yttrium (Fig. 3b): our field halo sample abundance distribution agrees well with previous studies at intermediate metallicity (Burris et al. 2000; Fulbright 2002, and references therein). The dispersion in the yttrium to iron ratios is comparable to what is found in other studies at this metallicity range, and almost all our field sample stars have [Y/Fe] ratios concentrated around the solar value.
We can notice that the GCs follow this trend and also have values very close to the solar ratio. Yttrium abundances were obtained for almost each star type in the three clusters, and we obtained an upper limit for the TO stars in NGC 6397:
and
for NGC 6397;
and
for NGC 6752;
and
for 47 Tuc. For the two clusters NGC 6752 and NGC 6397, the standard deviations are larger than the dispersion between the ratios in the different stellar types, while in the case of 47 Tuc we note a small offset (0.17 dex) in the [Y/Fe] ratio between the subgiants and the dwarves. -
Barium (Fig. 3c): barium abundances have been determined for all the field halo stars. Most of them have solar or oversolar barium to iron ratios, which is in good agreement with previous publications of metal-poor star analyses in this metallicity range (Burris et al. 2000; Fulbright 2002; Mashonkina et al. 2003). The dispersion found among our sample stars for a given metallicity agrees also with previous data.
The three GCs follow exactly the same trend. We find:
and
for NGC 6397;
and
for NGC 6752;
and
for 47 Tuc. For the three clusters, we note a small offset between the subgiants and the dwarves (0.14 dex in NGC 6397 and NGC 6752 –see also Paper I–, and 0.13 in 47 Tuc), the latter having always the lower value in a given cluster. From these data points only, we could easily conclude that the [Ba/Fe] ratio in Galactic GCs undergoes a soft decline as the metallicity decreases below –2.0, just as is seen in the metal-poor field stars (Gratton & Sneden 1994; Fulbright 2002, and references therein), but a quick comparison to previous abundance analyses of giants in Galactic GCs (Armosky et al. 1994; Shetrone 1996; Sneden et al. 1997, 2000, 2004; Ivans et al. 1999; Shetrone & Keane 2000; Ivans et al. 2001; Lee & Carney 2002; Ramírez & Cohen 2003) shows that the existing dispersion of the [Ba/Fe] ratio becomes larger at low metallicities, so that no real conclusion can yet be drawn. Anyway, these studies give [Ba/Fe] ratios in giants ranging from –0.29 to +0.60 in GCs with metallicities between –2.40 and –0.68, and our analysis is wholly compatible with these values. -
Europium (Fig. 3d): europium abundances have been determined for almost the whole sample, and upper limits are given for the only three field halo stars where no reliable measure was possible. The abundance spread is noticeably smaller than for the other –capture elements in the field sample. The field stars all have oversolar europium to iron ratios concentrated around +0.40 dex, and they agree completely with the ratios given by other studies at intermediate and low metallicity (Fulbright 2002; Mashonkina et al. 2003, and references therein).
The GCs follow this trend remarkably well as we find (upper limits have been preferred for NGC 6397):
and
for NGC 6397;
and
for NGC 6752;
and
for 47 Tuc. We can see that there is almost no difference between the subgiants and the TO stars. Giants in other GCs give very similar results (oversolar values near +0.40–0.50 dex), as seen from Armosky et al. (1994), Shetrone (1996), Sneden et al. (1997, 2000, 2004), Ivans et al. (1999, 2001), Shetrone & Keane (2000), Lee & Carney (2002) and Ramírez & Cohen (2003). The dispersion in the [Eu/Fe] ratio among all these Galactic globular clusters is extremely small in comparison to the existing scatter of the [Ba/Fe] ratio in the same clusters.
We did not observe any systematic effect between our field halo stars and previous analyses of field stars (we used data from Burris et al. 2000; Fulbright 2002; Mashonkina et al. 2003) in the same metallicity range (). Consequently, as our cluster stars have been observed in the same conditions as the field star sample, we did not expect to find any systematic effect in the abundance ratios found for the cluster stars.
The choice of analysing subgiants and especially dwarves near the TO point in the three clusters is very interesting. As a matter of fact, most of the previous studies of globular clusters have been made with bright giant stars (–12 mag), which have very strong and broad lines. To produce accurate abundances for heavy (–capture) elements in such stars is not easy for several elements like strontium (strong and broad lines) or europium (weak and blended lines). With our sample of fainter stars (–17.5 mag), we have obtained accurate abundances for barium and yttrium, but also for the strong lines of strontium and even for europium. The abundances of yttrium, barium and europium are in fair agreement with previous abundance determinations made in a couple of giants in 47 Tuc, NGC 6752, and NGC 6397 (Norris & Da Costa 1995; Castilho et al. 2000). To our knowledge, these are the first precise measurements of heavy element abundances in such a sample of unevolved stars, and these are probably also the first results for strontium abundances in these three GCs.
For the three GCs, the standard deviation around a mean ratio (see Table 4)
gives a good idea of the internal errors (excitation potentials, , equivalent widths, line fits…)
in all the lines used for the abundance determinations.
When combined with the errors in the atmospheric parameters (see Table 5), it gives an
estimation of the total error in the abundance determination of a given element.
The errors in the individual [–capture/Fe] ratios are here usually a bit larger than the
difference between the ratios in the subgiants and in the TO stars, and if combined with the
errors in the atmospheric parameters they definitively are larger. For strontium, yttrium
and europium, this means that the data could be compatible with a unique mean value for each
cluster (with the exception of the [Y/Fe] ratio in 47 Tuc that shows a difference of 0.17 dex
between subgiants and TO stars). The case of barium seems a bit different: the [Ba/Fe] ratios
systematically show small offsets (0.13–0.14 dex) between the subgiants and the TO stars in our three
clusters, but the origin of this difference (real effect, quality of the spectra, physical models,
non-LTE effects, details of the hfs correction -which varies strongly with the
line strength-… ) is still unclear. This difference also seems to be present in M 5, which is one of the
very few other GCs where abundances were determined simultaneously in a small group of
subgiants and in stars near the turnoff: Ramírez & Cohen (2003) observed 5 subgiants ( mag)
and 6 TO stars ( mag). The mean value (from the data in their Table 5D) for the [Ba/Fe] ratio
in M 5 should be in the subgiants and for the stars near the TO point.
It would however be very hazardous to reach any general conclusion on this matter because
Ramírez & Cohen (2003) did not present abundances of other –capture elements
in their sample of subgiants and in the TO stars of M 5, so that no further comparison can
be done.
As a conclusion, we can again mark the excellent agreement between the [–capture/Fe] ratios in the three GCs NGC 6397, NGC 6752 and 47 Tuc, and in the field halo stars. In addition, the comparison to other Galactic GCs for which [Ba/Fe] and [Eu/Fe] ratios were also available showed practicaly no dispersion in the [Eu/Fe] ratios and excellent agreement in the [Eu/Fe] ratios between all the GCs at different metallicities. This could mean that these Eu abundances were already fixed in the Interstellar Medium (ISM) when the clusters formed. An existing dispersion in the [Ba/Fe] ratios similar to that of the field halo stars is also seen in this comparison, indicating a possible complex origin of the Ba abundances, e.g. involving contributions from early generations of intermediate-mass stars in the clusters.
4.2 Neutron-capture elements ratios
The –process element Eu is frequently compared to Ba, which is representative of the –process in the Sun. Previous analyses of metal-poor stars (Gratton & Sneden 1994; McWilliam et al. 1995; McWilliam 1998; Burris et al. 2000; Fulbright 2002) have shown that the [Ba/Eu] ratio decreases at low metallicities and approaches a pure –process ratio in most of the very metal-poor stars (see also the reviews by Truran et al. 2002; Cowan & Sneden 2004). This ratio can thus be used to test the relative importance of the – and –processes to the initial mix of materials at the birth of the stars, being very helpful in identifying the –capture nucleosynthesis mechanisms that are responsible for the production of the heavier elements () in field stars but also in GCs.
While the abundance patterns of the heavy –capture elements in field halo stars are commonly explained with a –process synthesis at very low metallicities followed by a progressive enrichment due to main s–process contributions at higher metallicities, the origin of the light () –capture elements such as Sr or Y, which can be also produced by a weak s–process, is more complex and is believed to involve at least one additional nucleosynthesis source (Burris et al. 2000; Honda et al. 2004; Travaglio et al. 2004, and references therein). It is therefore interesting to study the ratios of the lighter to the heavier –capture elements in order to constrain these formation processes.
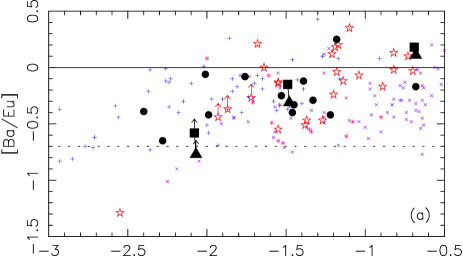
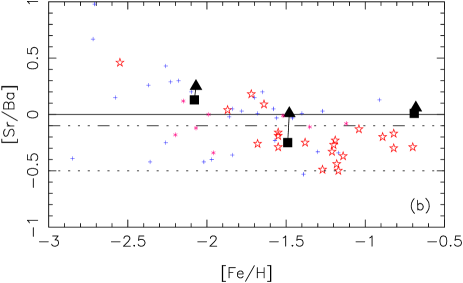
These processes are also likely to happen in GCs; it is therefore also very important to extend such analyses to these peculiar objects and to compare their behaviour to that of the field stars with similar stellar parameters. Figure 4 shows the [Ba/Eu] and [Sr/Ba] abundance ratios as a function of the metallicity for our programme stars (plus additional data from the literature). The horizontal full line in both panels (Fig. 4a and 4b) marks the total solar abundance ratio ( and ).
-
(Fig. 4a): the dotted line marks the solar –process-only fractional ratio , which is obtained using the data of Arlandini et al. (1999).
A first quick look at this figure reveals a dispersion in the [Ba/Eu] ratio. This is mainly a direct consequence of the previously described dispersion in the Ba abundances in our field stars as well as among the different clusters (see Fig. 3c and 3d). Regarding our sample of field stars, the [Ba/Eu] ratios are distributed near or below the solar value, between the solar r+s mix and the solar r–only fractional ratio, and are fully compatible with previous analyses in this metallicity range (shown in the figure: Burris et al. 2000; Fulbright 2000; Mashonkina & Gehren 2001; Mashonkina et al. 2003).
Our three GCs clearly show a decline of the [Ba/Eu] ratio with decreasing metallicities, which is similar to that observed in the field stars. But we must still be cautious with that assumption. In fact, when we add other GCs for comparison, the dispersion among the clusters makes it more difficult to draw a final conclusion: 47 Tuc (this work) and M 71 (Ramírez & Cohen 2003), which are the most metal-rich () clusters in this figure, have [Ba/Eu] ratios very close to that of the solar r+s mix; GCs at intermediate metallicity (), like NGC 6752 (see also Paper I, ), M 5 (Shetrone 1996; Ivans et al. 2001; Ramírez & Cohen 2003), M 79 (François 1991), NGC 362 (Shetrone & Keane 2000), M 13 and M 3 (Sneden et al. 2004) show clearly undersolar ratios slightly lower than that of M 71, but still higher than the solar r–only fractional ratio, while NGC 6541 (Lee & Carney 2002) and NGC 288 (Shetrone & Keane 2000) have ratios closer to that of the solar mix, and M 4 (Ivans et al. 1999) is oversolar (but this dispersion is still compatible with the dispersion among field stars); the most metal-poor clusters (), NGC 6397 (this work), NGC 6287, NGC 6293 (Lee & Carney 2002), M 92 (Shetrone 1996) and M 15 (Sneden et al. 1997) have undersolar ratios equal to or even lower than all the previously cited clusters; in particular NGC 6397 and M 92 have [Ba/Eu] ratios very close to the solar r–only fractional ratio. Finally, we can add that the dispersion between the dwarves and the subgiants in our three programme clusters is very small and that the data are compatible with a unique mean point for each cluster.
-
(Fig. 4b): the solar –process-only fractional ratio is also represented here by a dotted line, and the dash-dotted line indicates the higher ratio that is found when including a weak –process contribution to the solar strontium, according to Arlandini et al. (1999).
After a first inspection of this figure, we notice that the dispersion of the [Sr/Ba] ratio in the field stars seems lower than the dispersion in Sr or Ba taken separately (see Fig. 3a and 3c). Our sample of field halo stars follows exactly the pattern of previous studies in field stars at these metallicities (Burris et al. 2000; Mashonkina & Gehren 2001) and it shows an increase in the [Sr/Ba] ratio at the lowest metallicities. For , the [Sr/Ba] ratio is slightly below the solar system r+s mix, and at lower metallicities it increases and becomes oversolar, but the dispersion is also larger. In any case, the [Sr/Ba] is always higher than the solar r–only fractional ratio.
Our three programme clusters also show abundance ratios which are similar to those of field halo stars, and the data also seem to indicate a higher [Sr/Ba] ratio in NGC 6397, which is the most metal-poor cluster in our programme. To our knowledge, there are no other measurements of Sr in GCs that we could have used as a comparison, so that we cannot give any final conclusion on the general behaviour of the [Sr/Ba] ratio in GCs. The dispersion in these clusters is also very small. The difference in the [Sr/Ba] ratio between the dwarves and subgiants of NGC 6752 seems to be mainly due to observational errors and has already been discussed in Paper I.
Both ratios in GCs are compatible with field stars in the same metallicity range, but it is
also interesting to compare the most metal-poor as well as the most metal-rich GCs with very metal-poor
and –elements rich stars like CS 31082-001 (, Hill et al. 2002) and CS 22892-052
(, Sneden et al. 2003), which both show –capture ratios very close to a pure –process
origin. In particular, the GCs M 5, M 79, NGC 6293 and M 15 show [Ba/Eu] ratios very close to that of
CS 31082-001 (), while two of the most metal-poor clusters, NGC 6397 and M 92, have ratios very
similar to that of CS 22892-052 (). But none of these clusters present a [Sr/Ba] ratio close
to those of these two stars ( in CS 31082-001, and –0.39 in CS 22892-052). The most
metal-rich clusters, 47 Tuc and M 71, show abundance ratios that depart significantly from those two –process
enriched metal-poor stars.
To summarize, the [Ba/Eu] and [Sr/Ba] ratios in GCs follow the trends found in field stars in the metallicity range , clearly showing an enrichment process that is incompatible with an r–only origin of the –capture elements. This implies definitively that –process contributions must be taken into account for the synthesis of the heavy elements in GCs. To our knowledge, there have been (almost) no other precise determinations of Sr abundances in GCs until now, so that we cannot compare all of our data to previous studies. But our results seem to support strongly the idea of having several different nucleosynthesis sources for the heavy elements in GCs (at the least, the “classical” –process, and the main and/or weak s–processes).
5 Discussion
5.1 About globular clusters and field stars
For most of the very metal-poor field halo stars () it is commonly assumed that –capture elements have been created exclusively by the –process occurring during Type II supernovae explosions (“r–only hypothesis”). While the first suggestions of Truran (1981) had only been based upon data for a few individual metal-poor stars (e.g. Spite & Spite 1978), more recent systematic observations of heavy elements in extended samples seem to support strongly this hypothesis (e.g. Gilroy et al. 1988; Ryan et al. 1996; Burris et al. 2000; Fulbright 2002; Johnson & Bolte 2002; François et al. 2003, and references therein). For such metal-poor stars, it is assumed that the “classical” –process is alone responsible for the production of the heavier () –capture elements, while the large and increasing scatter in the [Sr/Ba] ratio at very low metallicities, e.g. as seen in the data of Honda et al. (2004), reveals a possible second type of –process for some of the lighter () –capture elements (see the recent reviews of Truran et al. 2002, and Cowan & Sneden 2004). This could be interpreted by different mass ranges of supernovae being responsible for the production of the light or the heavy –capture elements (Qian & Wasserburg 2000; Wanajo et al. 2003). At higher metallicities, other events begin to contribute to the production of the heavy elements in the Galactic halo. Many neutron-capture elements are then also produced by the main s–process which occurs during the He-burning phases of low- or intermediate-mass AGB stars of typically 1–4 . Several light –capture elements like strontium or yttrium can also partly be produced by an additional (weak) –process source, during the He-core burning of massive stars (see also Busso et al. 1999; Travaglio et al. 2004, and references therein).
Concerning the origin of the heavy elements in GCs in comparison to the field halo stars, many questions may arise, but we will concentrate mainly on these: what is the origin of their metallicities? Are GCs self-enriched? How can they be so homogeneous in Fe-peak elements and neutron-capture elements, but show such high dispersions in the light metal abundances? Do heavy elements in globular clusters share a common origin with field halo stars of similar metallicities? Until now, no models and no predictions have been made on this subject, leaving these questions still unanswered.
Let us briefly summarize some of the latest results obtained from the abundance analyses of globular cluster scarcely evolved stars:
- 1.
-
2.
Neutron-capture elements do not show such relations as a function of other (lighter) elements, and this is also independent of the evolutionary phase ( and this work Paper I).
-
3.
There is almost no variation in the abundances of heavy elements between stars at different evolutionary phases in a given globular cluster ( Paper I, and the present work).
The third point seems to be confirmed not only in our three programme clusters, but also in M 71 and M 5, at least for barium, which is the only heavy element presented by Ramírez & Cohen (2003) in stars fainter than the RGB. We expect that this shall be confirmed by future analyses in other clusters. For the present work, it supports strongly the idea that we can compare directly our sample of faint turnoff stars and subgiants to bright giants in other GCs (see Sect. 4).
The so-called abundance “anomalies” of the light metals in GCs can be interpreted in the light of self-pollution scenarios (Cottrell & Da Costa 1981), which predict that these inhomogeneities arise from the mass lost by intermediate-mass (4–6 ) stars during their AGB phase (Ventura et al. 2001; D’Antona et al. 2002). Some of these models can explain and/or predict very well the existing anticorrelations between light metals, but until now none of them clearly explains the origin of the cluster’s metallicities, nor do they give any clues on the r–/s–process elements ratios. Moreover, Fenner et al. (2004) recently developed a self-consistent model of the chemical evolution of intracluster gas to test wether the observed “anomalies” of NGC 6752 have been caused by contamination from intermediate-mass AGBs. Their model does not distinguish the case where cluster stars form from gas already contaminated by AGB ejecta, and the case where existing stars accrete AGB material. They conclude that, for their particular model, intermediate-mass AGBs do not seem to be the major cause of all the observed globular cluster abundance anomalies. It is obviously not yet clear if GCs are completely formed out of already enriched matter, and if the heavy element content of the cluster has a primordial origin. Additional models are required, starting e.g. from the “classical” scenario of self-enrichment proposed by Cayrel (1986) or Truran et al. (1991).
5.2 The “classical” self-enrichment scenario
For GCs as for field stars, a first generation of massive stars () of short lifetime ( years) and the associated Type II SNe are expected to be the major source of nucleosynthesis on a timescale compatible with a halo collapse timescale (– years). However, the most metal-poor field stars and the GCs could have different origins and could have been independently contaminated by the ejecta of massive stars and Type II SNe. But if we assume a common origin, different models of self-enrichment could be adopted for the clusters. Cayrel (1986) and Truran et al. (1991) proposed simple models of self-enrichment where the metallicity distribution of GCs is a superposition of that of a metal-poor, primary, and possibly primordial system, and that of a secondary system born from matter processed by the primary system. In these scenarios, the metallicity of the old halo clusters can be understood as caused by self-pollution of primordial () clouds: the first zero-metal stellar generation is polluted by massive stars () and Type II SNe formed in these massive collapsing clouds. The next generation of stars formed the currently observed generation in the halo GCs. The abundance ratios of younger GCs formed during the flattening of the protogalaxy is explained along the classical view of progressive metal enrichment.
Truran (1988) proposed a test to see wether this kind of self-enrichment scenario is appropriate for GCs, provided by careful observations of abundance patterns in the most metal-rich clusters associated with the halo population. Field stars at comparable metallicities show abundance patterns relative to iron which are evolving toward those of solar system matter. This reflects the nucleosynthesis contributions from intermediate-mass stars of longer lifetimes that enriched the ISM in C, N, Fe–peak nuclei and –process heavy elements. But self-enrichment of a globular cluster should happen on a much shorter timescale. Thus, if self-enrichment indeed occurred for the halo GCs, then even the most metal-rich clusters should exhibit both the high [/Fe] ratios and the –process dominated heavy element patterns which characterize the ejecta of massive stars, as they are seen in the spectra of the most metal-poor field halo stars.
This means that the heavy element ratios [Ba/Eu] and [Sr/Ba] should reflect an –process origin, e.g. like the peculiar stars CS 31082-001 (Hill et al. 2002) and CS 22892-052 (Sneden et al. 2003). But this pattern is clearly not seen among GCs, independently of the metallicity. The [Ba/Eu] ratios indicate clearly a growing contribution of the main s–process to the chemical enrichment of GCs, and the [Sr/Ba] ratios confirm this by departing significantly from a pure –process value (see Figs. 4a and 4b). The fact that some of the most metal-poor clusters show [Ba/Eu] ratios very close to a pure –process value but a [Sr/Ba] ratio that departs significantly from the –process only ratio could also indicate an additional source for the production of strontium (the weak s–process, which can show some contributions at these metallicities). The presence of anticorrelations between several –elements (O–Na, Mg–Al) in the clusters is also incompatible with a simple self-enrichment model. A more elaborate model is required to explain the formation of the halo GCs. However, the idea that abundance ratios of younger GCs can be explained “along the classical view of progressive metal enrichment” is still interesting. As a matter of fact, 47 Tuc is 2.6 Gyr younger and much more metal-rich than NGC 6752 or NGC 6397 (Gratton et al. 2003c), so that it seems to indicate that younger (disk) clusters must definitively have been formed out of pre-enriched matter in a similar way to field stars at high metallicities.
5.3 Alternative scenarios
Thoul et al. (2002) continued the development of the EASE scenario (Evaporation/Accretion/Self-Enrichment) of Parmentier et al. (1999) that explains how accretion could have altered the stellar surface composition of GCs and halo metal–poor stars. According to the EASE scenario, an important fraction of the metal-poor halo stars was initially formed in GCs, where they accreted the –process enriched gas produced by cluster stars of higher-masses. This process modified their surface chemical composition. Later these stars evaporated from the cluster and formed a part of the current halo population. The evolution of GCs is described in two phases: (1) “first generation” very metal-poor stars have rather high masses (–60 ). The most massive stars quickly evolve to become supernovae and enrich the intracluster medium in – and –process elements. These supernova remnants enrich the primordial ISM gas and trigger star formation. If the gravitational potential of the proto-cluster is too weak, the stars evaporate and become field halo stars. If the gravity is strong enough, a GC is formed. (2) At this point, the chemical composition of the intracluster gas is definitively fixed in – and –process elements. Intermediate-mass stars become AGB stars and produce –process elements, which are brought to their surface by the third dredge-up. Stellar winds may eject these elements into the surrounding intracluster medium. This –process enriched gas can eventually be accreted by low-mass main sequence stars and pollute their surface chemical composition.
Our results show very homogeneous [Eu/Fe] ratios in all GCs. This could be in agreement at least with the first phase of the EASE scenario (first generation of high-mass stars, and fixed composition in –process elements). But if this accretion mechanism is really efficient, it is expected to affect especially the star’s convective zone. When a star evolves and becomes a giant, its convective zone becomes much larger, so that a dilution effect is expected in the –process enrichment between main sequence turnoff stars and stars at the top of the giant branch. Our results show that the content in –process elements may be very different from one cluster to the other, but that it does not vary inside a given cluster. It seems on the contrary that GCs are quite homogeneous in their heavy element content (– and –process elements), independently of the evolutionary phase of the star. Our results for turnoff stars and subgiants in 47 Tuc, NGC 6752, and NGC 6397 are also compatible with the previous analyses of giants by Norris & Da Costa (1995), and Castilho et al. (2000). We find a very small but systematic dispersion in the [Ba/Fe] ratios between turnoff stars and subgiants in these three GCs that we still cannot completely explain (errors in the stellar parameters, in the line parameters, or in the fitting method; non-LTE effects -see Sect. 4-). However, if this effect is real, it does not support an accretion scenario, as we obtain slightly higher values in dwarves than in subgiants, but the dilution in the growing convective zone should produce the opposite results.
In any case, the fact that we find homogeneous abundances of –process elements and simultaneously “abundance anomalies” in the light metals also in dwarves (Gratton et al. 2001; Carretta et al. 2004), but no correlation between both observations, is very interesting because dwarves cannot produce neutron-capture elements alone, nor do they undergo deep mixing episodes. To explain both observations at the same time, we could think, for example, that GCs may have been formed out of matter which was already enriched in –, – and –elements, just like “normal” field halo stars at intermediate or high metallicity. The “abundance anomalies” among light metals could then be explained with self-pollution mechanisms (Ventura et al. 2001; D’Antona et al. 2002) acting only over a restricted mass range of the contaminating AGB stars, so that the composition of the GCs in –process elements is not altered, or at least only in a very small, nearly undetectable, amount. This could explain why the abundance patterns of neutron-capture elements in GCs agree so well with those of field halo stars in the same metallicity range. It would also be compatible with the idea that GCs should not always be considered as “primordial” objects because, after all, we can observe field stars that are up to several hundred times more metal-deficient than the most metal-poor GCs (François et al. 2003; Christlieb et al. 2004).
Beasley et al. (2003) suggested an alternative scenario in which the most metal-poor halo GCs may have a pregalactic origin and may have been enriched by the first supernovae in the universe. They find that one pair-instability supernova alone, issued from a very massive primordial star (), could have been sufficient to enrich primordial gas to a metallicity of . They do not make predictions for the light metals that can be affected by stellar evolution processes (O, Na…), and concentrate only on elements which are heavier than silicium. Several problems arise for this kind of model: (1) a combination of masses for the Population III stellar progenitors is needed to fit simultaneously the observed abundance ratios of [Si/Fe], [Ca/Fe], and [Ti/Fe], [V/Fe], or [Ni/Fe]; (2) such massive progenitors cannot produce neutron-capture elements (no – or –process). Additional physics (rotation of the massive star, pollution of the immediate environment) could probably explain the presence of neutron-capture elements in GCs, but in any case this scenario hardly explains why the light metals also show a huge dispersion in main-sequence turnoff stars…
6 Conclusions
We have determined abundances for several neutron-capture elements in stars near the turnoff and at the base of the RGB in three globular clusters at different metalicities (NGC 6397, NGC 6752, and 47 Tuc). These data have been obtained at the VLT in the framework of the ESO-Large Programme “Distances, Ages, and Metal Abundances in Globular Clusters”, using the high-resolution echelle spectrograph UVES. All the observed stars are fainter than in magnitude. These are the first results concerning neutron-capture elements in these scarcely evolved stars.
We have used our data to test several scenarios proposed for the formation of globular clusters in the Galaxy. From this analysis, we conclude that the “classical” self-enrichment scenario as it was proposed e.g. by Truran et al. (1991), cannot explain the observed abundances of neutron-capture elements. More elaborate models (e.g. Thoul et al. 2002; Beasley et al. 2003) still have difficulties in explaining these abundance ratios. However, our main results (Paper I, and this work) can be summarized as follows:
-
1.
Globular clusters do not seem to show any clear correlation or anticorrelation in the abundance patterns of the neutron-capture elements or between heavy elements and light metals.
-
2.
Almost all globular clusters are very homogeneous in the abundances of heavy elements, independent of the evolutionary phase of the observed globular cluster stars.
-
3.
The heavy element abundance patterns, and the [Ba/Eu] and [Sr/Ba] ratios, indicate clearly a progressive chemical enrichment in –process elements with increasing metallicity for all globular clusters.
Considering these results, if a self-pollution scenario is assumed to explain the huge dispersions observed in the light metals (Ventura et al. 2001; D’Antona et al. 2002), we could conclude that the contaminating stars should not be able to produce sufficient amounts of –process elements to yield a clear, visible, correlation between these “abundance anomalies” and the neutron-capture elements in globular clusters.
There are still only very few observations of very faint stars in globular clusters, so that many points still require stronger supportive evidence. Further observations in other clusters are needed, e.g. to confirm: (1) the homogeneity in the abundances of neutron-capture elements at different evolutionary phases, from the main sequence to the top of the giant branch; (2) if the existing dispersion in the [Ba/Eu] ratio among the most metal-poor () clusters is real. More modelling is also needed, not only to explain the formation of the clusters, or the strong dispersion observed in the light metals, but also including predictions on the neutron-capture elements.
Acknowledgements.
The authors would like to thank the referee, J. Cohen (California Institute of Technology, USA), for her comments. A part of this work was done while G.J. and P.F. were visiting the Sophia University and the National Astronomical Observatory in Tokyo, Japan. S. Wanajo, Y. Ishimaru, W. Aoki and S. Honda are warmly thanked for the many very helpful discussions. G.J. would also like to thank R. Cayrel (Obs. de Paris, France) for his advice.References
- Arlandini et al. (1999) Arlandini, C., Käppeler, F., Wisshak, K., Gallino, R., Lugaro, M., Busso, M., & Straniero, O. 1999, ApJ, 525, 886
- Armosky et al. (1994) Armosky, B. J., Sneden, C., Langer, G. E., & Kraft, R. P. 1994, AJ, 108, 1364
- Beasley et al. (2003) Beasley, M. A., Kawata, D., Pearce, F. R., Forbes, D. A., & Gibson, B. K. 2003, ApJ, 596, L187
- Bonifacio et al. (2002) Bonifacio, P., Pasquini, L., Spite, F., Bragaglia, A., Carretta, E., Castellani, V., Centuri n, M., Chieffi, A., Claudi, R., Clementini, G., D’Antona, F., Desidera, S., François, P., Gratton, R. G., Grundahl, F., James, G., Lucatello, S., Sneden, C., & Straniero, O. 2002, A&A, 390, 91
- Burris et al. (2000) Burris, D. L., Pilachowski, C. A., Armandroff, T. E., Sneden, C., Cowan, J. J., & Roe, H. 2000, ApJ, 544, 302
- Busso et al. (1999) Busso, M., Gallino, R., & Wasserburg, G. J. 1999, ARA&A, 37, 239
- Carretta et al. (2004) Carretta, E., Gratton, R. G., Bragaglia, A., Bonifacio, P., & Pasquini, L. 2004, A&A, 416, 925
- Castilho et al. (2000) Castilho, B. V., Pasquini, L., Allen, D. M., Barbuy, B., & Molaro, P. 2000, A&A, 361, 92
- Cayrel (1986) Cayrel, R. 1986, A&A, 168, 81
- Charbonneau (1995) Charbonneau, P. 1995, ApJS, 101, 309
- Christlieb et al. (2004) Christlieb, N., Gustafsson, B., Korn, A. J., Barklem, P. S., Beers, T. C., Bessell, M. S., Karlsson, T., & Mizuno-Wiedner, M. 2004, ApJ, 603, 708
- Cottrell & Da Costa (1981) Cottrell, P. L. & Da Costa, G. S. 1981, ApJ, 245, L79
- Cowan & Sneden (2004) Cowan, J. J. & Sneden, C. 2004, Origin and Evolution of the Elements, 27
- D’Antona et al. (2002) D’Antona, F., Caloi, V., Montalbán, J., Ventura, P., & Gratton, R. 2002, A&A, 395, 69
- Dickens & Bell (1976) Dickens, R. J. & Bell, R. A. 1976, ApJ, 207, 506
- Edvardsson et al. (1993) Edvardsson, B., Andersen, J., Gustafsson, B., Lambert, D. L., Nissen, P. E., & Tomkin, J. 1993, A&A, 275, 101
- Edvardsson et al. (1994) Edvardsson, B., Gustafsson, B., Johansson, S. G., Kiselman, D., Lambert, D. L., Nissen, P. E., & Gilmore, G. 1994, A&A, 290, 176
- Fenner et al. (2004) Fenner, Y., Campbell, S., Karakas, A. I., Lattanzio, J. C., & Gibson, B. K. 2004, accepted for publication in MNRAS (astro-ph/0406360)
- François (1991) François, P. 1991, A&A, 247, 56
- François et al. (2003) François, P., Depagne, E., Hill, V., Spite, M., Spite, F., Plez, B., Beers, T. C., Barbuy, B., Cayrel, R., Andersen, J., Bonifacio, P., Molaro, P., Nordström, B., & Primas, F. 2003, A&A, 403, 1105
- Fulbright (2000) Fulbright, J. P. 2000, AJ, 120, 1841
- Fulbright (2002) Fulbright, J. P. 2002, AJ, 123, 404
- Gilroy et al. (1988) Gilroy, K. K., Sneden, C., Pilachowski, C. A., & Cowan, J. J. 1988, ApJ, 327, 298
- Gratton (1993) Gratton, R. G. 1993, ASP Conf. Ser. 48: The Globular Cluster-Galaxy Connection, 246
- Gratton & Sneden (1994) Gratton, R. G. & Sneden, C. 1994, A&A, 287, 927
- Gratton et al. (2000) Gratton, R. G., Sneden, C., Carretta, E., & Bragaglia, A. 2000, A&A, 354, 169
- Gratton et al. (2001) Gratton, R. G., Bonifacio, P., Bragaglia, A., Carretta, E., Castellani, V., Centurion, M., Chieffi, A., Claudi, R., Clementini, G., D’Antona, F., Desidera, S., François, P., Grundahl, F., Lucatello, S., Molaro, P., Pasquini, L., Sneden, C., Spite, F., & Straniero, O. 2001, A&A, 369, 87
- Gratton et al. (2003a) Gratton, R. G., Carretta, E., Claudi, R., Lucatello, S., & Barbieri, M. 2003a, A&A, 404, 187
- Gratton et al. (2003b) Gratton, R. G., Carretta, E., Desidera, S., Lucatello, S., Mazzei, P., & Barbieri, M. 2003b, A&A, 406, 131
- Gratton et al. (2003c) Gratton, R. G., Bragaglia, A., Carretta, E., Clementini, G., Desidera, S., Grundahl, F., & Lucatello, S. 2003c, A&A, 408, 529
- Gratton (2004) Gratton, R. G. 2004, Memorie della Societa Astronomica Italiana, 75, 274
- Grevesse & Sauval (2000) Grevesse, N. & Sauval, A. J. 2000, Origin of Elements in the Solar System, Implications of Post-1957 Observations, 261
- Gustafsson et al. (1975) Gustafsson, B., Bell, R. A., Eriksson, K., & Nordlund, A. 1975, A&A, 42, 407
- Hill et al. (2002) Hill, V., Plez, B., Cayrel, R., Beers, T. C., Nordström, B, Andersen, J., Spite, M., Spite, F., Barbuy, B., Bonifacio, P., Depagne, E., François, P., & Primas, F. 2002, A&A, 387, 560
- Honda et al. (2004) Honda, S., Aoki, W., Kajino, T., Ando, H., Beers, T. C., Izumiura, H., Sadakane, K., & Takada-Hidai, M. 2004, ApJ, 607, 474
- Ivans et al. (1999) Ivans, I. I., Sneden, C., Kraft, R. P., Suntzeff, N. B., Smith, V. V., Langer, G. E., & Fulbright, J. P. 1999, AJ, 118, 1273
- Ivans et al. (2001) Ivans, I. I., Kraft, R. P., Sneden, C., Smith, G. H., Rich, R. M., & Shetrone, M. 2001, AJ, 122, 1438
- James et al. (2004) James, G., François, P., Bonifacio, P., Bragaglia, A., Carretta, E., Centurión, M., Clementini, G., Desidera, S., Gratton, R. G., Grundahl, F., Lucatello, S., Molaro, P., Pasquini, L., Sneden, C., & Spite, F. 2004, A&A, 414, 1071
- Johnson & Bolte (2002) Johnson, J. A. & Bolte, M. 2002, ApJ, 579, 616
- Kraft (1994) Kraft, R. P. 1994, PASP, 106, 553
- Lawler et al. (2001) Lawler, J. E., Wickliffe, M. E., den Hartog, E. A., & Sneden, C. 2001, ApJ, 563, 1075
- Lee & Carney (2002) Lee, J. & Carney, B. W. 2002, AJ, 124, 1511
- Mallia (1977) Mallia, E. A. 1977, A&A, 60, 195
- Mashonkina et al. (1999) Mashonkina, L., Gehren, T., & Bikmaev, I. 1999, A&A, 343, 519
- Mashonkina & Gehren (2000) Mashonkina, L. & Gehren, T. 2000, A&A, 364, 249
- Mashonkina & Gehren (2001) Mashonkina, L. & Gehren, T. 2001, A&A, 376, 232
- Mashonkina et al. (2003) Mashonkina, L., Gehren, T., Travaglio, C., & Borkova, T. 2003, A&A, 397, 275
- McWilliam et al. (1995) McWilliam, A., Preston, G. W., Sneden, C., & Searle, L. 1995, AJ, 109, 2757
- McWilliam (1998) McWilliam, A. 1998, AJ, 115, 1640
- Norris et al. (1981) Norris, J., Cottrell, P. L., Freeman, K. C., & Da Costa, G. S. 1981, ApJ, 244, 205
- Norris & Da Costa (1995) Norris, J. E. & Da Costa, G. S. 1995, ApJ, 447, 680
- Osborn (1971) Osborn, W. 1971, The Observatory, 91, 223
- Parmentier et al. (1999) Parmentier, G., Jehin, E., Magain, P., Neuforge, C., Noels, A., & Thoul, A. A. 1999, A&A, 352, 138
- Qian & Wasserburg (2000) Qian, Y.-Z. & Wasserburg, G. J. 2000, Phys. Rep, 333, 77
- Ramírez & Cohen (2003) Ramírez, S. V. & Cohen, J. G. 2003, AJ, 125, 224
- Ryan et al. (1991) Ryan, S. G., Norris, J. E., & Bessell, M. S. 1991, AJ, 102, 303
- Ryan et al. (1996) Ryan, S. G., Norris, J. E., & Beers, T. C. 1996, ApJ, 471, 254
- Shetrone (1996) Shetrone, M. D. 1996, AJ, 112, 1517
- Shetrone & Keane (2000) Shetrone, M. D. & Keane, M. J. 2000, AJ, 119, 840
- Sneden et al. (1997) Sneden, C., Kraft, R. P., Shetrone, M. D., Smith, G. H., Langer, G. E., & Prosser, C. F. 1997, AJ, 114, 1964
- Sneden et al. (2000) Sneden, C., Pilachowski, C. A., & Kraft, R. P. 2000, AJ, 120, 1351
- Sneden et al. (2003) Sneden, C., Cowan, J. J., Lawler, J. E., Ivans, I. I., Burles, S., Beers, T. C., Primas, F., Hill, V., Truran, J. W., Fuller, G. M., Pfeiffer, B., & Kratz, K. 2003, ApJ, 591, 936
- Sneden et al. (2004) Sneden, C., Kraft, R. P., Guhathakurta, P., Peterson, R. C., & Fulbright, J. P. 2004, AJ, 127, 2162
- Spite (1967) Spite, M. 1967, Annales d’Astrophysique, 30, 211
- Spite & Spite (1978) Spite, M. & Spite, F. 1978, A&A, 67, 23
- Thoul et al. (2002) Thoul, A., Jorissen, A., Goriely, S., Jehin, E., Magain, P., Noels, A., & Parmentier, G. 2002, A&A, 383, 491
- Travaglio et al. (2004) Travaglio, C., Gallino, R., Arnone, E., Cowan, J., Jordan, F., & Sneden, C. 2004, ApJ, 601, 864
- Truran (1981) Truran, J. W. 1981, A&A, 97, 391
- Truran (1988) Truran, J. W. 1988, IAU Symp. 132: The Impact of Very High S/N Spectroscopy on Stellar Physics, 132, 577
- Truran et al. (1991) Truran, J. W., Brown, J., & Burkert, A. 1991, ASP Conf. Ser. 13: The Formation and Evolution of Star Clusters, 78
- Truran et al. (2002) Truran, J. W., Cowan, J. J., Pilachowski, C. A., & Sneden, C. 2002, PASP, 114, 1293
- Ventura et al. (2001) Ventura, P., D’Antona, F., Mazzitelli, I., & Gratton, R. 2001, ApJ, 550, L65
- Wallerstein et al. (1963) Wallerstein, G., Greenstein, J. L., Parker, R., Helfer, H. L., & Aller, L. H. 1963, ApJ, 137, 280
- Wanajo et al. (2003) Wanajo, S., Tamamura, M., Itoh, N., Nomoto, K., Ishimaru, Y., Beers, T. C., & Nozawa, S. 2003, ApJ, 593, 968