GMC Formation in M33: the Role of Pressure
Abstract
We present a complete map of the Giant Molecular Clouds in M33 and show that they lie exclusively on filaments of HI. The GMCs are localized on the extended HI filaments, and HI filaments extend well beyond the radius where the GMCs are found, suggesting that the H2 forms from the HI and not vice-versa. We propose that the fraction of neutral gas that is molecular at a particular radius is determined primarily by the ambient hydrostatic pressure at that radius. This leads to a prediction that the transition radius, the radius where the mean surface density of HI and H2 are equal, occurs at a constant value of the stellar surface density. We show that for a sample of 26 galaxies, the stellar surface density at the transition radius is constant to 40%.
Radio Astronomy Laboratory, University of California, Berkeley, 94720
1. Introduction
The star formation history of galaxies is determined by how Giant Molecular Clouds form. Stars are known to form only in molecular clouds; it is only in molecular clouds that gas temperatures are low enough and gas densities are high enough that the Jeans mass is in the range of individual stellar masses. Nevertheless, GMC formation is poorly understood. A number of different formation mechanisms have been proposed, but there is no agreement on which mechanism dominates. It is not yet possible, for example, to predict which galaxies will be molecule rich, and what the distribution of molecular gas will be. This shortcoming makes the goal of understanding the star formation history of the Universe elusive at the present time.
One approach in narrowing the range of possible formation mechanisms is to observe individual molecular clouds in other galaxies. By determining molecular cloud properties over a large range of ambient conditions, both within a given galaxy and from galay-to-galaxy, it may be possible to see how the cloud properties change with the physical environment. Ideally, one would like to have a complete catalogue of GMCs for an entire galaxy. With present-day instruments, this is possible only within the Local Group and requires large blocks of observing time.
So far, only five galaxies have been surveyed with high enough resolution to catalogue individual GMCs. In the Milky Way, although the entire disk has been surveyed for CO, it has not been possible to get a complete catalogue of individual GMCs because CO line blending in particular directions (e.g. the tangent points) makes it impossible to untangle individual GMCs from one another. M31 (e.g. Muller & Guélin 2003) presents a similar problem because of its high inclination, though the problem is not quite as severe as it is in the Milky Way. Fukui et al. (2001) succeeded in making a complete survey of GMCs in the LMC, the first such survey in any galaxy. Engargiola et al. (2003; hereafter EPRB03) have made a complete survey of GMCs in M33, the first such survey in a spiral galaxy; both surveys have comparable linear resolution. A complete survey of GMCs has also been made in IC 10, but is as yet unpublished (Leroy et al., in preparation). Complete, published GMC catalogs are thus available for only two galaxies. In this paper, we describe some of the results of the EPRB03 survey of M33 and examine the implications for GMC formation.
2. The M33 Map
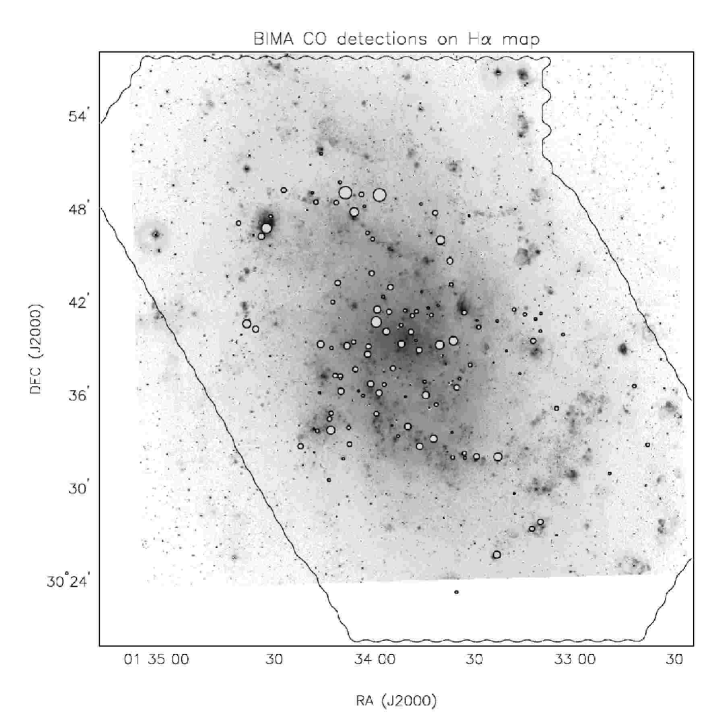
Figure 1 shows an H image of M33 by Cheng et al. (1996). Also shown are the GMCs detected in the J = 1-0 transition of CO with the BIMA Array by EPRB03. The CO map is a mosaic of 759 pointing centers and covers about 0.25 deg2. The angular resolution of each pointing center is 13′′, which corresponds to a linear resolution of 54 pc at the 850 kpc distance of M33. A resolution of at least 50 pc is desirable for GMC surveys because it minimizes source confusion within the beam and makes direct comparison between galaxies relatively straightforward: 50 pc is roughly the mean diameter of GMCs in the Milky Way (e.g. Blitz 1993). The total integration time was about 15 minutes per pointing center, leading to an rms noise of less than 0.5 Jy beam-1 in the central half of the mosaic. Although some clouds are detected with masses as low as 4 , the catalogue of GMCs is complete to a mass of 1.5 .
We find a steep mass function: , significantly different from the mass function found in the Milky Way, which has a power law index of -1.6 (e.g. Blitz 1993). To highlight this difference we note that the Milky Way is estimated to have more than 100 GMCs with 1.8 (Dame et al. 1986); the highest mass GMC in M33 has a mass of only 7 . M33 has about 20% of the mass of the Milky Way, and about 5% of its H2 mass. If the M33 mass function were the same as that in the Milky Way, we would expect 9 GMCs with a mass greater than 7 scaling by the relative H2 mass; none is observed. The difference in the mass functions between the two galaxies thus appears to be quite significant. Nevertheless, the properties of the individual GMCs appear to be quite similar in the two galaxies (Rosolowsky et al. 2003).
Unlike the Milky Way, the steep mass function for M33 suggests that most of the molecular mass is at the low mass end of the spectrum. However, a finite molecular mass for M33 requires that there be a “turnover” mass where the power law index of the mass function becomes shallower than -2. EPRB03 show that this mass is 4–7 . This turnover mass is where most of the mass in GMCs in M33 resides, and can be considered to be a characteristic mass of the GMCs in this galaxy.
3. Comparison with HI
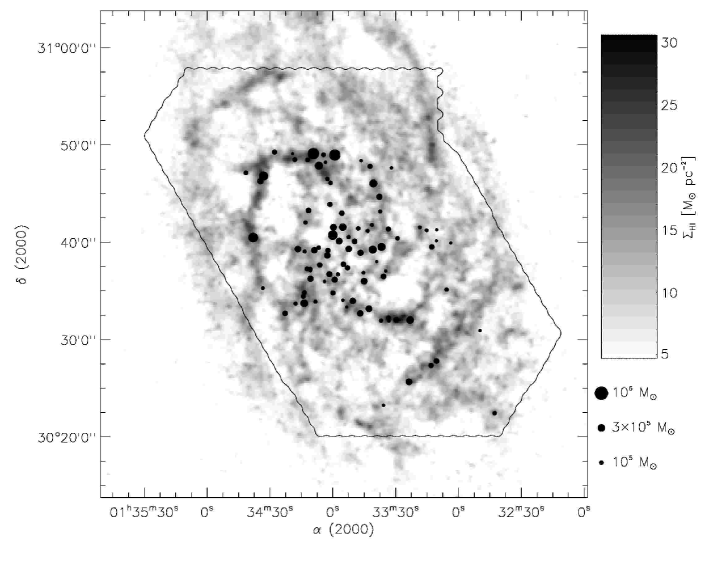
Figure 2 is a map of the GMCs in M33 overlaid on the HI map of Deul & van der Hulst (1987). The HI is largely arranged in long, stringy filaments. Remarkably, the GMCs are found only on the filaments. Because the filaments extend far beyond the radius where the GMCs are detected and because the CO is far more localized than the filaments, any causal relationship between the two gas phases implies that the molecular gas formed from the HI.
The close association between the GMCs and the HI filaments can be used to set an upper limit on the GMC lifetimes. The rms difference between the CO and HI velocity centroids is 8 km s-1 and the typical width of an HI filament is 200 pc. If the cloud lifetimes were significantly longer than 20 Myr, the clouds would drift off the filaments, destroying the good observed correlation.
The GMCs are closely associated with the large, bright HII regions as can be seen in Figure 1. The GMCs shown in Figure 1 contribute 36% of the total flux in the galaxy. These clouds are contiguous with HII regions that contribute 36% of the total H flux (EPRB03). Thus the two distributions are consistent with essentially all of the emission from HII regions being associated with GMCs.
The larger filaments often look as if they form the boundaries of holes, raising the question: are the filaments actually the edges of shells produced by energetic activity at their centers? The “holes” in M33 have been catalogued by Deul & den Hartog (1990) who find that small holes 200 pc in diameter are statistically correlated with OB associations. These may have been evacuated by the effects of stellar winds and supernova explosions. The large holes evident in Figure 2, have diameters of 500 – 1000 pc, and require energies of ergs. Their lifetimes are 3 y because they have not yet been sheared out by the differential rotation of the galaxy. If these holes have been evacuated by the effects of star formation, there would be bright remnant stellar clusters at the center of each feature, and these are not seen. The filaments therefore do not appear to have been produced by central explosions or winds, but are generated by some mechanism related either to spiral structure formation, or to some other gas dynamical instability.
At all radii the azimuthally averaged atomic surface gas density is greater than that of the H2 surface density; near the center, the ratio is about 5 and increases with increasing radius. That is, the surface density of HI is nearly constant with radius, but that of the CO decreases exponentially from the center with a scale length comparable to the stellar scale length (EPRB03). The HI extends to at least twice the radius where detectable molecular clouds are found.
It thus appears as if the filaments form first and they gather enough gas together in one place to form the star-forming GMCs. But there is little radial variation in the surface density of HI. It is apparent in Figure 1 that although the surface density in the HI filaments in the outer half of M33 is similar to that in the inner part of the galaxy, the outer galaxy filaments are nearly devoid of GMCs. Furthermore, the surface density along the filaments and from filament to filament anywhere in the galaxy is also fairly constant. Why then does the molecular gas in the galaxy show such a strong radial dependence?
4. The Role of Pressure
Several authors have suggested that hydrostatic gas pressure determines the molecular fraction at a given radius in a galaxy. Spergel & Blitz (1992), for example, argued that the extraordinarily large molecular gas fraction at the center of the Milky Way is plausibly the result of the very high hydrostatic pressure in the Galactic bulge. Elmegreen (1993) suggested on theoretical grounds that the ratio of atomic to molecular gas in galactic disks results from both the ambient hydrostatic pressure as well as the mean radiation field. The dependence on the pressure is steeper than that of the radiation density (), and ought to be the dominating factor. Observationally, Wong and Blitz (2002) showed that the radial dependence of the atomic to molecular gas ratio in seven molecule rich galactic disks can be understood to be the result of the variation of interstellar hydrostatic pressure (with ).
Using this as an operating hypothesis, let us assume that , the ratio of H2 surface density to HI surface density, is determined only by hydrostatic pressure, . In a thin disk with isothermal stellar and gas layers, and where the gas scale height is much less than the stellar scale height as is typical in disk galaxies,
| (1) |
where is the total surface density of the gas, is the velocity dispersion of the gas, is the midplane suface density of stars, and is the midplane suface density of gas. In most galaxy disks, is much larger than , except in the far outer parts of a galaxy where the stars become quite rare. In the solar vicinity, for example, = 0.1 M pc-3, but 0.02 M pc-3 (e.g. Dame 1993). For a self-gravitating stellar disk, , where is the stellar scale height. Thus, neglecting , Equation 1 becomes:
| (2) |
There is ample evidence that both and are both constant with radius in disk galaxies. Evidence that is approximately constant comes from observations of edge-on galaxies by van der Kruit and Searle (1981a,b; 1982a,b). Measurements of the HI velocity dispersion in face-on galaxies indicate that is approximately constant with radius (van der Kruit and Shostak 1982, 1984; Shostak and van der Kruit 1984).
By assumption,
| (3) |
Thus, since is approximately constant within a galaxy, then
| (4) |
Wong and Blitz (2002) show that for a number of gas-rich spiral galaxies, the N(HI) is nearly constant and saturates at a value of about 6 cm-2, or about 3 magnitude of visual extinction, as is true for M33. Thus, the location in a galaxy where is unity, what we call the transition radius, occurs at a fixed value of . This, in turn, implies that the transition radius depends only on . If determines , then should be constant for all galaxies.
We investigate this prediction by determing the transition radius in 19 galaxies for which there is sufficient data from both CO and HI maps to determine the location of the transition radius. We then use the 2MASS data to determine the -band surface density at the transition radius, and convert to stellar surface density using a mass-to-light ratio of 0.5 M. The results are shown in Figure 3.

Figure 3 shows a remarkable constancy of , with a mean value of 100 40 M pc-2. This constancy is particularly noteworthy because the range of stellar surface density is about 100 for these galaxies, and the range of transition radii varies by a factor of 10.
As a check, one can calculate the value of at the transition radius in the Milky Way, scaling the measured at the distance of the Sun (35 M pc-2 - Binney & Merrifield 1998), and a radial scale length for the stars of 3 kpc (Spergel, Malhotra & Blitz 1996; Dehnen & Binney 1998). The transition radius for the Milky Way occurs at a galactocentric distance of about 4 kpc (Dame et al. 1993), or about 1.3 scale lengths inward of the Sun. This converts to a stellar surface density of 132 M pc-2, in good agreement with the measurements in other galaxies.
These arguments suggest that hydrostatic pressure may be the dominant factor in determining how much atomic gas is converted to molecular gas, on average, at a given radius. Taken together with the gas distribution in M33, the following picture emerges. First, various hydrodynamic and gravitational processes collect the gas in a disk galaxy into filaments. Some fraction of the gas gathered together into filaments is turned into molecular gas. How much depends on radius because of the monotonic, large-scale decrease in hydrostatic pressure with radius. In a galaxy like M33, with a low central surface density, the gas may remain predominantly atomic throughout. However, in galaxies with prominent bulges and with high central stellar surface densities, an overwhelmingly large fraction of the gas may become molecular. This may explain, for example, why the molecular-to-atomic gas ratio in the center of the Milky Way is as high as , and why other bright galaxies have such large, extended regions where the molecular gas is the dominant phase of the ISM.
If hydrostatic pressure is the primary factor in determing the surface density of molecular gas within galaxies, it brings us closer, but not all the way to understanding how GMCs form. One still needs to understand why the gas forms into individual clouds, why they have the masses that they do, and why their mass functions are different in different galaxies.
References
- Binney & Merrifield (1998) Binney, J. & Merrifield, M. 1998, Galactic astronomy / James Binney and Michael Merrifield. Princeton, NJ : Princeton University Press, 1998. (Princeton series in astrophysics) QB857 .B522 1998
- Blitz (1993) Blitz, L. 1993, Protostars and Planets III, 125
- Cheng et al. (1996) Cheng, K.P., Hintzen, P., Smith, E.P., Angione, R., Talbert, F., Collins, N., Stecher, T. 1996, BAAS, 28, 904
- Dame, Elmegreen, Cohen, &Thaddeus (1986) Dame, T. M., Elmegreen, B. G., Cohen, R. S., & Thaddeus, P. 1986, ApJ, 305, 892
- Dame (1993) Dame, T. M. 1993, AIP Conf. Proc. 278: Back to the Galaxy, 278, 267
- Dehnen & Binney (1998) Dehnen, W. & Binney, J. 1998, MNRAS, 294, 429
- Deul & den Hartog (1990) Deul, E. R. & den Hartog, R. H. 1990, A&A, 229, 362
- Deul & van der Hulst (1987) Deul, E. R., & van der Hulst, J. M. 1987, A&AS, 67, 509
- Elmegreen (1993) Elmegreen, B. G. 1993, ApJ, 411, 170
- Engargiola et al. (2003) Engargiola, G., Plambeck, R., Rosolowsky, E., & Blitz , L. 2003 ApJS, 149,343
- Fukui et al. (2001) Fukui, Y., Mizuno, N., Yamaguchi, R., Mizuno, A., & Onishi, T. 2001, PASJ, 53, L41
- van der Kruit & Searle (1981a) van der Kruit, P. C. & Searle, L. 1981a, A&A, 95, 105
- van der Kruit & Searle (1981b) van der Kruit, P. C. & Searle, L. 1981b, A&A, 95, 116
- van der Kruit & Searle (1982a) van der Kruit, P. C. & Searle, L. 1982a, A&A, 110, 61
- van der Kruit & Searle (1982b) van der Kruit, P. C. & Searle, L. 1982b, A&A, 110, 79
- van der Kruit & Shostak (1982) van der Kruit, P. C. & Shostak, G. S. 1982, A&A, 105, 351
- van der Kruit & Shostak (1984) van der Kruit, P. C. & Shostak, G. S. 1984, A&A, 134, 258
- Muller & Guélin (2003) Muller, S. & Guélin, M. 2003, SF2A-2003: Semaine de l’Astrophysique Francaise
- Rosolowsky, Engargiola, Plambeck, & Blitz (2003) Rosolowsky, E., Engargiola, G., Plambeck, R., & Blitz, L. 2003, ApJ, 599, 25
- Shostak & van der Kruit (1984) Shostak, G. S. & van der Kruit, P. C. 1984, A&A, 132, 20
- Spergel & Blitz (1992) Spergel, D. N. & Blitz, L. 1992, Nat, 357, 665
- Spergel, Malhotra, & Blitz (1996) Spergel, D. N., Malhotra, S., & Blitz, L. 1996, Spiral Galaxies in the Near-IR, Proceedings of the ESO/MPA Workshop Held at Garching, Germany, 7-9 June 1995 edited by Dante Minniti and Hans-Walter Rix. Springer-Verlag Berlin Heidelberg New York. p.128, 128
- Wong & Blitz (2002) Wong, T. & Blitz, L. 2002, ApJ, 569, 157