The 2MASS-selected Flat Galaxy Catalog
Abstract. An all-sky catalog of 18020 disc-like galaxies is presented. The galaxies are selected from the Extended Source Catalog of the Two Micron All-Sky Survey (XSC 2MASS) basing on their 2MASS axial ratio . The Catalog contains data on magnitudes of a galaxy in the J, H, Ks bands, its axial ratio, positional angle, index of luminosity concentration, as well as identification of the galaxy with the LEDA and the NED databases. Unlike the available optical catalogs, the new 2MFGC catalog seems to be more suitable to study cosmic streaming on a scale of . The dipole moment of distribution of the bright (K) 2MFGC objects ( or ) lies within statistical errors () in the direction of the IRAS dipole and the optical RFGC dipole.
Key words: catalogs: galaxies – galaxies: fundamental parameters – infrared:
galaxies
1 Preface
The catalog of flat spiral edge-on galaxies, FGC (Karachentsev et al. 1993), was created as a result of total examination of blue and red prints of the sky surveys POSS-I and ESO/SERC. The catalog is a rather specific sample of 4455 spiral galaxies with a limiting blue diameter and an axial ratio . It consists of two parts: FGC (Flat Galaxy Catalogue) itself, which covers a region , and its southern extension FGCE (Flat Galaxy Catalogue Extension) with . Since the limiting angular diameter in the catalog is smaller than in the catalogs UGC (Nilson 1973) and ESO/Uppsala (Lauberts 1982), then more than half (56 %) of flat galaxies entering into it have been cataloged for the first time.
The axial ratio presented in FGC is actually in RC3 (de Vaucouleurs et al. 1991) and virtually characterizes the relationship between the disc and spherical components in a spiral galaxy viewed edge-on. The condition excludes the majority of early-type spiral galaxies. That is why the average morphological type of the FGC(E) galaxies is between Sc and Scd, and above 75% of the FGC galaxies are spirals of type Sc and later.
As has been shown by Karachentsev et al. (1997), the mean axial ratios of the blue images of the galaxies exceed the corresponding axial ratios on the red prints of both parts of the Catalog. This can readily be explained by that the spherical component of galaxies is redder. When passing to the infrared range, this feature is intensified, which will be discussed in detail in the next section.
The new improved and complemented version of the catalog, RFGC (Revised Flat Galaxy Catalogue — Karachentsev et al. 1999), involves 4236 flat galaxies. The principal changes made in RFGC in comparison with FGC are as follows.
-
•
On the Digital Sky Survey (DSS) the coordinates of all the objects were measured anew with a higher () accuracy.
-
•
The diameters measured on J, R films of the survey ESO/SERC were reduced to the system of diameters POSS-I (which approximately corresponds to the system ) based on the results from Kudrya et al. (1997a). This eliminated the difference in photometric depth between the two parts of the catalog, FGC and FGCE. About 200 galaxies having reduced diameters were not included in RFGC.
-
•
For the RFGC galaxies total apparent magnitudes consistent to an accuracy of with magnitudes of RC3 (de Vaucouleurs et al. 1991) were calculated. Angular diameters, surface brightnesses and other parameters were used in the calculations (Kudrya et al. 1997b).
For the present time RFGC is the deepest morphologically homogeneous sample of the field spiral galaxies. It is mainly intended for studying large-scale flows of galaxies, properties of the structures in discs etc. (Karachentsev 1989; Karachentsev et al. 2000; Bizyaev & Mitronova 2002; Zasov et al. 2002).
2 RFGC galaxies in the survey 2MASS
The Two Micron All-Sky Survey (2MASS) was carried out in three infrared bands: J (1.11–1.36), H (1.50–1.80) and Ks (2.00–2.32 ) with two 1.3 m telescopes in Arizona and Chile, respectively (Skrutskie et al. 1997). Approximately 3 million galaxies brighter K were detected in the 2MASS survey (Jarrett 2000). About 1.65 million galaxies with K and angular dimensions above 7′′ were entered into the 2MASS Extended Sources Catalog XSC (Cutri & Skrutskie 1998). Selection of extended sources and their photometry were performed with using the standard set of algorithms (Jarrett et al. 2000) and the photometric calibration was described in the paper by Nikolaev et al. (2000).
Jarrett (2000) notes that the 2MASS survey has weak sensitivity to late-type galaxies, especially of low surface brightness. The cause lies in high brightness of the night sky in the near-IR range and short exposures (8 s/object). For this reason the periphery of the discs of spiral galaxies is generally unseen on isophotes fainter than K = . This conclusion was corroborated and extended for the sample of RFGC galaxies (Karachentsev et al. 2002). Mutual identification of the objects from RFGC and 2MASS XSC showed that 2996 out of 4236 (i.e. 71%) RFGC galaxies were identified in XSC. The portion of RFGC galaxies in 2MASS decreases
-
•
when passing from bright galaxies to faint ones (100% of detection at and 38% at ),
-
•
from high surface brightness galaxies to galaxies with low surface brightness (89% of detection in RFGC with surface brightness class SB=I and 57% with class SB=IV),
-
•
from early morphological types to later ones (100% of detection for type Sab and 22% for Sm).
A comparison of infrared and optical diameters for nearby large galaxies has shown that 2MASS diameters are typically to 70 % relative to optical measurements, from late to early-type disc spirals, respectively (see Fig. 24 of Jarrett et al. 2003). Likewise, 2MASS diameters of RFGC galaxies are, on average, half as much as standard optical diameters. In the RFGC galaxies the blue axial ratios cover an interval of [7–21] with a median of 8.6, while the respective infrared occupy a range of [1–10] with a median of 4.1. The comparison of infrared and optical characteristics made for the RFGC galaxies resulted in a knowledge what flat spiral galaxies look like in the infrared region.
At the next stage, we applied the data of 2MASS photometry of the RFGC galaxies to calculating parameters of their bulk motion. For the RFGC galaxies with known hydrogen line widths, Tully–Fischer relationships (TF) in B, I, J, H, K bands were derived (Karachentsev et al. 2002). Then, using the J, H, K Tully–Fischer relationships, Kudrya et al. (2003) obtained the absolute value of the bulk velocity and the apex parameters for a sample of 971 RFGC galaxies with radial velocities km s-1: km s-1, , . This is in a good agreement with our previous estimates obtained when using the TF relationship for optical diameters (Karachentsev et al. 2000) and also results of other authors.
Thus, we proved the homogeneity over the sky and the photometric homogeneity of the catalog 2MASS – XSC by the example of the flat galaxies of the catalog RFGC. This induced us to make a more representative and deep catalog of “flattened” galaxies using the data of the infrared catalog 2MASS - XSC.
3 Catalog 2MFGC
3.1 Criterion of selection and catalog characteristic features
Among numerous photometric parameters of galaxies included in XSC (Jarrett et al. 2000) we selected, as reference for the new catalog, a parameter that characterized the ratio of the minor to major axis. It can be expressed as the axial ratio of a galaxy image in each band () and also as the axial ratio for the combined image, (“super” coadd).
From the XSC objects were preliminary selected those whose axial ratio values even in one band or were smaller than or equal to 0.4, which significantly reduced the possibility of missing a disc-like galaxy in the list because of features of photometric processing. The selected objects are present in two lists: the main one (N = 20631), which included galaxies reliably classified in XSC, and the additional one (N = 2199), in which binary and multiple stars, as well as artifacts, could be involved along with galaxies.
Based on the data of Section 2, galaxies with axial ratio in the blue region of the spectrum , will have or in 2MASS. Allowing for the step-type behavior (0.02) of the value in the XSC, we adopted the upper limit of the ratio of the minor-to-major axis to be equal to 0.34 as a criterion of selection of objects for our Catalog.
The following selection criteria were further applied to the objects of these lists:
1) ,
2) , but the axial ratio in each of the bands was less than or equal to 0.34.
Objects for which even one value of equaled 1 and objects without the estimate of the axial ratio were excluded from consideration. The limit was not specified either by the magnitude or by the angular diameter 111Out of 2199 objects of the additional list the criterion was applied only to 508 objects identified in LEDA. Only 131 galaxies of them satisfied criteria 1 and 2.
Finally, 18215 objects from the main list complied with criteria 1 and 2, and 16132 of them were identified in the databases LEDA and/or NED. Here, the radius of the region of identification was chosen to be 1′ for NED, and 0.5′ for LEDA.
When two or more objects fell within the region of identification, their characteristics were visually estimated from the images of the digital sky surveys POSS-II, ESO/SERC and IPAC 2MASS. The Catalog included the objects whose characteristics (position angle, axial ratio, brightness, size) fitted best those presented in XSC.
The same procedure was carried out for single XSC objects which were identified with low (worse than 0.4′) accuracy in LEDA and NED.
Note that when creating any catalog, errors of the Ist and IInd type are bound to arise: I — “true” objects are not included, II — “spurious” objects are included. As applied to our Catalog, these errors manifest themself as follows.
I. In the course of photometric processing the peripheral regions are inadequately allowed for in galaxies with low surface brightness and the object formally “becomes round”. The selection criterion cuts off a certain part of really flattened galaxies thereby strengthening the selection effect already present in the catalog XSC. Besides, the procedure of measuring galaxies with the greatest angular sizes proved to be non-optimal for the determination of their parameters. These galaxies are supposed to be measured in another manner, and they will constitute a separate 2MASS catalog. It will also include flattened galaxies that failed to fall within our Catalog.
II. The photometric procedure fails to distinguish between a single object and cases where a galaxy is in contact with another galaxy or a ster. And, vice versa, a bright detail can be measured separately from the main body of the galaxy.
To diminish the influence of errors of the Ist and IInd type at different stages of compiling the catalog 2MFGC (2MASS Flat Galaxy Catalog) several thousand of galaxy images were revised on the frames of 2MASS. As a result, we included 18020 galaxies in the catalog 2MFGC.
The new catalog 2MFGC comprises 2371 RFGC galaxies, which accounts for 56% of all RFGC galaxies and a total of 13% of the whole number of “flattened” 2MASS galaxies.
In Section 2 we presented 2996 RFGC galaxies (71% of the total number of 4236) identified with XSC. As an additional check showed, 18% out of 2996 galaxies have the axial ratio . Thus, the “loss” of 15% of really flat galaxies may be due to the application of the axial ratio as the criterion of selection of galaxies for the catalog 2MFGC.
Some typical images of the galaxies from the catalog 2MFGC are shown in Fig. 1.
2MFGC 26542dFGRSS320Z078. km/s, mag= (NED), . An example of a distant galaxy.
2MFGC 6265ESO 059-022. km/s, , . A typical example of a moderately distant galaxy.
2MFGC 6271NGC 2470. km/s, , . An example of an early-type spiral galaxy with reliably measured characteristics.
2MFGC 6472. Unidentified in the optical range. . An example of a galaxy of very low surface brightness, possibly, a nearby object.
2MFGC 6562RFGC 1355. , , . A typical flat galaxy, seen at the 2MASS limit.
2MFGC 7000PGC 3085218. , . In the optical range is seen at the limit.
2MFGC 10056RFGC 23673. km/s, , . A typically flat galaxy, equally well visible in the optical and infrared ranges.
2MFGC 13442ESO 179-013. km/s, , . A nearby galaxy of low surface brightness, is seen through the Milky Way.
In the columns of the Catalog we present the following data:
column 1 : 2MFGC galaxy number;
column 2 : Right Ascension and Declination for the epoch J2000.0;
column 3 : -band fiducial elliptical Kron radius in arcsecond;
column 4–6 : -band fiducial elliptical Kron magnitudes;
column 7 : axis ratio (b/a) for the combined image (“super” coadd);
column 8 : axis ratio (b/a) averaged by the individual , and -band images;
column 9 : positional angle in degrees for the “super” coadd image measured towards NE (+) and NW (–);
column 10 : -band concentration index (3/4 vs 1/4 light radii);
column 11 : galaxy number in the LEDA database;
column 12 : distance from the 2MASS center to the LEDA object in arcmin;
column 13 : galaxy name in the NED database;
column 14 : distance from the 2MASS center to the NED object center in arcmin.
Note that 2877 2MFGC galaxies, i.e. 16%, are not presented in the known catalogs.
3.2 Statistics of the main parameters
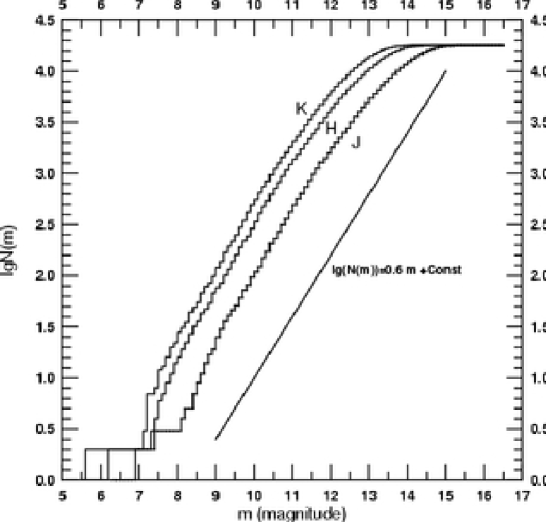
Fig. 2 presents integral distributions of the number of 2MFGC galaxies by apparent magnitudes. The straight line represents homogeneous distribution. As can be seen, the incompleteness of the sample for flattened galaxies becomes noticeable at , that is, at 100% completeness of the catalog XSC up to (Jarrett 2000) about 80% of potential candidates failed to fall within the catalog 2MFGC (see also Table 1). Apparently, when passing to the limit of the 2MASS survey, the galaxies look more round and are cut off by the selection criterion. Note that for the RFGC galaxies 100% completeness is achieved at and drops with the limiting diameter approaching .
Table 1: 2MFGC galaxies with different apparent magnitudes and angular diameter 2r, arcsec J 50–99 100-149 All 9 0 0 2 21 23 9–10 0 2 25 58 85 10–11 0 112 184 85 381 11–12 56 918 292 12 1278 12–13 1180 2387 84 0 3651 13–14 5171 1767 3 0 6941 14–15 4981 212 0 0 5193 332 1 0 0 333 All 11720 5399 590 176 17885 H 9 0 0 14 61 73 9–10 0 48 134 82 264 10–11 22 668 306 33 1029 11–12 738 2123 123 0 2984 12–13 4267 2091 13 0 6371 13–14 5923 474 0 0 6397 14–15 739 5 0 0 744 6 0 0 0 6 All 11695 5409 590 176 17870 K 9 0 2 32 84 118 9–10 0 156 200 79 435 10–11 82 1118 279 13 1492 11–12 1766 2500 76 0 4342 12–13 6140 1493 3 0 7636 13–14 3704 153 0 0 3857 14–15 139 0 0 0 139 1 0 0 0 1 All 11835 5422 590 176 18020
Table 2:Distribution of 2MFGC galaxies according to angular diameters for different axis ratios 2r, arcsec sab 7–49 50–99 100-149 All 1–2.99 199 170 20 10 399 3–4.99 11216 4077 359 109 15761 5–10 417 1175 211 57 1860 1–2.99 4378 421 19 9 4827 3–4.99 7394 4291 386 107 12178 5–10 60 710 185 60 1015 All 11832 5422 590 176 18020
Another cause of omission of a “really flat” galaxy in the Catalog is also possible. By our condition galaxies with were rejected. Thus, the galaxies that look in the B band like Sc–Sd with a spherical high contrast nucleus and a very faint disc component look in the 2MASS survey like compact round objects and are discarded by the selection criterion.
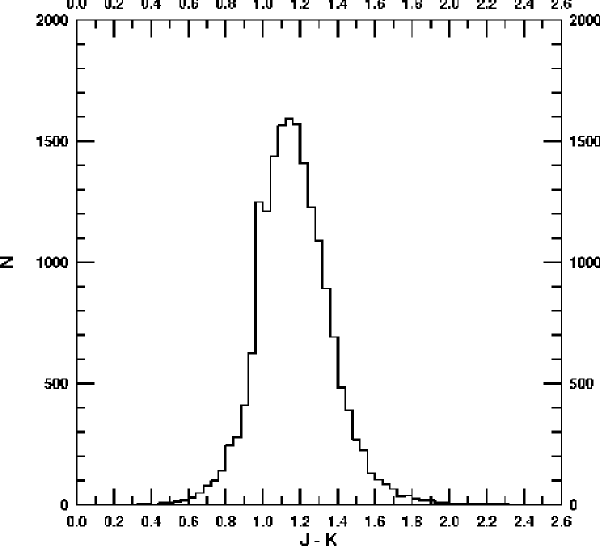
In Fig. 3 is present the distribution of 17885 2MFGC galaxies versus their color . It looks quiet symmetric, with an average color and . This value is actually coincident with the mean value of the color , obtained for the RFGC galaxies identified with XSC (Karachentsev et al. 2002). About 70% of the 2MFGC galaxies have the color in a narrow interval, .
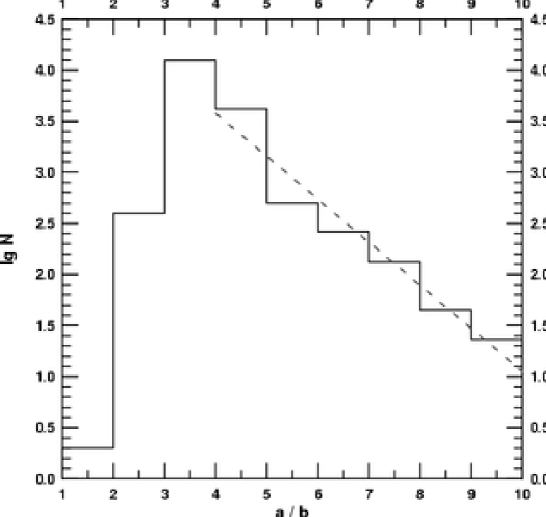
The distribution of the 2MASS galaxies over the inverse axial ratio (Fig. 4) shows that with a sufficiently wide range of axial ratios the greater part (80%) of our galaxies have . The median value , which is close to the value for the RFGC galaxies identified in XSC.
In the interval of from 4.5 to 10 an exponential relationship is satisfied. In Fig. 4 there present nearly round galaxies, although, according to the criterion of selection, objects with were excluded. This effect takes place in adding up and images of galaxies, when the elliptical isophotes describing circumnuclear region are added together as averaged at different position angles (PA) and produce practically round images.
Table 2 gives the distribution of the numbers of the 2MFGC galaxies according to angular dimensions depending on the fact which way of calculating the axial ratios is adopted when selecting galaxies for the Catalog. With a “soft” criterion ) the number of nearly round galaxies that may be entered into the Catalog is by a factor of 12 larger than with a “hard” criterion . As it was to be expected this effect is most pronounced for the smallest ) galaxies.
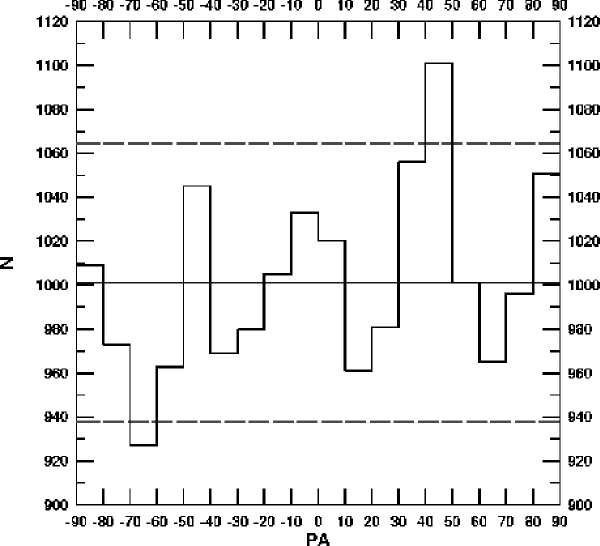
The distribution of the 2MFGC galaxies by near-infrared (NIR) position angles (PA) is shown in Fig. 5. The mean number of galaxies per interval is 1002 with the standard deviation of 31.6. The maxima and minima in the distributions are insignificant. Only one value of 18 is beyond the range at the PA from +40∘ to . Note that the position angle is the least accurately determined parameter presented in the Catalog. Comparison of the PA that we determined visually from 2MASS images with the PA presented in XSC for a considerable share of galaxies shows a large (to tens of degrees) deviations. Rahman & Shandarin (2003) write about the “twisting” PA too. The position angles given in XSC most likely refer to the circumnuclear region (bulge) than to galaxies as a whole, as in RFGC.
3.3 Some two-dimensional distributions
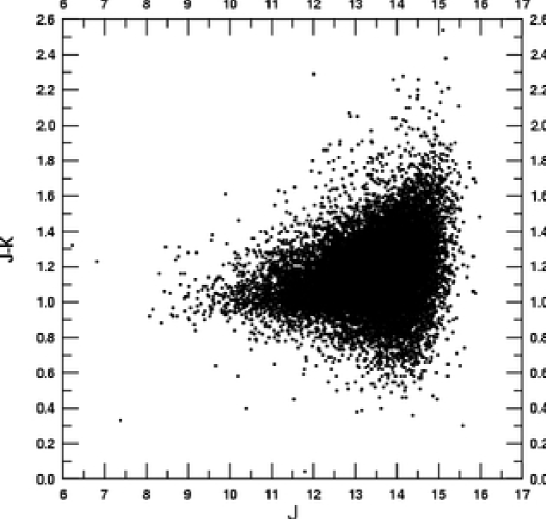
It can be seen in Fig. 6 that the average color for the 2MASS galaxies with passing from bright to faint objects changes only slightly (from 10 to 13), however the scatter in largely increases for . Nevertheless, the average color of bright galaxies is bluer than that of faint ones. This can be explained by the fact that, firstly, for bright galaxies the greater portion of the disc component is involved in photometrying in comparison with faint galaxies, and, secondly, faint galaxies are situated at larger distances, where the K correction plays an important role.
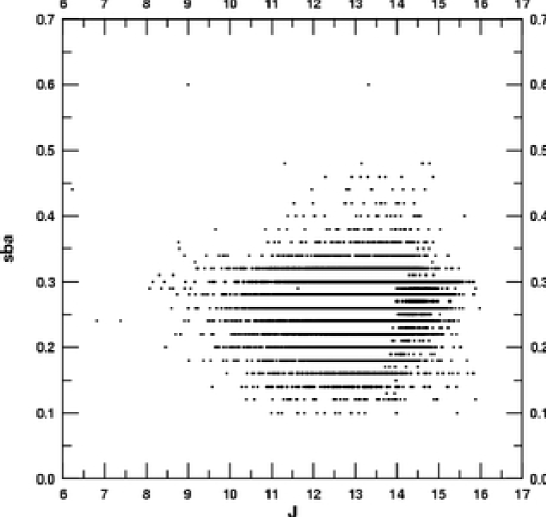
The axial ratio measured in XSC changes slightly for both bright and faint 2MFGC galaxies (Fig. 7). Note that our criterion of selection excluded the brightest and round objects, which is indicated by the “shortage” of points in the upper left corner of Fig. 7.
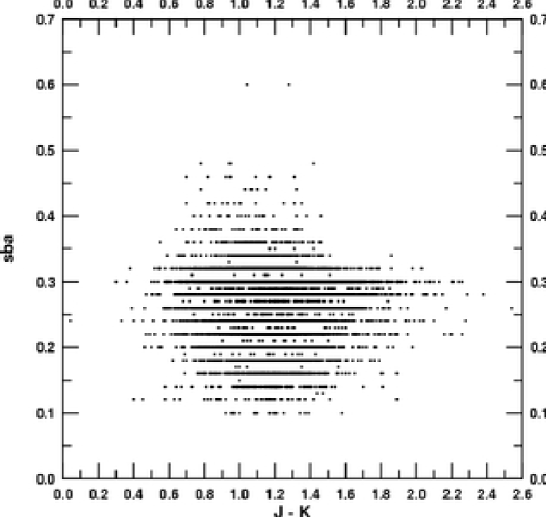
The axial ratios measured for galaxies with different colors change as slightly (Fig. 8). Note the shortage of points among the reddest and round galaxies.
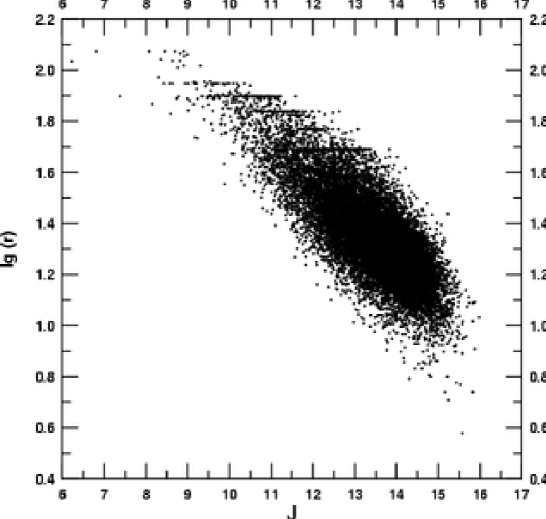
Fig. 9 shows the relationship of vs . Beginning with , it is seen that the galaxy sizes are systematically underestimated for the brightest 2MASS objects. This is connected both with the nature of objects selected for 2MFGC (late spirals have an extended blue disc component poorly visible in the IR range) and, possibly, with characteristics of the digital processing of extended objects.
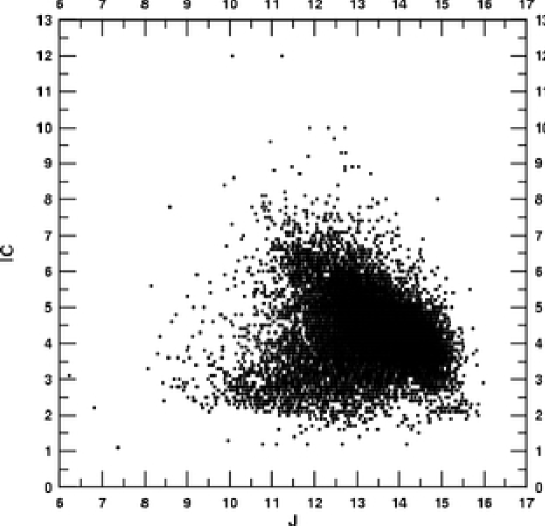
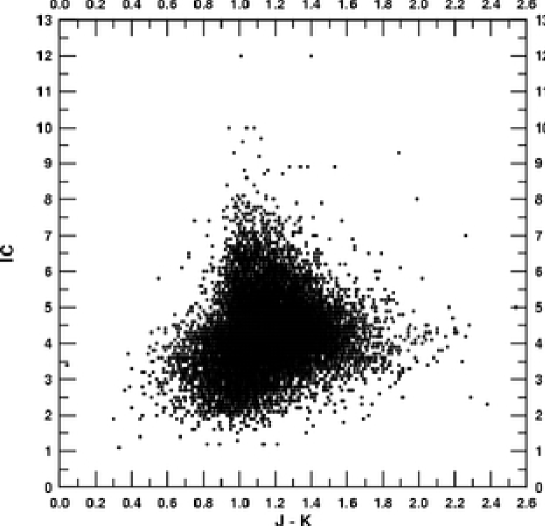
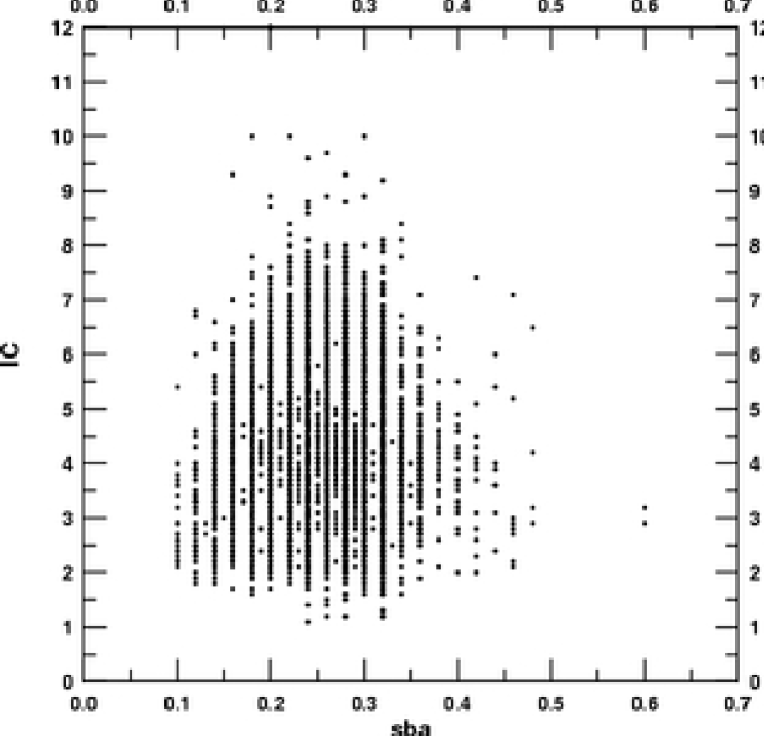
In Figs. 10–12 are exhibited two-dimensional distributions “concentration index” IC vs magnitude, IC vs color and IC vs axial ratio, respectively.
It is seen on all three diagrams that the mean index of concentration changes slightly over a wide range of magnitudes and colors, having an average value with a standard deviation of Fig. 10 shows deficiency of bright objects. Apparently, bright galaxies with a large index of concentration failed to enter into the catalog 2MFGC for two reasons: 1) the selection criterion cut off objects with a pronounced bulge (as required in selecting late spirals) and 2) the total magnitude of thin galaxies might be underestimated in photometrying.
The shortage of blue objects with () at IC (Fig. 11) is naturally explained by the absence of pronounced bulges in thin spirals of late types.
Closer examination discloses that the index of concentration somewhat decreases for galaxies with faint magnitudes, the correlation coefficient and somewhat increases with “reddening” of a galaxy, , the correlation coefficient = 0.14.
It can be seen from Fig. 12 that the mean value remains unchanged over the entire interval of from 0.10 to 0.50. The main body of the catalog 2MFGC is comprised of rather thin objects ().
3.4 Distribution over the sky and NIR dipole
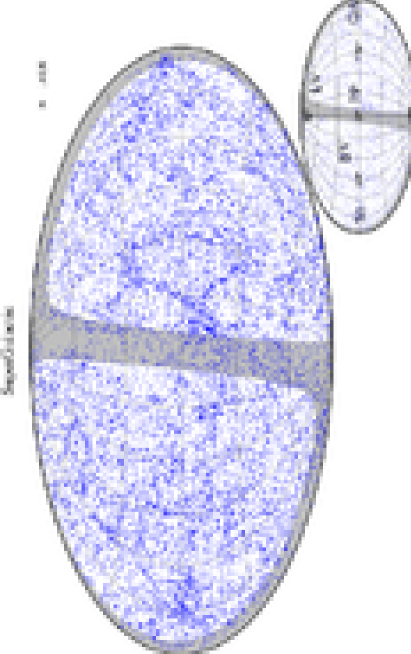
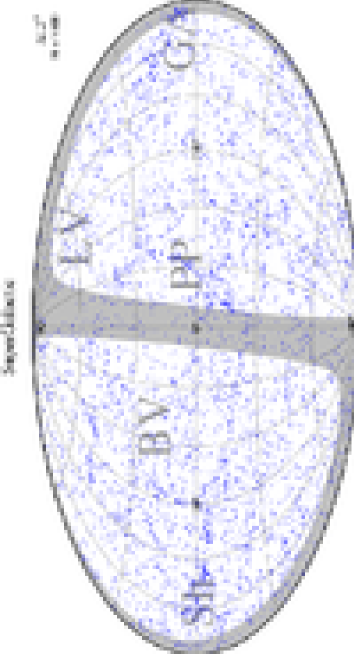
We present in Fig. 13 the distribution of 18020 galaxies of the catalog 2MFGC over the sky in supergalactic coordinates. The gray strip isolates the region of the equator of the Galaxy ). This region is seen to be sufficiently well filled with galaxies.
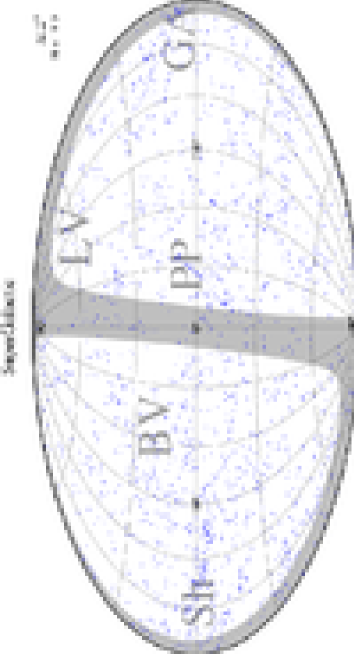
In the lower right part of Fig. 13 the positions of the Great Attractor (GA), of the supercluster Pisces–Perseus (PP), Shapley concentration of clusters (Sh), and also Bootes Void (BV) and Local Void (LV) are marked. It follows clearly from Fig. 13 that the galaxies of the 2MFGC catalog outline a large-scale structure at a great depth (for instance, radial velocities of clusters in the Shapley concentration are km/s). The same is also seen at nearer sections in distance, up to (Fig. 14 and 15).
As it is followed from Figs. 13–15, the 2MFGC contains a large number of galaxies distributed throughout the sky to a sufficient depth (the typical redshift is ). This, as well as the photometric homogeneity of the catalog 2MFGC, allows one to calculate the dipole moment in the distribution of galaxies and make comparison with the results obtained from other catalogs (IRAS, RFGC).
Table 3: NIR dipole parameters from the data of 2MFGC catalog K N X Y Z 10 554 0.0230.022 0.1370.023 0.1100.027 260 38 122 36 11 2070 0.0490.012 0.0540.012 0.0640.014 227 41 90 43 12 6423 0.0490.007 0.0300.007 0.0440.008 211 37 73 43 13 14078 0.0400.005 0.0250.005 0.0290.005 212 31 70 50 14 17885 0.0410.004 0.0160.004 0.0240.005 201 28 56 47 All 18020 0.0430.004 0.0140.004 0.0250.005 198 28 53 45
Using the coordinates of the 2MFGC galaxies, we computed the location of their centroid at different depths (different sections by apparent magnitude) without making allowance for weighting galaxies by their brightness. The results are listed in Table 3. Here, in the appropriate columns are given: — the limiting magnitude to which the calculation of the dipole is performed, N — the number of galaxies in the subsample, and — the mean galactic Cartesian coordinates for the centroid of galaxies and their errors, , , — the direction of the galaxy centroid in galactic and supergalactic coordinates, respectively. It is evident that with increasing depth (and rising incompleteness) of the 2MFGC catalog the galactic longitude of the dipole has a strong trend, while the galactic latitude changes slightly. Since the catalog 2MFGC is assumed to be complete to , then the computed positions of the dipole for and are in fair agreement with the data for the IRAS dipole, (Lahav et al. 1988).
Maller et al. (2003) determined the position of the dipole as for objects brighter than from the XSC catalog (with taking account weighting by luminosity). As one can see from our Table 3, the dipole positions defined from the brightest () 2MFGC galaxies are in good agreement with the data of Maller et al. (2003) too.
We present for comparison also the position of the MBR (Microwave Background Radiation) dipole , or (Kogut et al. 1993).
Another group of results refers to the optical dipole. For the integrated UGC+ESO catalog (N = 23984, ) Lahav et al. (1998) give the position of the sample centroid . For 4236 RFGC galaxies we obtained at (Karachentsev et al. 1999).
The position of the NIR dipole found from truncated samples of the catalog 2MFGC fits that of the MBR dipole, as well as the position of the optical dipoles, within .
-
Acknowledgements.
We thank Dmitry Makarov for help in the design of Figs. 13–15.
This paper makes use of data from the Two Micron All-Sky Survey, which is a joint project of the University of Massachusetts and the Infrared Processing and Analysis Center/California Institute of Technology, funded by the National Aeronautics and Space Administration and the National Science Foundation.
We have made use of the LEDA database (http://leda.univ-lyon1.fr) and the NED database (http://nedwww.ipac.caltech.edu).
This research was partially supported by DFC-RFBR grant 02–02–04012.
References
- [1] Bizyaev D. & Mitronova S., 2002, Astron.Astrophys., 389, 795
- [2] Curti R.M., Skrutskie M.F., 1998, Two Micron All-Sky Syrvey Status Report, BAAS, 30, 1374
- [3] Jarrett T.H., 2000, Publ. Astr. Soc. Pacific, 112, 1008
- [4] Jarrett T.H., Chester T., Cutri R. et al., 2000, Astron.J., 119, 2498
- [5] Jarrett T.H., Chester T., Cutri R., Schneider S., Huchra J., 2003, Astron.J., 125, 525
- [6] Karachentsev I.D., 1989, Astron.J., 97, 1566
- [7] Karachentsev I.D., Karachentseva V.E., Parnovsky S.L., 1993, Astron. Nachr., 314, 97 (FGC)
- [8] Karachentsev I.D., Karachentseva V.E., Kudrya Yu.N. et al., 1997, Pis’ma Astron. Zh., 23, 652
- [9] Karachentsev I.D., Karachentseva V.E., Kudrya Yu.N. et al., 1999, Bull. Spec. Astrophys. Obs., 47, 5 (RFGC)
- [10] Karachentsev I.D., Mitronova S.N., Karachentseva V.E. et al., 2002, Astron. & Astrophys. 396, 431
- [11] Karachentsev I.D., Karachentseva V.E., Kudrya Yu.N. et al., 2000, Astron. Zh., 77, 175
- [12] Kogut A., Lineweaver C., Smoot G.F. et al., 1993, Astrophys. J., 419, 1
- [13] Kudrya Yu.N., Karachentsev I.D., Karachentseva V.E. et al., 1997a, Pis’ma Astron. Zh., 23, 15
- [14] Kudrya Yu.N., Karachentsev I.D., Karachentseva V.E. et al., 1997b, Pis’ma Astron. Zh., 23, 730
- [15] Kudrya Yu.N., Karachentsev I.D., Karachentseva V.E. et al., 2003, Astron. & Astrophys., 407, 889
- [16] Lahav O., Rowan-Robinson M., Lynden-Bell D., 1988, Mon. Not. R. Astron. Soc., 234, 667
- [17] Lauberts A., 1982, The ESO/Uppsala Survey of the ESO(B) Atlas, ESO, Munich
- [18] Maller A.N., McIntosh D.N., Katz N. et al., 2003, astro-ph/0303592
- [19] Nikolaev S., Weinberg M.D., Skrutskie M.F. et al., 2000, Astron. J., 120, 3340
- [20] Nilson P., 1973, Uppsala General Catalogue of Galaxies, Uppsala Astron. Obs. Ann., Bd.6 (UGC)
- [21] Raman & Shandarin S., 2003, astro-ph/0310242
- [22] Skrutskie M.F., Schneider S.E., Stiening R. et al., 1997, in: “The Impact of Large Scale Near–IR Sky Surveys, ed. F. Garzon et al., Netherlands: Kluwer, ASSL, 210, 25
- [23] Vaucouleurs G., de, Vaucouleurs A. de, Corwin H.C. et al., Third Reference Catalogue of Bright Galaxies, New York, Springer, 1991, 1-3
- [24] Zasov A.V., Bizyaev D.V., Makarov D.I. et al., 2002, Pis’ma Astron. Zh., 28, 1
![[Uncaptioned image]](/html/astro-ph/0408257/assets/x1.png)
Fig1a: Images of 2MFGC galaxies. On the left — the view of a galaxy in the K band taken from 2MASS, on the right — the view of the same galaxy in the red band from DSS. The field size is . For all the images North is top and East is left.
![[Uncaptioned image]](/html/astro-ph/0408257/assets/x2.png)
Fig1b:Images of 2MFGC galaxies (continuation of Fig.1a)