Star Formation Properties of a Large Sample of Irregular Galaxies
Abstract
We present the results of H imaging of a large sample of irregular galaxies. Our sample includes 94 galaxies with morphological classifications of Im, 26 Blue Compact Dwarfs (BCDs), and 20 Sm systems. The sample spans a large range in galactic parameters including integrated absolute magnitude (MV of 9 to 19), average surface brightness (20 to 27 mag/arcsec2), current star formation activity (0 to 1.3 M yr-1 kpc-2), and relative gas content (0.02 to 5 M/LB).
The H images were used to measure the integrated star formation rates, determine the extents of star formation in the disks, and compare azimuthally-averaged radial profiles of current star formation to older starlight. The integrated star formation rates of Im galaxies normalized to the physical size of the galaxy span a range of a factor of 104 with 10% Im galaxies and one Sm system having no measureable star formation at the present time. The BCDs fall, on average, at the high star formation rate end of the range. We find no correlation between star formation activity and proximity to other catalogued galaxies. Two galaxies located in voids are similar in properties to the Sm group in our sample.
The H ii regions in these galaxies are most often found within the Holmberg radius RH, although in a few systems H ii regions are traced as far as 1.7RH. Similarly, most of the star formation is found within 3 disk scale-lengths RD, but in some galaxies H ii regions are traced as far as 6RD.
A comparison of H surface photometry with V-band surface photometry shows that the two approximately follow each other with radius in Sm galaxies, but in most BCDs there is an excess of H emission in the centers that drops with radius. In approximately half of the Im galaxies H and V correspond well, and in the rest there are small to large differences in the relative rate of fall-off with radius.
The cases with strong gradients in the LHα/LV ratios and with high central star formation rate densities, which include most of the BCDs, require a significant fraction of their gas to migrate to the center in the last Gyr. We discuss possible torques that could have caused this without leaving an obvious signature, including dark matter bars and past interactions or mergers with small galaxies or HI clouds. There is now a substantial amount of evidence for these processes among many surveys of BCDs. We note that such gas migration will also increase the local pressure and possibly enhance the formation of massive dense clusters, but conclude that the star formation process itself does not appear to differ much among BCD, Im and Sm types. In particular, there is evidence in the distribution function for H surface brightness that the turbulent Mach numbers are all about the same in these systems. This follows from the H distribution functions corrected for exponential disk gradients, which are log-normal with a nearly constant dispersion. Thus the influence of shock triggered star formation is apparently no greater in BCDs than in Im and Sm types.
1 Introduction
Irregular galaxies are interesting systems for many reasons. Not only are they smaller, less evolved, and have lower amounts of dust and shear in their interstellar mediums (ISM) than most spirals, but they are also the most common type of galaxy in the universe. In some models dwarf irregulars (dIm) are the galaxies that formed first and became the building blocks of larger galaxies. Because these tiny galaxies have evolved relatively slowly over time, they chemically resemble the outer parts of present-day spirals. In fact, ultra-low surface brightness dIms may represent the slowest evolving galaxies in the universe (van den Hoek et al. 2000).
For purposes of star formation studies, the lack of spiral density waves in Im galaxies means that all of the non-spiral star formation processes can be examined more clearly. In fact Hunter, Gallagher, & Rautenkranz (1982) and Hunter & Gallagher (1986) have shown that some Im galaxies have star formation rates normalized to their size that are comparable even to those of spiral galaxies. Thus, spiral density waves are not necessary to a vigorous production of stars (see also Elmegreen & Elmegreen 1986). Furthermore, Hunter and Gallagher showed that irregular galaxies span a large range in integrated star formation rates. What then regulates star formation in tiny galaxies and determines how fast an Im galaxy evolves?
To address this question, we have conducted a multi-wavelength survey of a large sample of reasonably normal, relatively nearby, non-interacting galaxies without spiral arms. The data consist of UBV and H images for the entire sample, and JHK images, H i maps, CO observations, and H ii region spectrophotometry for a sub-sample. The H, UBV, and JHK image sets act as probes of star formation on three different times scales: H images trace the most recent star formation (10 Myrs) through the ionization of natal clouds by the short-lived massive stars; UBV, while a more complicated clue, is dominated by the stars formed over the past Gyr for on-going star formation (Gallagher et al. 1984); and JHK integrates over the lifetime of the galaxy where even in Im galaxies global JHK colors are characteristic of old stellar populations (Hunter & Gallagher 1985b). We have already used these data to conduct a case study of the Im galaxy NGC 2366 (Hunter, Elmegreen, & van Woerden 2001) as well as studies of the H ii region luminosity function and distributions (Youngblood & Hunter 1999, Roye & Hunter 2000), gas abundances (Hunter & Hoffman 1999), and pressures of H ii regions relative to the background galactic disk (Elmegreen & Hunter 2000).
Here we present the H data—integrated star formation rates, azimuthally-averaged H surface brightnesses, and extents of star formation—of the full sample for the first time, and we discuss the current star formation activity in these galaxies. Because this is the first presentation of the full survey sample, in the next section we will discuss the sample and some of its properties although results from broad-band imaging will be reported in detail in a seperate paper. In Section 3 we present the H observations, and in Section 4 we discuss star formation rates, the radial extents of star formation, and H surface photometry. A discussion of selected aspects is given in Section 5.
2 The Sample
The sample galaxies are listed in Table B where we have grouped the galaxies into three categories: Im, Blue Compact Dwarf (BCD), and Sm. Our sample includes 140 galaxies: 94 Im systems, 26 BCDs, and 20 Sms. Our broad-band images will be presented in a separate paper, but in order to characterize the sample we include here several plots of integrated properties taken from that data set: a UBV color-color diagram in Figure 1, a histogram of reddening-corrected M values in Figure 2, a histogram of (average surface brightness within a B-band isophote of 25 magnitudes of one arcsec2) in Figure 3, and a histogram of MHI/LB in Figure 4.
The morphological classifications were taken from de Vaucouleurs et al. (1991RC3). Most are simply classed as Im or Sm with minor modifications. However, the morphological classifications of the BCDs are complex and varied, reflecting the difficulty in determining just where these systems fit in. One galaxy, NGC 3413, is classed as an “S0sp” but we include it in the Im galaxy sample where our imaging suggests that it belongs. In addition to morphological classification, most of the galaxies in this study were chosen to be relatively nearby; most are closer than 30 Mpc.
The original sample of galaxies was chosen to be those classed as Im in the HI catalog of Fisher & Tully (1975), and so the sample is biased to systems containing gas. A few Sm systems were added from this catalog for comparison. To this collection we later added galaxies that promised to probe the extremes in various properties of the dwarf galaxies since the extremes may hold important clues to a complete picture of the evolution of these galaxies. One such property is surface brightness. We added low surface brightness systems cataloged from the surveys of Schombert & Bothun (1988) and Schombert et al. (1992), particularly those with HI maps obtained by de Blok et al. (1996). These galaxies are more distant than our core sample, the most distant being 86 Mpc. There were 15 Im galaxies added in this way that form 16% of our total Im sample, and 3 Sm systems that form 15% of the Sm sample. In Figure 3 all but 2 of these Im systems turn out to have typical surface brightnesses and fall at the peak in the number distribution of the entire sample, but they are not responsible for defining the peak. The other two systems form the two extreme bins at the faint end. Of the Sm systems, one has a typical and the other two form the extreme bins at the faint end of the distribution. Thus, the augmentation of the original sample with these systems only produced two Im (2% of the total sample) and two Sm (10%) galaxies that really do form an extreme.
Another potential property of interest is the relative gas content. We added 5 systems (5% of our total Im sample) designated as having high MHI/LB ratios from the study by van Zee, Haynes, & Giovanelli (1995). Of these one turned out to have an average MHI/LB, as seen in Figure 4, 3 have modestly high MHI/LB ( MHI/LB) but are not extreme, and one is in the highest bin, although there are 6 other galaxies in that bin too. Thus, this augmentation of the original sample produced one extreme Im galaxy, 1% of the entire Im sample.
In addition to Im and a small sample of Sm galaxies, we include a sample of BCD systems, kept as a seperate group, in order to see how their star-forming properties compare to those of Im galaxies. BCDs are generally characterized by intense emission-lines from H ii regions. Some, although not all, BCDs have luminosities, sizes, and other properties that make them likely to be related to Im systems (Kunth 1987). Furthermore, detailed examination of one BCD with the Hubble Space Telescope (HST), VIIZw403, has shown that it resembles an Im galaxy but with an unusual star-formation past (Lynds et al. 1998). Yet other integrated properties of BCDs are statistically different from those of Im galaxies (Chamaraux 1977, Papaderos et al. 1996).
Most BCDs were chosen from the list of Thuan & Martin (1981). The BCD or H ii galaxy class appears to be a mixed bag of objects. Indeed some BCD galaxies are actually star-forming pieces of other galaxies (for example, NGC 2363 in NGC 2366). In order to select BCDs that are most likely comparable systems to the Im galaxies we have imposed an additional selection criteria not applied to the rest of the sample. We used W20, the width at 20% intensity of the integrated HI profile, since it is related to the dynamical mass, to select systems that are comparable in mass to Im systems. We chose systems with W20175 km s-1 since this value corresponds to the upper envelope for the Im systems in our sample.
Our sample, thus, is not complete in any sense, but it spans a large range in galactic parameters including integrated luminosity (MV of 9 to 19), average surface brightness (20 to 27 mag/arcsec2), current star formation activity (0 to 1.3 M yr-1 kpc-2), and relative gas content (0.02 to 5 M/LB). A large sample is necessary in order to probe the full range in galactic parameters and to allow a meaningful probe of galaxies that are proving to be very complex and diverse.
The original sample of Im and Sm galaxies was taken from the H i survey of Fisher & Tully (1975) that was based on the catalog of dwarfs compiled by van den Bergh (1959, 1966) from a search of the National Geographic Society and Palomar Sky Survey plates. Fisher & Tully (1981) then went on to produce a more complete survey of galaxies, dwarfs and non-dwarfs of all Hubble types. They argue that their 1981 study is reasonably complete to radial velocities less than 1000 km s-1, sizes greater than 1.5′, declinations higher than °, and Galactic latitutes more than 30° from the plane. Their 1981 sample included 99 Im systems and 36 Sm systems that satisfy these criteria. 37 galaxies from our Im sample (39% of our sample) represent 37% of the Fisher and Tully sample, and 7 galaxies from our Sm sample (35% of our sample) represent 19% of their sample.
There are 14 Im galaxies (15% of our sample) and two Sm galaxies (10% of our sample) that are not part of the Fisher and Tully 1981 H i survey or the augmentation samples discussed above. In the figures we see that most of the added Im galaxies have typical integrated properties. The exceptions are as follows: 3 fall near the blue end and 2 near the red end of UBV colors; 8 are at the high end of MV (M), two are at the low end (M), and one is the lowest (M); 7 are high in surface brightness ( mag arcsec-2) and none are low ( mag arcsec-2); 3 are low in MHI/LB ( MHI/LB) and none are high ( MHI/LB); and 6 have high star formation rates ( ), two have low rates ( ), and two have no current measureable star formation. The two Sm galaxies are typical in all properties. Thus, while our sample of galaxies is not complete, it is representative.
The distances to the galaxies in our sample are given in Table B. We used distances determined from stellar population studies, often from variable stars or the tip of the Red Giant Branch, if they were available. Other distances were determined from the radial velocity relative to the Galactic standard of rest VGSR (RC3) and a “Hubble constant” of 65 km s-1Mpc-1. References are given in Table B.
Any system known to be interacting was excluded because we are interested only in internal processes. However, inclusion in this sample is not a guarantee that a galaxy has not been affected by other galaxies at some time in the past. Surprises sometimes await us when we learn more about individual galaxies (for example, NGC 4449: Hunter et al. 1998b). NED was used to search for galaxies within 1 Mpc and 150 km s-1 of our sample galaxies. The distance to the nearest galaxy and their radial velocity difference are given in Table B.
For comparison to spiral galaxies we have used the sample compiled by Kennicutt (1983). This sample spans the range of morphologies from Sab to Sd with 74 systems. Kennicutt has measured H fluxes for these galaxies. Other properties were obtained from RC3 and Fisher & Tully (1981).
Foreground reddening was determined from Burstein & Heiles (1978) and values are given in Table B. An internal reddening correction of E(BV)s=0.05 was added for the stars and of E(BV)g=0.1 for the gas. The reddening law of Cardelli, Clayton, & Mathis (1989) was adopted. For the spirals, internal reddening was taken to be 0.3, after Kennicutt (1983).
Reddenings from Schlegel et al. (1998) were considered early on, but we were uneasy that the Schlegel et al. values are systematically higher than those of Burstein and Heiles. For 49 Im and BCD galaxies, the Schlegel et al. E(BV) values are on average a factor of two times those of Burstein and Heiles. For most galaxies the difference is nevertheless insignificant, especially compared to the error we must make by adopting the same internal reddening for all galaxies and all H ii regions within each galaxy. However, the higher values of Schlegel et al. do not make sense in some cases. For example, for the heavily reddened galaxy NGC 1569 optical spectroscopy of its H ii regions yields an average total E(BV) of 0.700.05 (see compilation in Hunter & Hoffman 1999). The Burstein and Heiles value for foreground reddening is 0.51 and the Schlegel et al. value, obtained from NED, is 0.70. Thus, the Schlegel et al. value would mean that the H ii regions in NGC 1569 have no internal reddening while the Burstein and Heiles valule allows a reasonable 0.2 mag of internal reddening. Willick (1999), as quoted by NED, argues that both methods of determining foreground reddening are likely to have systematic errors. It is not clear to us at this point that one method is significantly superior to the other, and we have prefered to use the values of Burstein and Heiles for the reasons given.
3 The H images
The H images were obtained in 22 observing runs from 1988 to 1998. The telescopes, instruments, and exposure times are given in Table 2. Some of these images were discussed by Hunter, Hawley, & Gallagher (1993) in their search for extra-HII region ionized gas structures. Images are available from Hunter upon request.
The galaxies were imaged through narrow-band H filters, usually with a FWHM30 Å. We had a series of 5 filters forming a red-shift set with some wavelength overlap between filters. The continuum-only off-band filter was centered at 6440 Å with a FWHM of 95 Å. Usually multiple images through the H filter and sometimes also through the off-band filter were obtained and combined to remove cosmic rays. The off-band image was shifted, scaled, and subtracted from the H image to remove the stellar continuum. The H emission was calibrated using the known H flux from the H ii regions NGC 2363 (Kennicutt, Balick, & Heckman 1980) and NGC 604 (Appendix A) and from spectrophotometric standard stars. Calibrations determined from nebulae and standard stars observed on the same nights agreed to within 4%. The H flux has been corrected for the shift of the bandpass with temperature and the contribution from [NII]. The latter contribution was usually of order 1%. Sky was subtracted from the image most often using a two-dimensional fit to the background.
Detection limits in H photometry and comparison to measurements in common with others are discussed by Youngblood & Hunter (1999). They determined detection limits by artificially adding H ii regions and determining the limit for recovering them. In Table 2 we also include the rms deviations in the background of the H images given in terms of the corresponding H surface brightness of a single pixel. Note, however, that these limits are for a single pixel; azimuthally-averaged surface photometry from ellipse photometry can be lower than these limits if a detectable H ii region is located in an annulus with a large area.
We mention here a few studies with integrated H measurements published after Youngblood & Hunter (1999). There are 12 galaxies in common with the sample of van Zee (2000). Differences in the integrated H fluxes for these galaxies are on average 2.8, with three galaxies having a 0.2–0.3 difference and two having a 7–9 difference. From an alternative perspective, the differences are 21% of the flux on average except for two galaxies that differ by a factor of 2–3. Kniazen et al. (2000) have estimated the integrated H flux of HS08223542 from slit spectroscopy. Our flux agrees with theirs to 6%. We have 34 galaxies in common with the H survey of James et al. (2004). The average difference in the H flux is 2.5 with one galaxy having a difference of 6.
For doing azimuthally-averaged H surface photometry, we have geometrically matched the H image to the V-band image. The V-band images, to be presented in a separate paper, were used to determine the position angle, ellipticity, and center of the galaxy. The same ellipses used for photometry of the V-band images were used for the H images. Thus, the H surface photometry can be directly compared to that from the V image. The position angle PA, minor-to-major axis ratio , step size, and galaxy center that were used for the ellipse photometry are given in Table 2. In a few cases V-band images were not available and we used instead H off-band images or Digitized Sky Survey (DSS) extracts.
4 Results
4.1 Integrated star formation rates
We have used H as a tracer of the most recent star formation in Im galaxies and LHα as a measure of the star formation rate. Massive stars are short-lived and ionize the gas left over from the star formation process. The H luminosity is a measure of the flux of ionizing photons bathing the left over gas and hence a measure of the number of massive stars that are present in the region. With the assumption of a stellar initial mass function we infer the presence of lower mass stars and then deduce the star formation rate. The stellar initial mass function has been found to be approximately constant among systems where it could be directly measured, so this is a reasonable assumption. Extinction due to dust is low, so we feel confident that H is revealing the bulk of the star formation in these galaxies (Hopkins et al. 2001). One potential issue occurs for galaxies that are undergoing a burst of star formation. Weilbacher & Fritze-v. Alvensleben (2001) have shown that the H luminosity does not translate into as simply in galaxies where the star formation rate is changing on short timescales as in galaxies where it is relatively constant. Here we have treated all galaxies in the same manner, but note that the deduced for galaxies with an unusually high star formation rate compared to that in the past may not be as well determined. Brinchmann et al. (2004) find that the relationship between star formation rate and LHα is also a function of the stellar mass of the galaxy (driven primarily by the metallicity of the galaxy), the ratio of LHα to star formation rate increasing to less massive galaxies. However, their models show that the simple method of converting LHα to using a single constant that we adopt here agrees with other methods for the low-mass galaxies of our survey (their Figure 8).
The reddening-corrected LHα and star formation rates are listed in Table 3, and the number distribution of is shown in Figure 5. We converted LHα to using the formula derived in Appendix B. This assumes that stars 0.1 M to 100 M form in the proportions first observed by Salpeter (1955). We also assume an efficiency factor of 2/3 for the absorption of ionizing photons by the nebulae (Gallagher, Hunter, & Tutukov 1984).
To compare star formation rates in galaxies we must normalize the star formation rate to the “size” of the galaxy. An obvious quantity for normalization would be the mass of the galaxy. However, determining the mass is frought with uncertainties: There are varying amounts of dark matter, large uncertainties in determining the total stellar mass which increases with time, and a gas mass that is depleted with time. Therefore, operationally mass does not make a good normalizer. We have instead chosen to use the physical area of the galaxy. In the past we used R25 from which to calculate the area of the galaxy R252. We did this because R25 was readily available from RC3 for a large number of galaxies. However, R25 is a surface-brightness defined size, and therefore, it will depend to some extent on the location and level of the star formation itself. Furthermore, there are some galaxies that fall everywhere below a B-band surface brightness of 25 mag of one arcsec2 and yet are forming stars.
To address these problems, we have chosen here to use the scale-length RD measured from V-band images to define the area of the galaxy. Of course, the scale-length assumes a reasonably well-behaved exponential disk, and most Im disks are (Hodge 1971, Hunter & Gallagher 1985b, van Zee 2000). Determining the scale-length has its own uncertainties, but we believe that RD is a more meaningful measure of the size of a galaxy than R25. There are some galaxies that are not characterized by a single fit to the surface brightness profile. These are 8 of the BCDs: Haro 20, Haro 23, Mrk 32, Mrk 408, Mrk 600, Mrk 757, UGCA 290, and VIIZw403. All but one of these shows a steeper profile in the center than in the outer parts. Since we would expect intense central star formation to bias the surface brightness profile, we have used the fit to the outer galaxy in these cases (see also Cairós et al. 2001, Noeske et al. 2003).
To ease the transition and for comparison to spirals for which we only have R25, we include the star formation rate normalized to R25 , as well as the star formation rate normalized to RD . These are given in Table 3. and are compared in Figure 6, and the number distributions of these two normalized star formation rates are shown in Figures 7 and 8. In order to represent galaxies with zero star formation rates on these log plots, we have plotted them at and of to . The R25 and RD are given in Table B.
Although we use the area RD2 as the area for normalizing , that does not imply that all of the star formation is found within RD. In fact below we will see that most of the star formation is found within 3–7RD. We use RD2 as the area simply as a way of normalizing by the relative physical size of the galaxy.
We see in Figure 6 that the lower star formation rate systems cluster around the line of , while the higher star formation rate systems approximately follow a line in which , which corresponds to R25RD. We can understand this as due to lower surface brightness systems having shorter R25 compared to RD; they reach 25 mag arcsec-2 faster with radius than galaxies that start out brighter. Higher surface brightness galaxies have larger relative R25, approximately 3RD (see also Heller et al. 2000). This is a consequence of the higher star formation rate systems having higher central surface brightnesses, , because for fixed surface brightness at 25th mag arcsec-2.
From Figures 7 and 8 one can see that star formation rates in Im galaxies forming stars span a factor of 300 in and in . BCDs, as expected, do generally have high star formation rates although there is also a range (see also Hopkins, Schulte-Ladbeck, & Drozdovsky 2002). Sm galaxies have about the same distribution in rates as Im galaxies. In the irregular galaxies at the high end of the distribution have normalized rates that are comparable to those of spirals. Not all galaxies are forming stars, however: 10% of our Im (9 of 94) and 5% of our Sm galaxies (1 of 20) are not currently forming stars at a level that we can detect.
The typical star formation rate for the Im galaxies is M yr-1 kpc-2. The typical spiral has an integrated star formation rate that is about 3 times higher. We have compared this to a sample of 11 Sc galaxies whose radial H surface brightnesses are shown by Kennicutt (1989). We see that the Sc spirals reach this star formation rate per unit area between 0.35R25 and 0.81R25. The average is 0.5R25. Thus, the Im galaxies more closely resemble the outer parts of spirals in star formation rates.
The timescale to exhaust the current gas supply at the current star formation rate is given in Table 3; the gas mass is given in Table B. The number distribution is shown in Figure 9. We include all of the gas associated with the galaxy in the current gas supply. Gas at large radii is problematical; we do not know what role that gas will play in the future nor can we say with confidence what role it is currently playing in star formation. In one Im galaxy, the bulk population in the outer parts is the same as everywhere else in the galaxy suggesting that star formation must be taking place out there at some level (Hunter, in preparation). Recycling of gas from dying stars is not included in determining , but would add another factor of 1.5–4 to the timescale (Kennicutt, Tamblyn, & Congdon 1994).
Detailed studies of the stellar populations in dIm galaxies that have shown that most evolve with a star formation rate that varies in amplitude by a factor of only a few, as would be expected in small galaxies (Ferraro et al. 1989; Tosi et al. 1991; Greggio et al. 1993; Marconi et al. 1995; Gallart et al. 1996a,b; Aparicio et al. 1997a,b; Dohm-Palmer et al. 1998; Gallagher et al. 1998; Cole et al. 1999; Gallart et al. 1999; Kennicutt & Skillman 2001; Miller et al. 2001; Wyder 2001). This is even true of some BCD systems (Schulte-Ladbeck et al. 2000; Crone et al. 2002). Thus, one can see that most of the Im and Sm galaxies can sustain this rate for at least another Hubble time and some much longer (see also van Zee 2001).
However, this is not true of most BCDs and a few Im galaxies that have unusually high star formation rates. The galaxies in our sample with unusually high ( in Table 3 and Figure 8) include IC 4662, NGC 1156, NGC 1569 among the Im systems and Haro 3, Haro 4, Haro29, HS08223542, Mrk 67, NGC 1705, and Zw2335 among the BCDs. Most of these systems are also the ones with low (Table 3 and Figure 9), indicating that this level of star formation is unsustainable.
This is what brought people early on to the belief that BCDs as a class are undergoing an unusually enhanced episode of star formation at the present time (Thuan 1991). Studies of the resolved stellar population of NGC 1569 find that the current star formation rate is unusual compared to what it has been in the past (Greggio et al. 1998). In the case of NGC 1569, interaction with a nearby H i gas cloud is believed to be responsible for the current elevated level of star formation (Stil & Israel 1998). Resolved stellar population studies of a few other Im galaxies also show evidence of higher amplitude variations either currently or in the past (Tolstoy 1996; Israel 1988; Tolstoy et al. 1998; Karachentsev, Aparicio, & Makarova 1999). But, what causes statistically large variations to occur in dwarfs that appear to be isolated is not known.
The current star formation rate does not correlate with many integrated properties of the galaxies (see also Hunter et al. 1982, Hunter & Gallagher 1985b, van Zee 2001). An expected correlation is between star formation activity and average surface brightness of the galaxy. This is shown in Figure 10. Galaxies with higher star formation rates are higher in surface brightness. However, there is no correlation between surface brightness and (UB) or (BV), which are longer term measures of the star formation state of a galaxy (see also McGaugh & Bothun 1994). In terms of other quantities, there is a slight trend with lower luminosity galaxies having lower star formation rates, shown in Figure 11, particularly when spiral galaxies are included to extend the range in MV. However, at any given galactic magnitude, the scatter in is very large. There is a stronger correlation between star formation rate and MHI/LB and between star formation and the fraction of the galactic mass (gas plus stars) that is gas. These are shown in Figures 12 and 13. The trends are in the sense that galaxies with higher ratios of gas relative to their luminosity or total baryonic mass have lower current star formation rates. This makes sense if star formation rates are approximately constant: galaxies forming stars at lower rates have locked less of their gas up in stars. Other studies have also shown that star formation rates are correlated with the gas surface density in late-type galaxies (Buat, Deharveng, & Donas 1989) and total gas mass (Pérez-González et al. 2003).
We were concerned about the effects that neighboring galaxies might have on the star formation processes in our survey galaxies (see, for example, Hashimoto et al. 1998, Noeske et al. 2001). In Figure 14 we plot the current star formation rate against the distance to the nearest catalogued galaxy, given in Table B. Galaxies for which no obvious neighbor was found within our search parameters are plotted at a distance of 10000 kpc. One can see that galaxies with no neighbors span the range from very high to low , most of the observed range in our sample. Also, galaxies with a star formation rate of zero span the same range in distance to nearest neighbors. So, it would seem that a lack of neighbors has not been the cause of no star formation. However, three galaxies at the high end of the star formation rate range do fall outside the envelope defined by the other galaxies towards smaller distances as might be expected if gravitational interactions sometime in the past contributed to the current star formation activity.
Among the BCDs, we do not see evidence of systematically closer companions than for Im systems. This is consistent with the studies by Campos-Aguilar & Moles (1991) and Telles & Terlevich (1995) who also searched for bright companions. Recent studies have found significant evidence for an excess of faint companions to BCD galaxies, however. We return to this issue in Section 5.2. At the other extreme, Bothun et al. (1993) suggested that low surface brightness galaxies have a deficit of companions. A plot of the V-band surface brightness in one scale length against distance to the nearest galaxy shows only a somewhat broader range in distances for the lower surface brightness systems in this sample.
How do the two galaxies in voids (0467074, 1397049) compare with the other irregular galaxies? Their MV place them at the bright end of the range for Im or BCD galaxies, more like Sm systems. Similarly, their RD are larger than is typical for Im or BCD galaxies. However, except for 1397049’s UB, the colors, surface brightnesses, and star formation rates are typical of Im galaxies. These two galaxies do not have the higher surface brightness or star formation rates more typical of BCDs and, therefore, are not similar to the void dwarfs studied by Popescu, Hopp, & Rosa (1999). However, like Popescu et al. we find that the galaxies in the voids are similar to systems in the field.
There have been several surveys published recently dealing with star-forming properties of large numbers of galaxies over the range of galaxy Hubble types, including Im and BCD systems. Their observational approaches are very different from ours, but it is worth commenting on where our survey fits in with theirs. The first is that of Gil de Paz et al. (2000) who use H fluxes to determine star formation rates for a sample of galaxies found on objective-prism plates. Because of their method of detection, this survey is limited to galaxies that are currently forming stars. Their Figure 1(f) shows a histogram of H luminsity. We see that the bright end of our survey begins just where their survey reaches its faint limit. Gil de Paz et al. normalize their star formation rates to the stellar mass of the galaxy, a quantity that changes as the galaxy evolves. If we compute the star formation rate for our galaxies using their Equation 4 and divide by the integrated galactic stellar mass, we find that our median log M ( yr-1) is 1.2 for the Im galaxies with a range from 0.2 to 2.0 and 1.4 for the BCDs with a range from 0.4 to 2.4. Their mean value of log M ( yr-1) for dwarf galaxies (based on 5 systems) is 1.90.1 and for H ii galaxies (based on 18 systems) is 2.10.1. Thus, the galaxies in our survey have lower average specific star formation rates. Gil de Paz et al. also find a correlation between integrated galactic stellar mass and the star formation per unit stellar mass (their Figure 7(b)). Our sample alone shows no correlation, but the relationship is quite broad and our range of parameter space more limited than theirs.
A second survey is that of Brinchmann et al. (2004) which uses Sloan Digital Sky Survey (SDSS) images and spectra. They also normalize to the integrated mass of the galaxy and find that the value of log M (yr-1) increases on average as the mass of the galaxy increases, similar to Figure 7(b) of Gil de Paz et al. (2000). To compare to their Figure 22, we constructed histograms of log M (yr-1) for our sample divided into two sets: those with integrated galactic stellar masses less than 109 M and those more massive than this. The median values in the two sub-samples are the same for the Im galaxies, only 0.2 dex different for the BCDs and only 0.1 dex different for the Sms. Brinchmann et al., on the other hand, would predict a shift to higher log M (yr-1) of 0.4 dex, using their middle mass bins in these ranges. Thus, we do not see the correlation between M and Mstars that they see. However, our data do show the correlation between and Mstars that they find (their Figure 17).
4.2 Star formation extents
The radius of the last annulus in which H emission is detected in our images RHα is given in Table 3. For most Im and Sm galaxies RHα is the same, or nearly the same, as the radius of the furthest detectable discrete H ii region RHII. However, in some BCDs and starburst galaxies the furthest detectable H emission is diffuse ionized gas from the outer parts of a very large H ii region or extra-H ii region ionized gas. In about 11 of our BCDs RHα is somewhat greater than the location of the center of its furthest H ii region because of extended ionized gas around the supergiant H ii region. In the two starburst galaxies NGC 1569 and NGC 1705, extra-H ii region ionized gas extends well beyond the main body of the optical galaxy and any star-forming regions. Therefore, in Table 3 we also include RHII for each galaxy. This is the ellipse, from the ellipse photometry, that includes the center of the H ii region which is most distant from the center. Also in Table 3 we give the ratio of RHII to various measures of the size of the galaxy: R25, RH, and RD. Histograms of RHII/RH and RHII/RD are shown in Figures 15 and 16.
We see that most of the detectable H ii regions in our survey galaxies are found within the Holmberg radius RH. However, in some, H emission is found beyond this, even to 1.7 times RH. Similarly, most of the star-formation is found within 3 disk scale-lengths, but in some, H emission is found even to 6RD. This is just as Parodi & Binggeli (2003) found for bright lumps in B-band images of Im galaxies. In BCDs, the H ii regions are significantly more concentrated toward the center than in Im and Sm galaxies, consistent with the starburst nature of the BCDs.
The location of H ii regions, as a tracer of recent star formation, is consistent with most studies of resolved stellar populations in Im galaxies. Aparicio, Tikhonov, & Karachentsev (2000) found that there has been no recent star formation beyond RH in DDO 187 and only old stars are found in the outer part of DDO 190 (Aparicio & Tikhonov 2000). WLM also has an extended halo of old stars (Minniti & Zijlstra 1997), as do DDO 216 (Gallagher et al. 1998) and NGC 3109 (Minniti, Zijlstra, & Alonso 1999). By contrast, Komiyama et al. (2003) have found an extended distribution of blue stars that follows the H i distribution in NGC 6822, well beyond the H. They estimate the age of these stars at 180 Myrs.
4.3 H surface photometry
The H surface photometry was done in the same way as the V-band or equivalent surface photometry, which will be discussed in a separate paper. The surface brightness plot of the first galaxy in our sample is shown in Figure 17. Plots for the rest of the galaxies in the sample will be published in the paper presenting the broad-band images. The H image is measuring the star formation activity over the past 10 Myr or so, while the V-band light is dominated by stars with lifetimes of order 1 Gyr if star-formation is on-going (a convolution of the numbers of stars formed and their brightness in the V-band, Gallagher, Hunter, & Tutukov 1984). Thus, the V-band starlight is a tracer of a somewhat older stellar population.
Hunter & Gallagher (1985b) and Hunter et al. (1998a) found that, for many Im galaxies in their sample, there was a correlation between the surface density of stars and the azimuthally-averaged star formation activity (see also Ryder & Dopita 1994; Brosch, Heller, & Almoznino 1998; Parodi & Binggeli 2003). This implies that star formation has been approximately constant with radius. They noted that this could be a causal connection if stellar energy input to the ISM acts as a feedback process to star formation (see also Dopita & Ryder 1994).
Our much larger sample here shows that the relationship between stars and star formation is more complex. We have examined the correspondence of surface photometry and by looking at the ratio of LHα to LV in the surface photometry annuli. The H surface photometry is expected to be less smooth than the starlight since it represents a shorter-lived evolutionary stage. So, exact correspondence between and is not expected. The ratios LHα/LV as a function of radius are shown in Figure 18. We see that among the Im galaxies roughly half of the Im galaxies have a good correspondence between stellar density and star formation surface photometry. In the BCDs, on the other hand, the ratio LHα/LV most often drops steeply with radius. For Sm galaxies, the majority show a fairly constant ratio with radius.
We have used Figure 18 to assign the relationship between LHα and LV for each galaxy to one of three bins. The three bins are defined as 1) H falls off approximately like V. That is, the ratio LHα/LV is roughly constant, with statistical variations and not large trends. 2) H and V show some differences and some similarity, and 3) H and V are dissimilar with large-scale trends. Some galaxies have too little star formation to be a part of this exercise. Of the Im galaxies, we find that approximately 44% (34 of 77) have that fall off with radius similar to , 40% (31 of 77) are quite different, and 16% (12 of 77) are in between. Of the BCD galaxies, 8% (2 of 25) are similar, 76% (19 of 25) are different, and 16% (4 of 25) are in between. Of the Sm galaxies, 55% (10 of 18) are similar, 28% (5 of 18) are different, and 17% (3 of 18) are in between. There is no correlation between presence of a stellar bar or the value of W20, the FWHM of the integrated HI profile, of an Im galaxy and its bin type. There is also no correlation between bin type and distance to the nearest bright companion. However, there is a small preference for Im galaxies in bin 1 to be brighter overall in the V-band, and this is shown in Figure 19.
5 Discussion
5.1 Sm galaxies
In keeping with their classification as late-type spirals, the Sm group falls at the high end of the range of absolute magnitude of our sample although there is considerable overlap. Our Sm sample ranges from to with a median of . Because they tend to be more luminous, the Sm galaxies also are physically larger (see also Hodge 1971) and, as a group, tend to higher . In other properties, however, the Sm group covers the same range as the Im galaxies.
Most of the Sm galaxies have a roughly constant LHα/LV ratio with radius. This implies that the Sm galaxies are in a sense more stable. They are large enough and have enough star formation going on at all times that star formation as a function of radius is approximately constant (Hunter & Gallagher 1985b). This is also consistent with the trend for the brighter Im galaxies to also have roughly constant LHα/LV with radius. The statistical variations with location within smaller galaxies simply make this correlation harder to maintain. However, smaller galaxies may still maintain a correspondence integrated over a longer period of time, as “star formation bubbles around a galaxy” (Hunter & Gallagher 1986) propelled by changes in local characteristics.
5.2 BCD galaxies
In contrast to the Sm group, the BCD group covers the same range in MV as the Im galaxies, but falls at the extremes in other properties. While the absolute star formation rate is only modestly high in BCDs compared to typical Ims, the normalized star formation rates and are significantly higher. In keeping with the higher star formation rates, the BCDs also have a smaller time scale to exhaust the gas and higher surface brightnesses.
Part of the contribution to higher is the smaller RD of BCDs (see also Papaderos et al. 1996, Patterson & Thuan 1996, van Zee et al. 1998). This is illustrated in Figure 20 where one can see that the BCDs have smaller RD relative to their absolute magnitude, implying that they have systematically steeper profiles. This is in spite of the fact that in 8 systems we have fit the V-band azimuthal profile only in the outer parts where the profile becomes less steep and that we have reached as far out as RH in 13 of the 26 systems. Thus, to the extent that the V-band images are affected by the intense star formation taking place in these galaxies, they appear to be affected over a fairly large portion of the optical galaxy or the galaxy beyond the affected region must be quite low in surface brightness (see also Noeske et al. 2003).
In addition, the star formation in BCDs is often concentrated to the central regions (see also Davies, Sugai, & Ward 1998). One can see this in Figures 15 and 16. However, RHII does not take the intensity of the H ii region into account, and in some galaxies small regions are located outside the dominant central star-forming region. The central concentration is even clearer in the plots of LHα/LV as a function of radius (Figure 18). There the ratios often fall steeply with radius, implying unusually high LHα relative to LV near the centers.
The central concentration of star formation may be accompanied by a similar concentration of neutral gas. While only 3 of our BCDs have published HI maps, other samples of BCDs have been mapped in HI. Taylor et al. (1995), van Zee et al. (1998), and Simpson & Gottesman (2000) have stated that the HI gas is centrally concentrated in their BCDs. Van Zee, Salzer, & Skillman (2001) further state that BCDs have systematically steeper rotation curves, although the rotation curves are not given. This is in contrast to galaxies at the other extreme; very low surface brightness galaxies have more slowly rising rotation curves (de Blok, McGaugh, & van der Hulst 1996; but see Swaters, Madore, & Trewhella 2000).
The radial variation of LHα/LV in a galaxy implies that the position of star formation has migrated to the center within the last Gyr, which is approximately the timescale for stars that dominate the light in the V-band for on-going star formation. A major shift in the location of star formation requires a significant amount of angular momentum loss from the gas. Such a loss is usually the result of bar torques or companion galaxy tidal torques. In the case of a merger, the torque also comes from gas pressure and shocks as the two interstellar media merge. For our BCD sample, and for the Im and Sm cases that also have LHα/LV gradients, there is no systematic evidence for strong bars or bright companions. Still, most of these low mass galaxies are clearly axisymmetric and irregular, and any slight shear in the presence of such irregularities can lead to bar-like torques and mass inflow.
Low mass galaxies also have dark matter halos with velocity dispersions comparable to the dispersion in the stars and gas, as may be inferred from their systematically thicker shapes (Hodge & Hitchcock 1966; van den Bergh 1988; Staveley-Smith, Davies, & Kinman 1992; Binggeli & Popescu 1995; Sung et al. 1998). In these cases, two-fluid or three-fluid instabilities involving the visible galaxy gravitationally coupled to a rotating dark matter halo could in principle lead to bar formation in the halo in much the same way as a stellar disk forms a bar in its center. The presence of such halo bars (e.g., Bekki & Freeman 2003) could be inferred from the rotation pattern of gas in the disk, which would show the characteristic central twist in the iso-velocity lines of a velocity contour diagram (Bosma 1981). We note that the HI velocity distribution in the nearby BCD-like galaxy IC 10 (Wilcots & Miller 1998; see their Fig. 10) has twists and distortions in the center, and their tilted ring model for the rotation curve has sharp changes in the fitted inclinations and position angles of the inner disk when they force a circular rotation pattern (see their Fig. 5). Wilcots & Miller point out that a counter-rotating stream of HI in the outer part of IC 10 is a likely cause of the starburst, but the inner irregularities are interesting also as possible drivers of gas migration.
One tempting interpretation of the central concentration of gas in BCDs is that they have been affected by interactions with other galaxies sometime in the past. An interaction can strip angular momentum from the gas and stars and lead to overall disk contraction. The high gas density in the center then causes the starburst. For example, the ratio of R25 to increases from to if where is the shrinkage factor of an exponential disk that conserves mass. Our observations are consistent with for Im and for BCDs (cf. Fig. 6), in which case requires only a modest disk shrinkage. Theoretical models by Noguchi (1988) were among the first to show how amorphous galaxies with mass inflow can result from the interaction of two galaxies of comparable mass passing on parabolic orbits. This might also be consistent with the otherwise smooth distribution of the HI in BCDs (Simpson & Gottesman 2000).
Recent observations are consistent with this picture. Taylor, Brinks & Skillman (1993) and Taylor et al. (1995) found previously unknown companions or HI clouds around half of the HII galaxies they surveyed compared to a companion fraction of 1/4 among comparable LSB dwarfs (Taylor et al. 1996). Taylor (1997) concluded from this that the incidence of companions for HII region galaxies is twice that for LSB dwarfs, implying that the companions triggered starbursts in some cases. The Fornax Cluster galaxy FCC 35 is another example of a BCD with a nearby intergalactic HI cloud (Putman et al. 1998), and NGC 1569 and IC 10 are examples of starbursts with large HI clouds in their outer parts (Stil & Israel 1998, Wilcots & Miller 1998). Méndez & Esteban (2000) observed a high fraction of irregular WR galaxies with uncatalogued low surface brightness companions and suggested these companions were responsible for the starbursts. Similar conclusions were reached by Pustilnik’s group: Pustilnik et al. (2001a) suggested that % of the 86 BCDs in their survey had star formation triggered by faint visible companions or previous mergers. Pustilnik et al. (2001b) found that the BCD galaxy SBS 0335-052 is at a gas concentration in a giant HI cloud that also contains another BCD galaxy, and they suggested that the starbursts were triggered either by mutual interactions or by disturbances from a nearby giant galaxy. Pustilnik et al. (2003) also observed a faint, blue, low surface brightness dwarf within 11 kpc of the BCD galaxy HS 0822+3542, which was formerly thought to be isolated. Similarly, Bravo-Alfaro et al. (2004) suggested that the BCD galaxy Haro 4 was interacting with the nearby spiral Haro 26. Sometimes the evidence for an interaction is indirect. For example, the warp and disturbed velocity field (Cté, Carignan & Freeman 2000) of the BCD galaxy NGC 625 suggested a recent interaction to Cannon et al. (2003). Östlin et al. (2001) also found irregular H velocity fields and secondary dynamical components in the 6 BCDs they studied, and suggested these galaxies had mergers with gas-rich dwarfs or massive gas clouds.
Considering these recent discoveries, it is not surprising that BCD companions were hard to observe: most turn out to be very faint. For example, Telles & Maddox (2000) did not find a significant incidence of companions to HII galaxies in a plate-scanned survey of galaxies down to 20.5 mag in B-band, where the catalog was 90%-95% complete. The companions that are now implicated in BCD interactions are usually fainter than this limit, and fainter than our limit in Fig. 14. The faintness of triggering companions is probably reasonable, though. Most galaxies are dwarfs, so the most likely object to perturb any given galaxy is a dwarf. For large galaxies, these dwarf perturbations are indeed common but they do very little to enhance the star formation rate and gas concentration in the large galaxy. But for small galaxies, even a dwarf or HI cloud interaction can be significant, leading to angular momentum redistribution, mass inflow, and rapid star formation in a dense core. Thus the most likely significant disturbers of small galaxies are other small galaxies or small gas clouds.
Adding to the ambiguity of BCD origins is the likelihood that some interactions occurred long ago and the BCD has been bursting on and off regularly ever since. In a study of color-magnitude diagrams of BCDs, Schulte-Ladbeck, et al.(2001) found that there were no significant star formation gaps lasting longer than a few times 100 Myr over the last Gyr of evolution. Since the gas consumption time is Gyr, the interactions in some cases could have started this long ago (Lynds et al. 1998; Crone et al. 2002; Östlin et al. 2003). The primary remnant of these former interactions would simply be the low specific angular momentum of the present day disk; this would continue to drive starburst episodes as long as there is gas (e.g., van Zee, Salzer, & Skillman 2001). The low specific angular momentum of BCDs could also have resulted from the last big merger (Vitvitska et al. 2002), or from an old interaction that deformed the dark matter halo into a prolate spheroid, which then drove a disk response like a bar in a barred galaxy (Bekki & Freeman 2003).
Another possibility is an evolutionary scheme between dIm and BCDs. This has been proposed by Simpson & Gottesman (2000) in an optical and HI comparison of low surface brightness dIm and BCDs. The HI in numerous dIm takes on a ring-like morphology. The formation of these giant, sometimes galaxy-sized, rings would be easiest to explain as due to a starburst in the galaxy center that blew a very large hole in the gas. The energy requirements are reasonable for this explanation. Thus, an evolution of BCD to dIm as the gas reservoir expands and dissipates has some appeal. However, there is a problem with the lack of evidence for the presence of an aging starburst population in the center of the HI ring in at least one such system (see Simpson, Hunter, & Knezek 2004). Also, differences in the scale-length suggest that there must be some redistribution of the stellar component as well, and this leads us once again back to gravitational interactions.
5.3 Probability Distribution Functions
The high star formation rates and dense core structures of BCD galaxies (see Figures 15, 16, and 18) do not necessarily imply that the star formation processes differ much from those in Im and Sm types – only that the star formation regions crowd closer together in the BCD centers, producing smaller and higher luminosity densities. To compare the star formation processes in a global sense, we examined the probability density functions (pdf) of H emission for each galaxy. In a turbulent medium with isothermal density and pressure variations, as in an HII region, the gas density should have a pdf that is approximately log-normal (Ostriker, Gammie & Stone 1999; Klessen 2000; Ostriker et al. 2001; Li et al. 2003) and the column density should have a pdf that is log-normal too, although somewhat diluted by the average of unrelated density elements on the lines of sight (Padoan et al. 2000; Ostriker et al. 2001; Vázquez-Semadeni & García 2001). The width of the pdf increases with the Mach number of the turbulence (Padoan et al. 2000). For star formation triggered globally in turbulent shocks (Elmegreen 1993; see review in Mac Low & Klessen 2004), the H emission throughout a whole galaxy might be expected to follow this turbulent pdf too. We find this to be the case for all of our galaxies.
The pdfs for the H images of our galaxies are shown in Figure 21. We constructed them from a histogram of the H surface brightness of individual pixels in the H image within the region used in the ellipse photometry (Table 2). Pixels without H emission were rejected, but no cutoff was made for positive values of noise at the low count end. The surface brightness of each pixel was normalized to the azimuthally-averaged H surface brightness at that radius (for example, Figure 17) in order to remove the exponential disk.
Figure 21 is plotted on log-log axes so that a log-normal is an inverted parabola. All of the pdfs in fact have this shape, and they all have about the same FWHM too, although their absolute brightnesses vary from galaxy to galaxy. In some cases there is a lower cutoff in the surface brightness that limits the pdf to the upper half, but even then most pdfs resemble a log-normal in the plotted parts. Some have a slight excess at the highest surface brightness, giving the pdfs a flair on the lower right.
There is apparently no systematic difference in the H surface brightness pdfs for the various types of galaxies. The BCD pdfs look about the same as the Im and Sm pdfs. This implies that the Mach numbers of the turbulence in the ionized gas components are about the same, even though the areal densities of star formation are much higher in the BCDs. We conclude that the individual star formation regions are not intrinsically different in the various galaxy types, only that the regions are crowded more closely together in the BCDs. This crowding is not without consequences – it can lead to higher pressures and perhaps more massive clusters in proportion to the total star formation rate by the size of sample effect. But the expansion and turbulent speeds in BCD HII regions are not significantly higher than in other galaxies, and therefore the balance between pressurized triggering and spontaneous instabilities as causes of star formation is probably not much different either.
Appendix A Spectrophotometry of nebulae
Spectrophotometric observations with large apertures were obtained of several H ii regions in nearby galaxies in 1981 October and December. We used the cooled dual-beam Intensified Reticon Scanner (IRS) mounted on the No. 1 0.9 m telescope at Kitt Peak National Observatory. We used three gratings to cover from 3500 Å to 7450 Å with 4.5 Å spectral resolution. These observations were part of a program to observe stars for a stellar library, and the instrumentation, observations, and data reductions are discussed in more detail by Jacoby, Hunter, & Christian (1984). In Table 5 we present integrated spectrophotometry of the major emission-lines measured from spectra of H ii regions observed at that time. The H emission from NGC 604 was used to calibrate the H images presented in this paper.
Appendix B Determining the Star Formation Rate from LHα
Here we outline the derivation of the formula that we used to convert LHα to the star formation rate in solar-masses per year. There are three quantitative assumptions that enter the derivation. First, we assume that when stars form from a gas cloud, the number of stars is a power law that depends on the mass of the star. That is, the number of stars formed of mass is given by
| (B1) |
where the power law index is related to the “slope of the stellar initial mass function” as . Here we assume the Salpeter (1955) slope of .
Second, we assume an upper stellar mass limit of 100 M. We know that stars as massive as 150 M are found in very rich star-forming regions (Massey & Hunter 1998), but they are relatively rare, and integrating the stellar IMF to 100 M is consistent with the vast majority of star-forming regions found in galaxies. We also assume that the lower stellar mass limit is 0.1 M.
Third, we assume an efficiency factor of 2/3 for the absorption of ionizing photons by the nebula (Gallagher, Hunter, & Tutukov 1984). That is, 1/3 of the ionizing photons emitted by massive stars in H ii regions are absorbed by dust or escape the nebula, and 2/3 of the emitted photons result in H ii.
The number of ionizing photons per second implied by the flux from a nebula is
| (B2) |
where is the energy of the H photon and and are the recombination coefficients for Case B recombination. is given in Table 2.1 and in Table 4.4 of Osterbrock (1974). Table 4.4 also gives the ratio of the line intensity of H to H. Taking values for a nebular temperature of 104 K and density of 102 cm-3, we have
| (B3) |
Therefore, from the integrated LHα of the galaxy, we know the total number of ionizing photons required to ionize all of the H ii regions, and, if we account for losses, we know the total number of ionizing photons , in photons per second, being produced by massive stars in the galaxy:
| (B4) |
The ionized gas is produced by stars with masses 18 M to 100 M. The number of stars between 18 M and 100 M is, therefore,
| (B5) |
where is the average number of ionizing photons produced per star. The number of stars between 18 M and 100 M is also given by the IMF:
| (B6) |
and the total mass in stars is given by
| (B7) |
Thus,
| (B8) |
To put this altogether, we need the weighted average output per star, where we weight by the IMF and by the Hydrogen-burning lifetime of the star. is higher the more massive the star is, but the number of stars go down and the lifetime is shorter as the mass goes up. We have used the data compiled by Panagia (1973) to determine as a function of the mass of the star. Below a mass of 18 M drops precipitously, so we consider only stars with masses greater than or equal to 18 M as contributing to the ionization of the H ii regions. A fit to the data of Panagia yields
We use the data of Schaerer et al. (1993) for the Hydrogen-burning lifetimes of massive stars at a , a metallicity representative of many Im galaxies. A parameterization of the lifetime as function of the mass of the star is given by
where is in years. The IMF- and -weighted average is given by
| (B9) |
now integrated over the lifetimes of these stars. If we convert from photons s-1 to photons yr-1, we have the star formation rate
| (B10) |
This star formation rate formula differs from others we have used in the past. It yields that are a factor of 1.2 lower than rates given by the formula of Hunter & Gallagher (1986) and 1.8 times lower than those of Gallagher et al. (1984). This formulation yields star formation rates that are 14% higher than those used by Kennicutt (1998), a factor of 10 lower than those determined by Gil de Paz et al. (2000), and 40% higher than numbers determined by Brinchmann et al. (2004) for the integrated galactic mass of a typical galaxy in our sample (their Figure 7).
| Nearest NeighborffNearest galaxy within 1 Mpc in the plane of the sky and 150 km s-1. Distance to the galaxy was taken as a combination of apparent distance on the sky and radial distance with a Hubble constant of 65 km s-1 Mpc-1. The search used NED. | ||||||||
|---|---|---|---|---|---|---|---|---|
| D | d | Vr | ||||||
| Galaxy | Other NamesaaThis does not include all possible identifications. Identifications were obtained from NED. | TypebbMorphological Hubble types are from de Vaucouleurs et al. (1991). If no type is given there, we have used types given by NED. | (Mpc) | RefccReference for the distance to the galaxy. If no reference is given, the distance was determined from VGSR given by de Vaucouleurs et al. (1991) and a Hubble constant of 65 km s-1 Mpc-1. | E(BV)fddForeground reddening from Burstein & Heiles (1984). | (kpc) | (km/s) | Neighbor |
| Im Galaxies: | ||||||||
| A100410 | PGC 29428, UGC 5456, | I0? | 6.5 | 0.01 | 570 | 13 | UGC 5288 (Sdm:) | |
| IRASF100461036 | ||||||||
| A222833 | PGC 69019, UGC 12060, | IBm | 16.9 | 0.01 | 1545 | 98 | NGC 7320 (Sd) | |
| IRASF222823334 | ||||||||
| CVnIdwA | UGCA 292 | Im? | 4.1 | 15 | 0.01 | 260 | 2 | UGC 7605 (Im) |
| D508-2 | LSBC F508-V01 | Im | 29.9 | 0.00 | 2260 | 103 | KISSB 109 (-) | |
| D575-5 | LSBC F575-03 | dI | 6.2 | 0.03 | 730 | 5 | IC 798 (E0) | |
| D634-3 | dI | 3.2 | 0.03 | 920 | 17 | DDO 70 (Im) | ||
| D646-8 | Im | 31.7 | 0.01 | 2110 | 113 | UGC 8114 (Sc) | ||
| DDO 9 | PGC 4202, UGC 731, | Im: | 12.5 | 0.18 | 810 | 1 | NGC 278 (Sb) | |
| A010749 | ||||||||
| DDO 22 | PGC 9702, UGC 2014, | Im: | 10.5 | 0.05 | 400 | 13 | DDO 24 (Im) | |
| A022938 | ||||||||
| DDO 24 | PGC 9759, UGC 2034, | Im | 10.8 | 0.05 | 400 | 13 | DDO 22 (Im:) | |
| A023040 | ||||||||
| DDO 25 | PGC 9726, UGC 2023, | Im: | 11.0 | 0.09 | 400 | 6 | NGC 959 (Sdm:) | |
| A023033, IRASF023023316 | ||||||||
| DDO 26 | PGC 9808, UGC 2053, | Im | 17.3 | 0.09 | 730 | 42 | NGC 1012 (S0/a) | |
| A023129 | ||||||||
| DDO 27 | PGC 10117, UGC 2162, | IB(s)m | 18.4 | 0.01 | 2750 | 26 | NGC 1073 (Sc) | |
| A023701 | ||||||||
| DDO 33 | PGC 16030, UGC 3144, | IBm | 27.4 | 0.14 | 1580 | 75 | KUG0406748 (S0) | |
| A044174 | ||||||||
| DDO 34 | PGC 16059, UGC 3174, | IAB(s)m: | 9.2 | 0.08 | 920 | 47 | NGC 1637 (Sc) | |
| A044600 | ||||||||
| DDO 35 | PGC 16644, UGC 3234, | Im: | 21.1 | 0.38 | ||||
| A050016 | ||||||||
| DDO 38 | PGC 17445, UGC 3317, | Im | 21.2 | 0.12 | 1525 | 97 | KUG0539735 (Sa) | |
| A052773 | ||||||||
| DDO 39 | PGC 18121, UGC 3371, | Im: | 14.7 | 0.12 | 825 | 24 | Mrk 5 (I?) | |
| A054975, Mailyan 011 | ||||||||
| DDO 40 | PGC 20116, UGC 3647, | IBm | 22.3 | 0.04 | 1080 | 55 | UGC 3574 (Scd) | |
| A070056, IRASF070075635 | ||||||||
| DDO 43 | PGC 21073, UGC 3860, | Im | 5.5 | 0.05 | 270 | 7 | DDO 46 (Im) | |
| A072440, KIG 0190 | ||||||||
| DDO 46 | PGC 21585, UGC 3966, | Im | 5.5 | 0.05 | 270 | 7 | DDO 43 (Im) | |
| A073840 | ||||||||
| DDO 47 | PGC 21600, UGC 3974, | IB(s)m | 5.2 | 16 | 0.02 | 1060 | 42 | UGC 3755 (Im) |
| A073916 | ||||||||
| DDO 50 | PGC 23324, UGC 4305, | Im | 3.4 | 14 | 0.02 | 110 | 1 | UGC 4483 (Im:) |
| A081370, Holmberg II, | ||||||||
| VIIZw223, KIG 0239, | ||||||||
| KUG 0814708, | ||||||||
| IRASF081407052 | ||||||||
| DDO 52 | PGC 23769, UGC 4426, | Im: | 6.0 | 0.03 | 880 | 46 | NGC 2537A (Sc) | |
| A082542 | ||||||||
| DDO 53 | PGC 24050, UGC 4459, | Im | 3.6 | 14 | 0.03 | 520 | 16 | NGC 2976 (Sc) |
| A082966, VIIZw238, | ||||||||
| VV 499, IRASF082956621 | ||||||||
| DDO 63 | PGC 27605, Holmberg I, | IAB(s)m | 3.8 | 14 | 0.01 | 620 | 30 | M81dwA (Im) |
| UGC 5139, KDG 057, | ||||||||
| A093671, Mailyan 044 | ||||||||
| DDO 64 | PGC 28317, UGC 5272, | Im | 7.4 | 0.01 | 290 | 15 | UGC 5209 (Im) | |
| A094731, KUG 0947317, | ||||||||
| IRASF094743143 | ||||||||
| DDO 68 | PGC 28714, UGC 5340, | ImP: | 7.0 | 0.01 | 235 | 5 | UGC 5427 (Sdm:) | |
| A095329, VV 542 | ||||||||
| DDO 69 | PGC 28868, UGC 5364, | IBm | 0.8 | 5 | 0.00 | 800 | 19 | Milky Way (Sbc) |
| A095630, Leo A, Leo III | ||||||||
| DDO 70 | PGC 28913, UGC 5373, | IB(s)m | 1.3 | 22 | 0.01 | 300 | 16 | Leo I (dSph) |
| A095705, Sextans B, | ||||||||
| KIG 0388 | ||||||||
| DDO 75 | PGC 29653, UGCA 205, | IB(s)m | 1.3 | 6 | 0.02 | 430 | 23 | DDO 70 (Im) |
| A100804, Sextans A, | ||||||||
| IRASF100850427 | ||||||||
| DDO 86 | PGC 32048, UGC 5846, | Im | 16.9 | 0.00 | 860 | 9 | NGC 3359 (Sc) | |
| A104160, Mailyan 057 | ||||||||
| DDO 87 | PGC 32405, UGC 5918, | Im: | 6.7 | 0.00 | 760 | 10 | UGC 5423 (Im) | |
| KDG 072, A104665, VIIZw347 | ||||||||
| DDO 99 | PGC 37050, UGC 6817, | Im | 4.1 | 0.00 | 390 | 2 | NGC 4244 (Scd:) | |
| A114839 | ||||||||
| DDO 101 | PGC 37449, UGC 6900, | Im: | 9.0 | 0.01 | 370 | 10 | Mrk 757 (S0?) | |
| A115331 | ||||||||
| DDO 105 | PGC 37689, UGC 6955, | IB(s)m: | 14.3 | 0.00 | 395 | 14 | NGC 3930 (Sc) | |
| A115538 | ||||||||
| DDO 115 | PGC 39142, UGC 7254, IC 3059 | Im: | 3.2 | 0.00 | 430 | 28 | NGC 4222 (Sc) | |
| DDO 120 | PGC 39918, UGC 7408, | IAm | 8.0 | 0.00 | 490 | 28 | NGC 4460 (S0?) | |
| A121846 | ||||||||
| DDO 125 | PGC 40904, UGC 7577, | Im | 2.5 | 22 | 0.00 | 385 | 4 | DDO 168 (Im) |
| A122543 | ||||||||
| DDO 126 | PGC 40791, UGC 7559, | IBm | 4.9 | 15 | 0.00 | 270 | 11 | HS12133636B (dS) |
| A122437 | ||||||||
| DDO 133 | PGC 41636, UGC 7698, | Im | 6.1 | 20 | 0.00 | 410 | 24 | CVnIdwA (Im) |
| A123031 | ||||||||
| DDO 143 | PGC 42901, UGC 7916, VV 127, | Im | 9.8 | 0.00 | 710 | 39 | NGC 4656 (Gpair) | |
| IZw42, A124234 | ||||||||
| DDO 154 | PGC 43869, UGC 8024, | IBsm | 4.3 | 20 | 0.01 | 820 | 43 | DDO 133 (Im) |
| NGC 4789A | ||||||||
| DDO 155 | PGC 44491, UGC 8091, GR8, | Im | 2.2 | 3,26 | 0.01 | 220 | 8 | IC 809 (E) |
| A125614, VV 558, | ||||||||
| LSBC D646-07 | ||||||||
| DDO 165 | PGC 45372, UGC 8201, | Im | 4.8 | 10 | 0.01 | 590 | 37 | NGC 4236 (Sdm) |
| A130467, IIZw499, | ||||||||
| Mailyan 82 | ||||||||
| DDO 167 | PGC 45939, UGC 8308, | Im | 4.2 | 15 | 0.00 | 430 | 28 | DDO 168 (Im) |
| A131146 | ||||||||
| DDO 168 | PGC 46039, UGC 8320, | IBm | 3.5 | 0.00 | 410 | 26 | UGC 8215 (Im) | |
| A131246 | ||||||||
| DDO 169 | PGC 46127, UGC 8331, | IAm | 5.3 | 0.00 | 660 | 42 | UGC 8215 (Im) | |
| A131347 | ||||||||
| DDO 171 | PGC 46382, A131608 | Im | 18.7 | 0.02 | 1180 | 23 | NGC 4948 (Sdm) | |
| DDO 183 | PGC 49158, UGC 8760, | Im | 5.1 | 20 | 0.00 | 330 | 8 | DDO 181 (Im) |
| A134838 | ||||||||
| DDO 185 | PGC 49448, UGC 8837, | IB(s)msp | 4.0 | 0.00 | 745 | 6 | UGC 9240 (Im) | |
| A135254, Holmberg IV | ||||||||
| DDO 187 | PGC 50961, UGC 9128, | Im | 2.5 | 2 | 0.00 | 920 | 39 | UGC 8760 (Sdm) |
| A141323 | ||||||||
| DDO 210 | PGC 65367, Aquarius Dwarf, | IB(s)m | 0.9 | 17 | 0.03 | 900 | 23 | Milky Way (Sbc) |
| A204413 | ||||||||
| DDO 215 | PGC 69415, UGCA 433, | Im: | 14.7 | 0.03 | 920 | 59 | NGC 7351 (S0) | |
| A223605 | ||||||||
| DDO 216 | PGC 71538, UGC 12613, | Im | 0.9 | 1,8 | 0.02 | 450 | 117 | M31 (Sb) |
| A232614, Peg DIG, | ||||||||
| Pegasus Dwarf | ||||||||
| DDO 220 | PGC 72494, UGC 12791, | Im: | 14.9 | 0.03 | 690 | 41 | NGC 7741 (Scd) | |
| A234625 | ||||||||
| F533-1 | Im | 22.7 | 0.11 | 640 | 35 | UGC 12029 (Im:) | ||
| F563-V1 | LSBC D563-03 | dI | 58.0 | 0.03 | 1440 | 89 | NGC 2667 (-) | |
| F563-V2 | LSBC D563-02 | Irr | 71.0 | 0.04 | 840 | 48 | UGC 4657 (Sb) | |
| F564-V3 | LSBC D564-08 | dI | 6.2 | 0.02 | 480 | 10 | F565-V1 (dI) | |
| F565-V1 | LSBC D565-06 | dI | 6.3 | 0.04 | 480 | 10 | F564-V3 (dI) | |
| F565-V2 | dI | 55.0 | 0.02 | 960 | 49 | NGC 2916 (Sb?) | ||
| F608-1 | PGC 1124, UGC 159 | Im: | 17.7 | 0.02 | 1040 | 31 | UGC 31 (Im) | |
| F615-1 | dI | 13.5 | 0.07 | 565 | 34 | UGC 2168 (Im:) | ||
| F651-2 | dI/Im | 28.1 | 0.01 | 800 | 22 | CGCG076047 (-) | ||
| F721-V2 | LSBC D721-10 | dI | 18.6 | 0.01 | 730 | 9 | UGC 8995 (Sdm) | |
| F750-V1 | Irr | 16.7 | 0.04 | 1740 | 66 | UGC 17 (Sm:) | ||
| IC 10 | PGC 1305, UGC 192, | IBm? | 1.0 | 11,21 | 0.75 | 250 | 48 | M31 (Sb) |
| IRAS001775900 | ||||||||
| IC 1613 | PGC 3844, UGC 668, DDO 8, | IB(s)m | 0.7 | 7 | 0.00 | 400 | 60 | M33 (Sc) |
| IRASF010240153 | ||||||||
| IC 4662 | PGC 60851, He2-269, | IBm | 3.0 | 0.07 | ||||
| IRASF174226437, | ||||||||
| HIPASS J1747-64, | ||||||||
| ESO 1742126437.3 | ||||||||
| LGS 3 | PGC 3792, Pisces dwarf | I? | 0.6 | 23 | 0.04 | 280 | 23 | M31 (Sb) |
| M81dwA | PGC 23521, KDG 052 | I? | 3.6 | 7 | 0.02 | 370 | 13 | NGC 2366 (Im) |
| NGC 1156 | PGC 11329, UGC 2455, | IB(s)m | 7.8 | 13 | 0.17 | 590 | 36 | LEDA169969 (-) |
| KIG 0121, VV 531, | ||||||||
| IRASF025672502 | ||||||||
| NGC 1569 | PGC 15345, UGC 3056, | IBm | 2.5 | 25 | 0.51 | 500 | 23 | Cam A (Irr) |
| Arp 210, VIIZw16, | ||||||||
| IRASF042606444 | ||||||||
| NGC 2101 | PGC 17793, IRASF054525206 | IB(s)mP | 15.2 | 0.00 | 680 | 43 | NGC 2104 (Scd) | |
| NGC 2366 | PGC 21102, UGC 3851, | IB(s)m | 3.2 | 14 | 0.04 | 520 | 31 | NGC 2403 (Scd) |
| DDO 42, IRASF072346917 | ||||||||
| NGC 3413 | PGC 32543, UGC 5960, | S0sp | 9.6 | 0.00 | 480 | 16 | DDO 84 (Im) | |
| CG 0790, KUG 1048330, | ||||||||
| IRASF104853301 | ||||||||
| NGC 3738 | PGC 35856, UGC 6565, | Im | 4.9 | 15 | 0.00 | 490 | 19 | NGC 4068 (Im) |
| Arp 234, KUG 1133548, | ||||||||
| IRASF113305448 | ||||||||
| NGC 3952 | PGC 37285, IRASF115110343 | IBm:sp | 22.4 | 0.01 | 235 | 13 | IC 2969 (Sbc) | |
| NGC 4163 | PGC 38881, NGC 4167, | IAm | 2.8 | 0.00 | 610 | 31 | DDO 125 (Im) | |
| UGC 7199, CG 0891, | ||||||||
| KUG 1209364 | ||||||||
| NGC 4214 | PGC 39225, UGC 7278, | IAB(s)m | 2.9 | 19 | 0.00 | 110 | 7 | DDO 113 (Im) |
| KUG 1213366, | ||||||||
| IRASF121313636 | ||||||||
| NGC 6822 | PGC 63616, IC 4895, | IB(s)m | 0.5 | 9 | 0.22 | 500 | 44 | Milky Way (Sbc) |
| DDO 209, Barnard’s Galaxy, | ||||||||
| IRASF194201450 | ||||||||
| SagDIG | PGC 63287, Lowal’s Object, | IB(s)m: | 1.1 | 12,18 | 0.14 | 1100 | 8 | Milky Way (Sbc) |
| ESO 1927081747.0 | ||||||||
| UGC 199 | PGC 1336 | Im: | 29.8 | 0.04 | 2280 | 137 | UGC 132 (Sdm) | |
| UGC 5209 | PGC 27935 | Im | 7.8 | 0.00 | 250 | 13 | UGC 5196 (Im) | |
| UGC 8011 | PGC 43654, VIIIZw216, | Im | 11.6 | 0.04 | 1580 | 87 | F574-10 (Sd) | |
| LSBC D575-02 | ||||||||
| UGC 8055 | PGC 44102 | Im | 8.5 | 0.00 | 620 | 34 | NGC 4173 (Sd) | |
| UGC 8276 | PGC 45840 | Im: | 13.3 | 0.00 | 480 | 17 | UGC 8285 (Sdm) | |
| UGC 8508 | PGC 47495, IZw60 | IAm | 2.6 | 0.00 | 670 | 6 | UGC 7242 (Scd:) | |
| UGC 10140 | PGC 56745, LSBC D584-02 | Im: | 41.9 | 0.02 | 1570 | 102 | UGCA 411 (Pec) | |
| UGC 10281 | PGC 57522, LSBC D656-02 | Im: | 18.3 | 0.03 | ||||
| WLM | PGC 143, UGCA 444, | IB(s)m | 1.0 | 4,24 | 0.02 | 900 | 58 | M33 (Sc) |
| DDO 221, A235915, | ||||||||
| Wolf-Lundmark-Melott | ||||||||
| 0467074 | 2dFGRS N293Z129, | Irr | 107.9 | 0.03 | 2020 | 113 | 2dFGRSN294Z233 (-) | |
| ISI96 10320121, | ||||||||
| APMUKS(BJ) | ||||||||
| B103250.07012138.4 | ||||||||
| 1397049 | ISI96 10510227, | Irr | 118.7 | 0.02 | ||||
| APMUKS(BJ) | ||||||||
| B105147.14022734.5 | ||||||||
| BCD Galaxies: | ||||||||
| Haro 3 | PGC 32103, UGC 5860, | Sb?p | 15.5 | 0.00 | 1880 | 122 | UGC 5848 (Sm) | |
| NGC 3353, Mrk 35, | ||||||||
| IRASF104225613 | ||||||||
| Haro 4 | PGC 33486, UGCA 225, | BCD | 9.5 | 0.00 | 560 | 35 | NGC 3486 (Sc) | |
| Mrk 36, A110229, | ||||||||
| KUG 1102294, CG 82, | ||||||||
| IRASF110222924 | ||||||||
| Haro 8 | PGC 39628, UGC 7354, | Ep: | 22.2 | 0.00 | 670 | 10 | NGC 4266 (Sa?) | |
| Mrk 49, A121604, | ||||||||
| Mrk 1318, VCC 324, | ||||||||
| IRASF121660407 | ||||||||
| Haro 14 | PGC 2675, UGCA 010, | S0p? | 15.1 | 0.01 | ||||
| NGC 244, VV 728, | ||||||||
| IRASF004321552 | ||||||||
| Haro 20 | PGC 12922, UGCA 073, | E? | 27.6 | 0.03 | 670 | 7 | UGCA 71 (Sd) | |
| A032517, | ||||||||
| IRASF032601735 | ||||||||
| Haro 23 | PGC 29347, UGCA 201, | S? | 20.2 | 0.01 | 540 | 15 | UGC 5478 (Im) | |
| A100329, CG 0050, | ||||||||
| IRASF100342911 | ||||||||
| Haro 29 | PGC 40665, UGCA 281, | S? | 5.4 | 0.00 | 410 | 16 | NGC 4144 (Scd?) | |
| Mrk 209, A122348, | ||||||||
| IZw36 | ||||||||
| Haro 36 | PGC 43124, UGC 7950, | Im | 9.0 | 0.00 | 530 | 34 | DDO 150 (Sm:) | |
| A124451 | ||||||||
| Haro 38 | PGC 47938, UGC 8578, | S? | 13.7 | 0.00 | 1680 | 105 | Mrk 67 (Im) | |
| A133329, KUG 1333294 | ||||||||
| Haro 43 | PGC 52193 | S? | 30.5 | 0.01 | ||||
| HS08223542 | BCG | 10.9 | 0.04 | |||||
| Mrk 5 | PGC 19459, UGCA 130, | I? | 14.3 | 0.08 | 825 | 24 | DDO 39 (Im:) | |
| A063575, KUG 0635756, | ||||||||
| IRASF06353754 | ||||||||
| Mrk 16 | PGC 24949, UGCA 146, | 37.6 | 0.02 | 1050 | 58 | NGC 2634 (E1:) | ||
| A084773, | ||||||||
| IRASF084797322 | ||||||||
| Mrk 32 | PGC 30715, UGCA 211, | P | 13.8 | 0.00 | 610 | 12 | UGC 5848 (Sm:) | |
| A102356 | ||||||||
| Mrk 67 | PGC 48501, UGCA 372, | BCD | 15.5 | 0.00 | 1680 | 105 | Haro 38 (S?) | |
| KUG 1339307, A133930, | ||||||||
| IRASF133963046 | ||||||||
| Mrk 178 | PGC 35684, UGC 6541, | Im | 3.9 | 15 | 0.00 | 410 | 20 | NGC 3741 (Im) |
| A113049 | ||||||||
| Mrk 408 | PGC 28169, A094533, | 23.3 | 0.00 | 300 | 6 | UGC 5282 (Sm:) | ||
| CG 0289, KUG0945331, | ||||||||
| IRASF094513306 | ||||||||
| Mrk 600 | PGC 10813, A024804, | SBb/BCD | 15.7 | 0.05 | 370 | 17 | UGC 2275 (Sm) | |
| IRASZ024840414 | ||||||||
| Mrk 757 | PGC 38277, KUG1202311, | S0? | 8.9 | 0.01 | 200 | 12 | NRGb181.11 (-) | |
| CG0150 | ||||||||
| NGC 1705 | PGC 16282, IRASF04530-5326 | SA0-P: | 5.1 | 27 | 0.04 | 990 | 34 | PGC 72675 (Im) |
| NGC 6789 | PGC 63000, UGC 11425 | Im | 3.6 | 0.08 | ||||
| SBS1415437 | PGC 51017, CG 0389 | BCG | 10.9 | 0.00 | 920 | 54 | NGC 5608 (Im) | |
| UGCA 290 | Arp211, VV042b | 2.8 | 20 | 0.00 | 230 | 5 | PGC 41314 (Im) | |
| IZw115 | PGC 55381, UGC 9893, | P | 12.3 | 0.01 | ||||
| VV 720, A153146, KIG 686 | ||||||||
| VIIZw403 | PGC 35286, UGC 6456, | Pec | 4.4 | 22 | 0.02 | 900 | 32 | KDG073 (Im) |
| A112479, VV 574, | ||||||||
| IRASF112467916 | ||||||||
| Zw2335 | PGC 71938, UGCA 441, | E? | 24.1 | 0.05 | ||||
| A233529, Barbon’s Galaxy, | ||||||||
| Mrk 328, KIG 1031, | ||||||||
| IRASF233522951 | ||||||||
| Sm Galaxies: | ||||||||
| DDO 18 | PGC 8332, UGC 1670, | Sm | 25.4 | 0.04 | 280 | 18 | UGC 1677 (Sd) | |
| A020806 | ||||||||
| DDO 48 | PGC 22369, UGC 4121, | Sm: | 17.8 | 0.03 | 1160 | 53 | NGC 2549 (S0) | |
| A075458 | ||||||||
| DDO 54 | PGC 25679, UGC 4797, | Sm: | 18.0 | 0.03 | 810 | 46 | NGC 2775 (Sab) | |
| A090506 | ||||||||
| DDO 88 | PGC 32226, UGC 5889, | SAB(s)m | 7.4 | 0.01 | 30 | 1 | LEDA 83341 (Im) | |
| NGC 3377A | ||||||||
| DDO 122 | PGC 40367, UGC 7490, | SAm | 9.2 | 0.00 | 370 | 7 | UGC 7748 (Sdm:) | |
| Mailyan 073, | ||||||||
| IRASF122237037 | ||||||||
| DDO 135 | PGC 41746, UGC 7713, | SAB(s)m | 3.4 | 0.02 | 250 | 10 | VCC 0413 (Im) | |
| NGC 4523, VCC 1524, | ||||||||
| IRASF123131526 | ||||||||
| DDO 150 | PGC 43255, UGC 7971, | Sm: | 8.5 | 0.00 | 530 | 34 | Haro 36 (Im) | |
| NGC 4707, IZw43 | ||||||||
| DDO 173 | PGC 46563, UGC 8385, | SABm | 16.9 | 0.00 | 650 | 23 | UGC 8298 (Im) | |
| A131810 | ||||||||
| DDO 180 | PGC 48179, A133509, | SB(s)m | 18.8 | 0.03 | 1640 | 7 | DDO 171 (Im) | |
| IRASF133550932 | ||||||||
| DDO 204 | PGC 57678, UGC 10310, | SB(s)m | 13.5 | 0.00 | 690 | 45 | HS16144709 (BCG?) | |
| A161447, Arp 2, | ||||||||
| IRASF161484710 | ||||||||
| DDO 214 | PGC 69293, A223303, | SA(s)m | 28.3 | 0.04 | 2005 | 64 | UGC 12151 (Im:) | |
| Arp 3 | ||||||||
| DDO 217 | PGC 71596, UGC 12632, | Sm: | 9.6 | 0.13 | 210 | 7 | UGC 12588 (Sdm) | |
| A232740 | ||||||||
| F561-1 | Sm | 72.0 | 0.04 | 790 | 17 | [ZBS97] A50 (?) | ||
| F567-2 | Sm | 86.0 | 0.03 | 1770 | 39 | UGC 5598 (S) | ||
| F583-1 | LSBC D584-04 | Sm/Irr | 37.0 | 0.03 | 1070 | 37 | NGC 6035 (Sc) | |
| NGC 2552 | PGC 23340, UGC 4325, | SA(s)m?a | 8.5 | 0.04 | 450 | 10 | NGC 2500 (Sd) | |
| IRASF081565010 | ||||||||
| NGC 3109 | PGC 29128, UGCA 194, | SB(s)msP | 1.3 | 22 | 0.04 | 440 | 19 | ESO497G003 (Sa:) |
| DDO 236 | ||||||||
| NGC 3510 | PGC 33408, UGC 6126, | SB(s)msP | 10.4 | 0.00 | 100 | 3 | UGC 6102 (Im) | |
| Haro 26, CG 80, | ||||||||
| KUG 1101291, | ||||||||
| IRASF110102909 | ||||||||
| UGC 5716 | PGC 31081, LSBC D500-02 | Sm: | 18.8 | 0.00 | 830 | 14 | UGC 5588 (S?) | |
| UGC 11820 | PGC 67421 | Sm | 19.9 | 0.08 | 1600 | 11 | UGC 11868 (Sm) | |
References. — (1) Aparicio 1994; (2) Aparicio, Tikhonov, & Karachentsev 2000; (3) Dohm-Palmer et al. 1998; (4) Dolphin 2000; (5) Dolphin et al. 2002; (6) Dolphin et al. 2003; (7) Freedman et al. 2001; (8) Gallagher et al. 1998; (9) Gallart, Aparicio, & Vilchez 1996; (10) Hidalgo, Marín-Franch, & Aparicio 2003; (11) Hunter 2001; (12) Karachentsev, Aparicio, & Makarova 1999; (13) Karachentsev, Musella, & Grimaldi 1996; (14) Karachentsev et al. 2002; (15) Karachentsev et al. 2003a; (16) Karachentsev et al. 2003b; (17) Lee et al. 1999; (18) Lee & Kim 2000; (19) Maiz-Apellaniz, Cieza, & Mackenty 2002; (20) Makarova et al. 1998; (21) Massey & Armandroff 1995; (22) Méndez et al. 2002; (23) Miller et al. 2001; (24) Minniti & Zijlstra 1997; (25) O’Connell et al. 1994; (26) Tolstoy et al. 1995; and (27) Tosi et al. 2001.
| Ellipse photometry parametersaaPosition angle PA, minor-to-major axis ratio , ellipse semi-major axis step size, and position of center used to do photometry in concentric ellipses. The PA given here has been corrected for the PA of the CCD camera on the sky, usually about 0.5°, but the PA appropriate to the image itself was used for the photometry. | ||||||||||||
|---|---|---|---|---|---|---|---|---|---|---|---|---|
| ExposuresddA () designates images taken under clear sky conditions to calibrate the other frames taken under non-photometric conditions. | SeeingeeFWHM of a stellar profile on the final combined H image. | Scale | PA | Step | Center (2000) | rmsffThe H surface brightness corresponding to the rms of one pixel in the original H image. | ||||||
| Galaxy | MosbbGalaxies that were, or were potentially, larger than the field of view were mosaiced. This column designates the relative pointing in the mosaic. A “C” designates the center. No entry means that the galaxy was not mosaiced. | Date | InstrccTelescope, instrument, and detector used for the H observations. Telescopes: PT1.8 m Perkins Telescope at Lowell Observatory; HT1.1 m Hall Telescope at Lowell Observatory; KPNO4mKitt Peak National Observatory 4 m telescope; CTIO1.5mCerro Tololo Inter-American Observatory 1.5 m telescope. Instruments: 4:14:1 focal reducer; FPOhio State University Fabry Perot used as a simple 3:1 focal reducer; those without a designation were direct cameras. Detectors: NCCDa TI CCD provided to Lowell Observatory by the National Science Foundation; NOTIa TI CCD on loan to Lowell Observatory from the US Naval Observatory, Flagstaff Station; 2048SITe CCD; MosKPNO Mosaic camera. | (s) | (″) | (″) | (°) | b/a | (″) | RA | DEC | (ergs/s/pc2) |
| Im Galaxies: | ||||||||||||
| A1004+10 | 9703 | PT,4:1,NOTI | 11800 | 3.4 | 0.43 | -33.3 | 0.63 | 9.1 | 10:07:19.6 | 10:21:47 | 32.48 | |
| A2228+33 | 9410 | PT,FP,NCCD | 21800 | 2.3 | 0.49 | 38.5 | 0.92 | 11.3 | 22:30:34.0 | 33:49:14 | 32.16 | |
| CVnIdwA | 0005 | HT,2048 | 31800 | 3.1 | 1.13 | 79.5 | 0.78 | 11.3 | 12:38:40.2 | 32:45:40 | 32.19 | |
| D508-2 | 0004 | HT,2048 | 31800 | 5.0 | 1.13 | 70.6 | 0.76 | 9.1 | 13:04:34.3 | 26:46:24 | 32.07 | |
| D575-5 | 9605 | PT,4:1,NCCD | 12700 | 2.0 | 0.41 | 55.2 | 0.51 | 9.1 | 12:55:41.0 | 19:12:35 | 32.32 | |
| D634-3 | 0001 | HT,2048 | 32700 | 3.7 | 1.13 | -9.4 | 0.76 | 5.7 | 9:08:53.8 | 14:35:03 | 32.04 | |
| D646-8 | 0004 | HT,2048 | 31800 | 4.5 | 1.13 | -32.4 | 0.62 | 5.7 | 12:52:03.9 | 12:54:26 | 32.00 | |
| DDO 9 | 9410 | PT,FP,NCCD | 21800 | 2.2 | 0.49 | 87.5 | 0.49 | 11.3 | 1:10:43.4 | 49:36:02 | 32.24 | |
| DDO 22 | 9410 | PT,FP,NCCD | 11800 | 1.8 | 0.49 | -6.6 | 0.38 | 11.3 | 2:32:54.1 | 38:40:51 | 32.37 | |
| DDO 24 | 9410 | PT,FP,NCCD | 22700 | 2.0 | 0.49 | 0.1 | 0.93 | 11.3 | 2:33:43.2 | 40:31:51 | 32.21 | |
| DDO 25 | 9410 | PT,FP,NCCD | 11800 | 2.1 | 0.49 | -56.3 | 0.88 | 11.3 | 2:33:18.5 | 33:29:26 | 32.38 | |
| 9502 | PT,FP,NCCD | 22700 | ||||||||||
| DDO 26 | 9410 | PT,FP,NCCD | 32700 | 2.1 | 0.49 | 34.1 | 0.39 | 8.4 | 2:34:29.2 | 29:45:04 | 32.11 | |
| DDO 27 | 9410 | PT,FP,NCCD | 33000 | 1.8 | 0.49 | -51.5 | 0.61 | 9.1 | 2:40:22.7 | 1:13:54 | 32.08 | |
| DDO 33 | 9410 | PT,FP,NCCD | 11800 | 2.3 | 0.49 | -68.6 | 0.61 | 11.3 | 4:47:59.7 | 74:55:42 | 32.40 | |
| DDO 34 | 9502 | PT,FP,NCCD | 23000 | 2.1 | 0.49 | -82.7 | 0.42 | 9.1 | 4:48:34.2 | 00:14:30 | 32.54 | |
| DDO 35 | 9410 | PT,FP,NCCD | 21800 | 2.1 | 0.49 | 62.7 | 0.77 | 11.3 | 5:03:24.0 | 16:24:18 | 32.27 | |
| DDO 38 | 9410 | PT,FP,NCCD | 12700 | 1.9 | 0.49 | -34.5 | 0.66 | 8.4 | 5:33:37.0 | 73:43:27 | 32.08 | |
| DDO 39 | 9502 | PT,FP,NCCD | 32700 | 2.0 | 0.49 | -43.4 | 0.61 | 11.3 | 5:56:34.1 | 75:18:57 | 32.11 | |
| DDO 40 | 9410 | PT,FP,NCCD | 12400 | 1.7 | 0.49 | -48.3 | 0.78 | 11.3 | 7:04:51.2 | 56:31:09 | 32.13 | |
| DDO 43 | 9502 | PT,FP,NCCD | 33000 | 1.7 | 0.49 | 6.1 | 0.70 | 11.3 | 7:28:17.8 | 40:46:13 | 32.06 | |
| DDO 46 | 9502 | PT,FP,NCCD | 33000 | 1.5 | 0.49 | 83.6 | 0.89 | 11.3 | 7:41:26.6 | 40:06:39 | 32.09 | |
| DDO 47 | C | 9502 | PT,FP,NCCD | 23000 | 1.6 | 0.49 | -70.4 | 0.51 | 11.3 | 7:41:55.3 | 16:48:08 | 32.10 |
| W | 9502 | PT,FP,NCCD | 23000 | |||||||||
| E | 9502 | PT,FP,NCCD | 13000 | |||||||||
| N | 9502 | PT,FP,NCCD | 23000 | |||||||||
| DDO 50 | C | 9702 | PT,4:1,NOTI | 11800 | 1.6 | 0.43 | 18.1 | 0.72 | 11.3 | 8:19:08.7 | 70:43:25 | 32.39 |
| 9702 | PT,4:1,NOTI | (1 900) | ||||||||||
| N | 9702 | PT,4:1,NOTI | 11800 | |||||||||
| S | 9702 | PT,4:1,NOTI | 11800 | |||||||||
| W | 9702 | PT,4:1,NOTI | 11800 | |||||||||
| E | 9702 | PT,4:1,NOTI | 11800 | |||||||||
| DDO 52 | 9703 | PT,4:1,NOTI | 22700 | 3.2 | 0.43 | 4.5 | 0.67 | 11.3 | 8:28:28.5 | 41:51:21 | 32.25 | |
| DDO 53 | 9504 | PT,FP,NCCD | 12200 | 1.9 | 0.49 | 81.0 | 0.51 | 8.4 | 8:34:08.0 | 66:10:37 | 32.13 | |
| DDO 63 | 0005 | HT,2048 | 31800 | 3.2 | 1.13 | -0.2 | 1.00 | 11.3 | 9:40:30.4 | 71:11:02 | 32.16 | |
| DDO 64 | 9201 | PT,FP,NCCD | 13000 | 2.0 | 0.50 | -63.9 | 0.32 | 11.3 | 9:50:22.4 | 31:29:16 | 32.54 | |
| DDO 68 | 9201 | PT,FP,NCCD | 13000 | 2.3 | 0.50 | 16.5 | 0.50 | 8.4 | 9:56:45.8 | 28:49:34 | 32.54 | |
| DDO 69 | C | 9201 | PT,FP,NCCD | 13000 | 1.8 | 0.49 | -64.4 | 0.56 | 17.0 | 9:59:25.0 | 30:44:42 | 31.77 |
| N | 9201 | PT,FP,NCCD | 21500 | |||||||||
| E | 9502 | PT,FP,NCCD | 23000 | |||||||||
| W | 9502 | PT,FP,NCCD | 23000 | |||||||||
| DDO 70 | 9703 | PT,4:1,NOTI | 21800 | 2.0 | 0.43 | 87.6 | 0.59 | 17.0 | 10:00:00.9 | 5:19:51 | 32.37 | |
| DDO 75 | C | 9403 | PT,FP,NCCD | 31800 | 2.0 | 0.49 | 41.8 | 0.85 | 13.7 | 10:10:59.2 | -04:41:56 | 32.30 |
| NE | 9503 | PT,FP,NCCD | 31800 | |||||||||
| N | 9503 | PT,FP,NCCD | 11800 | |||||||||
| W | 9504 | PT,FP,NCCD | 31800 | |||||||||
| DDO 86 | 9405 | PT,FP,NCCD | 22300 | 2.0 | 0.49 | 71.8 | 0.82 | 11.3 | 10:44:29.0 | 60:21:58 | 32.35 | |
| PT,FP,NCCD | (2 600) | |||||||||||
| DDO 87 | 9502 | PT,FP,NCCD | 33000 | 2.1 | 0.49 | 76.4 | 0.58 | 11.3 | 10:49:34.7 | 65:31:46 | 32.10 | |
| DDO 99 | 0005 | HT,2048 | 31800 | 3.1 | 1.13 | 51.5 | 0.49 | 11.3 | 11:50:52.6 | 38:52:41 | 32.13 | |
| DDO 101 | 9405 | PT,FP,NCCD | 22400 | 1.8 | 0.49 | -69.4 | 0.69 | 11.3 | 11:55:39.4 | 31:31:08 | 32.21 | |
| DDO 105 | 9502 | PT,FP,NCCD | 33000 | 1.6 | 0.49 | 63.6 | 0.43 | 11.3 | 11:58:29.0 | 38:04:29 | 31.98 | |
| DDO 115 | 9502 | PT,FP,NCCD | 13000 | 1.6 | 0.49 | 8.0 | 0.69 | 9.1 | 12:14:55.1 | 13:27:39 | 32.06 | |
| DDO 120 | 9405 | PT,FP,NCCD | 31800 | 1.9 | 0.49 | 86.5 | 0.68 | 11.3 | 12:21:15.8 | 45:48:46 | 32.57 | |
| DDO 125 | 9605 | PT,4:1,NCCD | 12400 | 1.8 | 0.41 | -46.2 | 0.58 | 8.3 | 12:27:41.9 | 43:29:34 | 32.36 | |
| 9703 | PT,4:1,NOTI | (11800) | ||||||||||
| DDO 126 | 9702 | PT,4:1,NOTI | 31800 | 1.9 | 0.43 | -41.4 | 0.47 | 11.3 | 12:27:06.5 | 37:08:23 | 32.37 | |
| 9802 | PT,4:1,NOTI | (11800) | ||||||||||
| DDO 133 | C | 9504 | PT,FP,NCCD | 22700 | 2.3 | 0.49 | -6.4 | 0.69 | 11.3 | 12:32:55.4 | 31:32:14 | 31.87 |
| NW | 9504 | PT,FP,NCCD | 12700 | |||||||||
| DDO 143 | 0005 | HT,2048 | 31800 | 4.1 | 1.13 | -3.5 | 0.31 | 11.3 | 12:44:24.9 | 34:23:23 | 32.23 | |
| DDO 154 | 9604 | PT,4:1,NCCD | 11800 | 2.3 | 0.41 | 45.6 | 0.50 | 11.3 | 12:54:06.2 | 27:09:03 | 32.31 | |
| 9605 | PT,4:1,NCCD | 12700 | ||||||||||
| DDO 155 | 9605 | PT,4:1,NCCD | 21800 | 1.7 | 0.41 | 50.6 | 0.71 | 11.3 | 12:58:39.8 | 14:13:10 | 32.39 | |
| DDO 165 | 9502 | PT,FP,NCCD | 12300 | 1.8 | 0.49 | 88.6 | 0.54 | 11.3 | 13:06:25.3 | 67:42:25 | 32.16 | |
| DDO 167 | 9504 | PT,FP,NCCD | 13000 | 2.7 | 0.49 | -23.6 | 0.65 | 11.3 | 13:13:22.9 | 46:19:11 | 32.07 | |
| DDO 168 | 9502 | PT,FP,NCCD | 22400 | 1.7 | 0.49 | -24.9 | 0.63 | 11.3 | 13:14:27.2 | 45:55:46 | 32.11 | |
| DDO 169 | 9203 | PT,FP,NCCD | 13000 | 2.3 | 0.50 | -45.2 | 0.31 | 11.3 | 13:15:29.9 | 47:29:59 | 32.41 | |
| DDO 171 | 9703 | PT,4:1,NOTI | 11800 | 3.2 | 0.43 | -29.1 | 0.91 | 11.3 | 13:18:41.3 | -8:26:43 | 32.54 | |
| DDO 183 | 9201 | PT,FP,NCCD | 13000 | 2.2 | 0.50 | 30.6 | 0.35 | 11.3 | 13:50:50.9 | 38:01:11 | 32.46 | |
| DDO 185 | 9605 | PT,4:1,NCCD | 22400 | 2.1 | 0.41 | 19.7 | 0.27 | 11.3 | 13:54:44.0 | 53:53:46 | 32.38 | |
| 9703 | PT,4:1,NOTI | (11800) | ||||||||||
| DDO 187 | 9502 | PT,FP,NCCD | 13000 | 1.5 | 0.49 | 36.6 | 0.80 | 11.3 | 14:15:56.7 | 23:03:19 | 32.03 | |
| DDO 210 | 0109 | KPNO4m,Mos | 3 500 | 1.2 | 0.26 | -84.8 | 0.48 | 18.9 | 20:46:52.0 | -12:50:50 | ||
| 0109 | HT,2048 | 31800 | 32.29 | |||||||||
| DDO 215 | 9410 | PT,FP,NCCD | 21800 | 1.4 | 0.49 | 66.3 | 0.38 | 9.1 | 22:39:09.1 | -4:45:36 | 32.23 | |
| DDO 216 | 9610 | PT,4:1,NOTI | 32700 | 1.8 | 0.43 | -57.9 | 0.45 | 31.5 | 23:28:35.0 | 14:44:30 | 32.24 | |
| DDO 220 | 9410 | PT,FP,NCCD | 21800 | 2.3 | 0.49 | 83.4 | 0.31 | 9.1 | 23:48:49.9 | 26:13:14 | 32.20 | |
| F533-1 | 9410 | PT,FP,NCCD | 32700 | 1.6 | 0.49 | -49.0 | 0.89 | 9.1 | 22:28:07.1 | 23:22:32 | 32.06 | |
| F563-V1 | 9611 | PT,4:1,NOTI | 32700 | 1.8 | 0.43 | -23.7 | 0.45 | 4.3 | 8:46:37.7 | 18:53:23 | 32.23 | |
| 9702 | PT,4:1,NOTI | (12700) | ||||||||||
| F563-V2 | 9611 | PT,4:1,NOTI | 32700 | 2.0 | 0.43 | -31.1 | 0.77 | 7.3 | 8:53:03.4 | 18:26:14 | 32.50 | |
| 9702 | PT,4:1,NOTI | (12700) | ||||||||||
| F564-V3 | 9611 | PT,4:1,NOTI | 22700 | 1.8 | 0.43 | 7.3 | 0.83 | 7.3 | 9:02:53.9 | 20:04:29 | 32.34 | |
| F565-V1 | 9502 | PT,FP,NCCD | 13000 | 1.3 | 0.49 | -79.3 | 0.55 | 7.3 | 9:19:30.3 | 21:36:11 | 32.15 | |
| F565-V2 | 9703 | PT,4:1,NOTI | 32700 | 1.9 | 0.43 | 0.0 | 0.48 | 4.3 | 9:37:30.1 | 21:45:37 | 32.13 | |
| F608-1 | 9410 | PT,FP,NCCD | 32700 | 1.7 | 0.49 | 33.5 | 0.69 | 7.3 | 0:17:15.9 | 17:31:17 | 32.05 | |
| F615-1 | 9410 | PT,FP,NCCD | 32700 | 2.0 | 0.49 | 39.7 | 0.50 | 7.3 | 2:43:25.8 | 16:43:56 | 32.11 | |
| F651-2 | 9605 | PT,4:1,NOTI | 22700 | 2.4 | 0.43 | -40.4 | 0.62 | 7.3 | 14:46:24.2 | 14:12:40 | 32.48 | |
| F721-V2 | 9704 | PT,4:1,NOTI | 22700 | 1.8 | 0.43 | -81.6 | 0.56 | 6.1 | 13:55:58.4 | 8:59:41 | 32.21 | |
| F750-V1 | 9410 | PT,FP,NCCD | 32700 | 1.8 | 0.49 | 22.0 | 0.53 | 6.1 | 23:54:19.4 | 10:56:49 | 32.07 | |
| IC 10 | 9211 | PT,FP,NCCD | 13000 | 2.2 | 0.49 | -38.3 | 0.78 | 17.0 | 00:20:21.9 | 59:17:39 | 32.06 | |
| IC 1613 | NE | 9211 | PT,FP,NCCD | 13000 | 2.7 | 0.49 | 70.6 | 0.81 | 69.5 | 1:04:49.2 | 2:07:48 | 31.71 |
| SE | 9211 | PT,FP,NCCD | 13000 | |||||||||
| NW | 9211 | PT,FP,NCCD | 13000 | |||||||||
| SW | 9211 | PT,FP,NCCD | 13000 | |||||||||
| IC 4662 | 9909 | CTIO1.5m | 31200 | 1.2 | 0.43 | -64.1 | 0.71 | 13.0 | 17:47:08.2 | -64:38:35 | 32.56 | |
| LGS 3 | 9212 | PT,FP,NCCD | 13000 | 2.1 | 0.49 | -3.4 | 0.51 | 17.0 | 1:03:55.2 | 21:52:39 | 32.01 | |
| M81dwA | 0004 | HT,2048 | 31800 | 3.7 | 1.13 | 85.8 | 0.73 | 6.8 | 8:23:57.2 | 71:01:51 | 32.17 | |
| NGC 1156 | 9502 | PT,FP,NCCD | 13000 | 1.8 | 0.49 | 41.7 | 0.86 | 11.3 | 2:59:41.9 | 25:14:21 | 32.38 | |
| NGC 1569 | 9211 | PT,FP,NCCD | 13000 | 2.3 | 0.49 | -58.9 | 0.55 | 12.6 | 4:30:49.8 | 64:50:51 | 32.00 | |
| NGC 2101 | 9301 | CTIO1.5m | 11500 | 1.6 | 0.43 | 75.0 | 0.56 | 10.2 | 5:46:24.0 | -52:05:22 | 31.60 | |
| NGC 2366 | C | 9403 | PT,FP,NCCD | 11800 | 2.3 | 0.49 | 32.6 | 0.42 | 29.4 | 7:28:48.8 | 69:12:22 | 32.19 |
| N | 9502 | PT,FP,NCCD | 23000 | |||||||||
| N2 | 9502 | PT,FP,NCCD | 23000 | |||||||||
| S | 9502 | PT,FP,NCCD | 13000 | |||||||||
| W | 9502 | PT,FP,NCCD | 23000 | |||||||||
| E | 9503 | PT,FP,NCCD | 31800 | |||||||||
| NGC 3413 | 9201 | PT,FP,NCCD | 11800 | 2.0 | 0.50 | -2.4 | 0.66 | 11.3 | 10:51:20.8 | 32:45:57 | 32.71 | |
| 9802 | PT,4:1,NOTI | (1 900) | ||||||||||
| NGC 3738 | 9504 | PT,FP,NCCD | 11800 | 2.6 | 0.49 | -0.4 | 1.00 | 11.3 | 11:35:49.0 | 54:31:23 | 32.18 | |
| NGC 3952 | 9703 | PT,4:1,NOTI | 21800 | 1.8 | 0.43 | 78.7 | 0.37 | 11.3 | 11:53:40.5 | -3:59:50 | 32.53 | |
| NGC 4163 | 0004 | HT,2048 | 41800 | 3.6 | 1.13 | 17.9 | 0.64 | 11.3 | 12:12:09.2 | 36:10:14 | 32.13 | |
| NGC 4214 | C | 9703 | PT,4:1,NOTI | 1900 | 2.0 | 0.43 | 16.1 | 0.91 | 14.7 | 12:15:39.2 | 36:19:38 | 32.38 |
| N | 9703 | PT,4:1,NOTI | 21800 | |||||||||
| S | 9703 | PT,4:1,NOTI | 21400 | |||||||||
| E | 9703 | PT,4:1,NOTI | 21800 | |||||||||
| SE | 9703 | PT,4:1,NOTI | 21800 | |||||||||
| W | 9703 | PT,4:1,NOTI | 21800 | |||||||||
| 9504 | PT,FP,NCCD | (21800) | ||||||||||
| NGC 6822 | 0206 | HT,2048 | 41800 | 3.2 | 1.13 | 8.0 | 0.80 | 42.8 | 19:44:56.4 | -14:48:01 | 32.15 | |
| SagDIG | 0005 | HT,2048 | 31800 | 3.9 | 1.13 | 87.7 | 0.53 | 27.0 | 19:30:00.6 | -17:40:56 | 32.22 | |
| UGC 199 | 9611 | PT,4:1,NOTI | 42700 | 1.7 | 0.43 | -72.2 | 0.41 | 9.1 | 0:20:52.0 | 12:51:23 | 32.61 | |
| UGC 5209 | 9703 | PT,4:1,NOTI | 31800 | 2.3 | 0.43 | -24.3 | 0.82 | 7.3 | 9:45:04.1 | 32:14:20 | 32.44 | |
| UGC 8011 | 9704 | PT,4:1,NOTI | 21800 | 3.2 | 0.43 | 35.6 | 0.46 | 11.3 | 12:52:22.4 | 21:37:51 | 32.41 | |
| UGC 8055 | 9703 | PT,4:1,NOTI | 31800 | 3.1 | 0.43 | 52.6 | 0.60 | 6.1 | 12:56:04.3 | 3:48:47 | 32.58 | |
| UGC 8276 | 9704 | PT,4:1,NOTI | 21800 | 2.6 | 0.43 | -46.4 | 0.53 | 6.1 | 13:12:06.3 | 5:28:34 | 32.40 | |
| UGC 8508 | 9703 | PT,4:1,NOTI | 11800 | 3.2 | 0.43 | -60.4 | 0.54 | 11.3 | 13:30:44.9 | 54:54:29 | 32.42 | |
| UGC 10140 | 9704 | PT,4:1,NOTI | 21800 | 2.0 | 0.43 | 58.6 | 0.65 | 6.1 | 16:01:49.7 | 18:43:20 | 32.43 | |
| UGC 10281 | 9703 | PT,4:1,NOTI | 21800 | 1.7 | 0.43 | 35.1 | 0.58 | 9.1 | 16:13:20.6 | 17:11:37 | 32.32 | |
| WLM | 9211 | PT,FP,NCCD | 13000 | 2.5 | 0.49 | -2.5 | 0.44 | 56.7 | 0:01:59.2 | -15:27:41 | 32.06 | |
| 9211 | PT,FP,NCCD | 13000 | ||||||||||
| 0467-074 | 9802 | PT,4:1,NOTI | 11800 | 2.4 | 0.43 | 49.6 | 0.85 | 4.3 | 10:35:23.1 | -1:37:10 | 32.37 | |
| 1397-049 | 9805 | PT,2048 | 21800 | 2.2 | 0.61 | 66.1 | 0.74 | 3.0 | 10:54:21.6 | 2:11:35 | 31.00 | |
| 9802 | PT,4:1,NOTI | 21800 | ||||||||||
| BCD Galaxies: | ||||||||||||
| Haro 3 | 9704 | PT,4:1,NOTI | 11800 | 2.0 | 0.43 | 54.0 | 0.74 | 6.8 | 10:45:21.9 | 55:57:35 | 32.40 | |
| Haro 4 | 9704 | PT,4:1,NOTI | 11800 | 2.6 | 0.43 | -27.1 | 0.54 | 6.1 | 11:04:58.5 | 29:08:15 | 32.64 | |
| Haro 8 | 9704 | PT,4:1,NOTI | 11800 | 2.6 | 0.43 | 53.0 | 0.80 | 6.1 | 12:19:09.8 | 3:51:16 | 32.45 | |
| Haro 14 | 9611 | PT,4:1,NOTI | 12700 | 1.7 | 0.43 | 13.4 | 0.84 | 6.1 | 0:45:46.8 | -15:35:48 | 32.22 | |
| Haro 20 | 9611 | PT,4:1,NOTI | 21800 | 1.8 | 0.43 | 23.3 | 0.52 | 6.1 | 3:28:14.6 | -17:25:12 | 32.32 | |
| 9703 | PT,4:1,NOTI | (1 900) | ||||||||||
| Haro 23 | 9704 | PT,4:1,NOTI | 11800 | 2.3 | 0.43 | -8.8 | 0.91 | 6.1 | 10:06:18.4 | 28:56:38 | 32.42 | |
| Haro 29 | 9704 | PT,4:1,NOTI | 31800 | 2.1 | 0.43 | 85.2 | 0.58 | 6.1 | 12:26:16.7 | 48:29:38 | 32.46 | |
| 9704 | PT,4:1,NOTI | (1 900) | ||||||||||
| Haro 36 | 9704 | PT,4:1,NOTI | 21800 | 2.5 | 0.43 | 1.2 | 0.81 | 6.1 | 12:46:56.3 | 51:36:48 | 32.40 | |
| Haro 38 | 9703 | PT,4:1,NOTI | 11800 | 1.8 | 0.43 | 24.2 | 0.33 | 6.1 | 13:35:35.6 | 29:12:59 | 32.47 | |
| Haro 43 | 9605 | PT,4:1,NCCD | 21800 | 2.0 | 0.41 | -38.4 | 0.42 | 4.9 | 14:36:08.8 | 28:26:59 | 32.34 | |
| HS0822+3542 | 0012 | PT,2048 | 31800 | 2.0 | 0.61 | -28.2 | 0.66 | 3.0 | 8:25:55.4 | 35:32:33 | 32.27 | |
| Mrk 5 | 9703 | PT,4:1,NOTI | 31800 | 2.8 | 0.43 | 10.1 | 0.76 | 6.8 | 6:42:15.6 | 75:37:38 | 32.33 | |
| Mrk 16 | 9704 | PT,4:1,NOTI | 11800 | 1.6 | 0.43 | 59.6 | 0.66 | 6.1 | 8:53:16.9 | 73:11:20 | 32.39 | |
| Mrk 32 | 9703 | PT,4:1,NOTI | 21800 | 3.5 | 0.43 | 6.2 | 0.58 | 6.1 | 10:27:02.1 | 56:16:12 | 32.31 | |
| Mrk 67 | 9704 | PT,4:1,NOTI | 11800 | 2.1 | 0.43 | 19.0 | 0.77 | 4.31 | 13:41:56.5 | 30:31:10 | 32.38 | |
| Mrk 178 | 9703 | PT,4:1,NOTI | 21800 | 1.8 | 0.43 | -51.3 | 0.46 | 7.3 | 11:33:29.0 | 49:14:24 | 32.40 | |
| Mrk 408 | 9703 | PT,4:1,NOTI | 11800 | 1.5 | 0.43 | -10.3 | 0.75 | 6.8 | 9:48:04.9 | 32:52:55 | 32.38 | |
| Mrk 600 | 9610 | PT,4:1,NOTI | 21800 | 2.1 | 0.43 | -39.5 | 0.59 | 6.8 | 2:51:04.7 | 4:27:13 | 32.36 | |
| Mrk 757 | 9704 | PT,4:1,NOTI | 11800 | 2.5 | 0.43 | -10.4 | 0.81 | 4.9 | 12:05:15.9 | 30:51:18 | 32.53 | |
| NGC 1705 | 9301 | CTIO1.5m | 11500 | 1.6 | 0.43 | 49.0 | 0.75 | 11.9 | 4:54:13.9 | -53:21:33 | 32.68 | |
| NGC 6789 | 0112 | HT,2048 | 21800 | 3.5 | 1.13 | 84.2 | 0.83 | 8.1 | 19:16:42.2 | 63:58:16 | 32.17 | |
| SBS1415+437 | 0204 | HT,2048 | 51800 | 3.1 | 1.13 | 35.4 | 0.37 | 7.9 | 14:17:02.0 | 43:30:13 | 31.47 | |
| UGCA 290 | 0204 | HT,2048 | 31800 | 2.7 | 1.13 | 47.4 | 0.51 | 5.7 | 12:37:22.3 | 38:44:40 | 32.17 | |
| IZw115 | 9605 | PT,4:1,NCCD | 21800 | 2.2 | 0.41 | 41.0 | 0.45 | 6.1 | 15:32:57.2 | 46:27:10 | 32.57 | |
| VIIZw403 | 9502 | PT,FP,NCCD | 21300 | 1.6 | 0.49 | -10.8 | 0.49 | 9.1 | 11:27:58.2 | 78:59:39 | 32.29 | |
| Zw2335 | 9611 | PT,4:1,NOTI | 12700 | 2.2 | 0.43 | 42.0 | 0.87 | 6.1 | 23:37:39.6 | 30:07:47 | 32.33 | |
| Sm Galaxies: | ||||||||||||
| DDO 18 | 9410 | PT,FP,NCCD | 32700 | 1.6 | 0.49 | -32.6 | 0.85 | 11.3 | 2:10:44.7 | 6:45:32 | 32.27 | |
| 9502 | PT,FP,NCCD | (1 900) | ||||||||||
| DDO 48 | 9502 | PT,FP,NCCD | 33000 | 2.1 | 0.49 | -4.5 | 0.25 | 11.3 | 7:58:54.4 | 58:02:34 | 31.99 | |
| DDO 54 | 9410 | PT,FP,NCCD | 12100 | 2.2 | 0.49 | -0.4 | 1.00 | 11.3 | 9:08:10.6 | 5:55:43 | 32.26 | |
| DDO 88 | 9504 | PT,FP,NCCD | 11800 | 2.2 | 0.49 | 49.6 | 0.92 | 11.3 | 10:47:22.4 | 14:04:16 | 32.35 | |
| DDO 122 | 9405 | PT,FP,NCCD | 21800 | 2.3 | 0.49 | -0.1 | 1.00 | 11.3 | 12:24:24.2 | 70:19:58 | 32.32 | |
| DDO 135 | 9405 | PT,FP,NCCD | 12400 | 1.9 | 0.49 | 23.6 | 0.83 | 11.3 | 12:33:48.2 | 15:10:19 | 32.08 | |
| DDO 150 | 9405 | PT,FP,NCCD | 21800 | 2.4 | 0.49 | 30.6 | 0.74 | 11.3 | 12:48:23.2 | 51:09:47 | 32.29 | |
| DDO 173 | 9703 | PT,4:1,NOTI | 11800 | 1.7 | 0.43 | -80.3 | 0.49 | 11.3 | 13:20:38.8 | 9:47:12 | 32.39 | |
| DDO 180 | 9703 | PT,4:1,NCCD | 11800 | 2.2 | 0.50 | 79.9 | 0.96 | 11.3 | 13:38:10.3 | -9:48:06 | 32.36 | |
| DDO 204 | 9405 | PT,FP,NCCD | 12400 | 2.1 | 0.49 | 34.9 | 0.87 | 11.3 | 16:16:19.1 | 47:02:50 | 32.40 | |
| DDO 214 | 9410 | PT,FP,NCCD | 22700 | 1.5 | 0.49 | -20.5 | 0.74 | 11.3 | 22:36:35.6 | -2:54:35 | 32.30 | |
| DDO 217 | N | 9610 | PT,4:1,NOTI | 22700 | 1.9 | 0.43 | 26.0 | 0.61 | 11.3 | 23:29:58.8 | 40:59:39 | 32.10 |
| S | 9610 | PT,4:1,NOTI | 22700 | |||||||||
| NE | 9610 | PT,4:1,NOTI | 22700 | |||||||||
| W | 9611 | PT,4:1,NOTI | 32700 | |||||||||
| F561-1 | 9611 | PT,4:1,NOTI | 32700 | 2.0 | 0.43 | 28.3 | 0.90 | 4.3 | 8:09:41.4 | 22:33:34 | 32.13 | |
| F567-2 | 9605 | PT,4:1,NCCD | 22400 | 2.0 | 0.41 | 32.63 | ||||||
| F583-1 | 9605 | PT,4:1,NCCD | 32400 | 2.4 | 0.41 | -13.1 | 0.40 | 9.1 | 15:57:27.5 | 20:39:58 | 32.20 | |
| NGC 2552 | 9002 | PT,4:1,NOTI | 13600 | 1.8 | 0.43 | 53.6 | 0.67 | 11.3 | 8:19:21.9 | 50:00:33 | 32.67 | |
| 9702 | PT,4:1,NOTI | (1 900) | ||||||||||
| NGC 3109 | W | 9301 | CTIO1.5m | 12700 | 1.6 | 0.43 | -87.0 | 0.21 | 21.7 | 10:03:08.2 | -26:09:29 | 32.40 |
| E | 9301 | CTIO1.5m | 13600 | |||||||||
| NGC 3510 | 9703 | PT,4:1,NOTI | 11800 | 2.9 | 0.43 | -14.4 | 0.23 | 11.3 | 11:03:43.5 | 28:53:08 | 32.98 | |
| UGC 5716 | 9704 | PT,4:1,NOTI | 11800 | 2.3 | 0.43 | -19.4 | 0.53 | 9.1 | 10:31:43.6 | 25:18:21 | 32.40 | |
| UGC 11820 | 9610 | PT,4:1,NOTI | 32700 | 1.7 | 0.43 | -81.9 | 0.52 | 10.5 | 21:49:28.8 | 14:13:47 | 32.21 | |
| LHα | aaIntegrated star formation rate normalized to the area of the galaxy within R25. | bbIntegrated star formation rate normalized to the area of the galaxy within RD. | ccTime scale to exhaust the total current gas content of the galaxy at the current star formation rate. | RHαddSemi-major axis of largest ellipse that contains H emission. An entry of 99.99 means that the H emission exceeded the size of the region that we imaged. | RHIIeeSemi-major axis of largest ellipse that contains the center of a discrete H ii region. An entry of 99.99 means that the H ii potentially extended beyond the region that we imaged. | |||||
|---|---|---|---|---|---|---|---|---|---|---|
| Galaxy | (ergs/s) | (M/yr) | (M/yr/kpc2) | (M/yr/kpc2) | (yr) | (′) | (′) | RHII/R25 | RHII/RH | RHII/RD |
| Im Galaxies: | ||||||||||
| A1004+10 | 39.52 0.00 | -1.71 | -2.42 | -1.28 | 9.30 | 0.68 | 0.53 | 0.78 | 0.55 | 2.91 |
| A2228+33 | 40.16 0.01 | -1.07 | -2.73 | -2.39 | 10.42 | 1.61 | 1.80 | 2.32 | 1.20 | 3.46 |
| CVnIdwA | 38.70 0.05 | -2.52 | -2.64 | 10.44 | 0.66 | 0.47 | 0.54 | 0.87 | ||
| D508-2 | 39.02 0.32 | -2.20 | -3.27 | -3.21 | 11.38 | 0.53 | 0.53 | 2.39 | 0.96 | 2.56 |
| D575-5 | 0.00 | |||||||||
| D634-3 | 0.00 | |||||||||
| D646-8 | 0.00 | |||||||||
| DDO 9 | 39.78 0.01 | -1.45 | -3.12 | -2.93 | 10.74 | 2.36 | 2.36 | 2.23 | 1.09 | 2.78 |
| DDO 22 | 39.06 0.02 | -2.17 | -3.08 | -2.73 | 10.71 | 0.66 | 0.66 | 1.26 | 0.70 | 1.87 |
| DDO 24 | 39.92 0.01 | -1.31 | -2.85 | -2.03 | 10.44 | 1.61 | 1.61 | 1.51 | 3.93 | |
| DDO 25 | 40.17 0.01 | -1.06 | -2.69 | -1.87 | 9.90 | 1.42 | 1.42 | 1.22 | 0.82 | 3.16 |
| DDO 26 | 39.26 0.01 | -1.96 | -3.49 | -2.91 | 11.39 | 1.33 | 1.33 | 2.06 | 1.25 | 3.99 |
| DDO 27 | 39.23 0.03 | -2.00 | -2.87 | 10.86 | 0.84 | 0.84 | 1.35 | 2.93 | ||
| DDO 33 | 40.54 0.01 | -0.69 | -2.92 | -2.68 | 10.49 | 1.04 | 1.04 | 1.13 | 0.88 | 1.48 |
| DDO 34 | 39.39 0.03 | -1.84 | -2.49 | -2.40 | 10.52 | 1.60 | 1.60 | 3.61 | 1.57 | 3.98 |
| DDO 35 | 40.78 0.00 | -0.45 | -2.53 | -1.48 | 10.02 | 0.85 | 0.85 | 0.85 | 2.84 | |
| DDO 38 | 40.05 0.01 | -1.18 | -2.72 | -2.61 | 10.57 | 1.05 | 1.05 | 1.94 | 1.02 | 2.22 |
| DDO 39 | 39.61 0.02 | -1.62 | -2.95 | -3.25 | 10.98 | 2.36 | 2.36 | 3.89 | 1.27 | 2.74 |
| DDO 40 | 40.45 0.00 | -0.78 | -2.67 | -2.02 | 10.09 | 1.23 | 1.23 | 1.61 | 0.99 | 3.39 |
| DDO 43 | 38.80 0.01 | -2.43 | -2.91 | -2.19 | 10.53 | 1.04 | 0.94 | 1.53 | 1.06 | 3.53 |
| DDO 46 | 38.79 0.01 | -2.43 | -3.08 | -2.96 | 10.69 | 0.85 | 0.85 | 1.15 | 1.32 | |
| DDO 47 | 39.25 0.01 | -1.98 | -2.55 | -2.75 | 10.71 | 3.69 | 3.69 | 5.15 | 1.65 | 4.08 |
| DDO 50 | 39.98 0.00 | -1.25 | -2.68 | -1.83 | 10.24 | 99.99 | ||||
| DDO 52 | 38.22 0.02 | -3.01 | -3.30 | -3.27 | 11.11 | 1.23 | 1.23 | 2.73 | 1.14 | 2.82 |
| DDO 53 | 38.95 0.00 | -2.28 | -2.49 | -2.50 | 10.67 | 1.19 | 1.05 | 1.53 | 0.77 | 1.52 |
| DDO 63 | 38.97 0.05 | -2.25 | -3.06 | -3.44 | 10.56 | 1.99 | 1.61 | 1.25 | 0.74 | 0.81 |
| DDO 64 | 39.29 0.01 | -1.94 | -2.93 | -2.68 | 10.46 | 1.23 | 1.04 | 1.26 | 0.85 | 1.69 |
| DDO 68 | 38.61 0.12 | -2.62 | -3.41 | -2.66 | 11.27 | 1.61 | 1.61 | 2.33 | 1.47 | 5.51 |
| DDO 69 | 37.28 0.00 | -3.95 | -3.42 | -3.28 | 11.08 | 3.26 | 3.26 | 2.49 | 1.36 | 2.92 |
| DDO 70 | 38.22 0.01 | -3.00 | -3.31 | -2.86 | 10.72 | 3.26 | 3.26 | 1.54 | 0.88 | 2.60 |
| DDO 75 | 39.03 0.00 | -2.20 | -2.61 | -1.40 | 10.21 | 3.08 | 3.08 | 1.30 | 1.00 | 5.22 |
| DDO 86 | 39.70 0.02 | -1.53 | -2.85 | -2.74 | 10.72 | 1.23 | 1.04 | 1.99 | 1.05 | 2.25 |
| DDO 87 | 38.75 0.02 | -2.47 | -3.16 | 10.84 | 1.42 | 1.23 | 1.07 | 1.93 | ||
| DDO 99 | 38.95 0.04 | -2.28 | -2.91 | -2.71 | 10.60 | 1.42 | 1.42 | 1.45 | 0.69 | 1.84 |
| DDO 101 | 38.98 0.02 | -2.25 | -3.26 | -2.99 | 9.65 | 0.66 | 0.66 | 0.96 | 0.63 | 1.31 |
| DDO 105 | 39.90 0.01 | -1.32 | -3.00 | -2.85 | 10.65 | 2.55 | 2.55 | 2.73 | 1.24 | 3.25 |
| DDO 115 | 38.23 0.01 | -3.00 | -3.07 | -2.51 | 10.24 | 0.68 | 0.68 | 1.04 | 0.69 | 1.98 |
| DDO 120 | 0.00 | |||||||||
| DDO 125 | 38.51 0.05 | -2.72 | -2.58 | 10.48 | 1.65 | 1.65 | 2.49 | |||
| DDO 126 | 39.16 0.01 | -2.06 | -2.70 | -2.45 | 10.33 | 1.99 | 1.89 | 2.30 | 1.08 | 3.08 |
| DDO 133 | 39.45 0.00 | -1.77 | -2.82 | -2.93 | 10.48 | 2.55 | 2.55 | 2.40 | 1.10 | 2.12 |
| DDO 143 | 39.53 0.04 | -1.70 | -2.82 | 10.52 | 1.61 | 1.61 | 1.19 | 2.24 | ||
| DDO 154 | 38.80 0.01 | -2.43 | -3.02 | -2.60 | 11.05 | 1.61 | 1.42 | 1.60 | 0.92 | 2.60 |
| DDO 155 | 38.57 0.00 | -2.66 | -2.36 | -1.50 | 9.79 | 1.04 | 0.66 | 1.06 | 0.70 | 2.87 |
| DDO 165 | 38.78 0.02 | -2.44 | -3.53 | -3.52 | 10.76 | 2.36 | 2.36 | 1.67 | 1.11 | 1.70 |
| DDO 167 | 38.35 0.01 | -2.88 | -2.93 | -2.41 | 10.27 | 0.66 | 0.47 | 0.96 | 0.63 | 1.75 |
| DDO 168 | 39.03 0.00 | -2.20 | -3.02 | -2.33 | 10.68 | 1.79 | 1.61 | 1.13 | 0.70 | 2.49 |
| DDO 169 | 38.21 0.14 | -3.02 | -3.57 | -3.29 | 11.15 | 0.28 | 0.28 | 0.41 | 0.21 | 0.57 |
| DDO 171 | 39.95 0.02 | -1.27 | -3.01 | -2.35 | 10.09 | 0.66 | 0.66 | 0.87 | 0.54 | 1.85 |
| DDO 183 | 38.38 0.04 | -2.85 | -3.47 | -3.21 | 10.87 | 0.85 | 0.85 | 1.09 | 0.67 | 1.48 |
| DDO 185 | 39.01 0.01 | -2.21 | -2.87 | -2.58 | 10.33 | 1.99 | 1.80 | 1.75 | 0.90 | 2.43 |
| DDO 187 | 37.70 0.02 | -3.53 | -3.43 | -2.64 | 11.01 | 0.47 | 0.47 | 0.69 | 0.45 | 1.70 |
| DDO 210 | 0.00 | |||||||||
| DDO 215 | 39.12 0.04 | -2.10 | -3.05 | -2.72 | 10.83 | 1.60 | 1.60 | 4.09 | 1.79 | 5.94 |
| DDO 216 | 36.86 0.03 | -4.36 | -4.08 | -4.15 | 10.38 | 1.31 | 1.31 | 0.85 | 0.33 | 0.78 |
| DDO 220 | 39.39 0.01 | -1.83 | -3.13 | -2.91 | 10.67 | 0.68 | 0.68 | 1.19 | 0.77 | 1.52 |
| F533-1 | 39.17 0.05 | -2.05 | -2.77 | -2.68 | 0.53 | 0.53 | 2.73 | 1.16 | 3.02 | |
| F563-V1 | 39.31 0.05 | -1.91 | -3.55 | 10.97 | 0.18 | 0.18 | 0.82 | |||
| F563-V2 | 40.48 0.04 | -0.75 | -2.96 | -2.03 | 10.36 | 0.43 | 0.43 | 1.21 | 0.84 | 3.57 |
| F564-V3 | 0.00 | |||||||||
| F565-V1 | 0.00 | |||||||||
| F565-V2 | 38.65 0.05 | -2.57 | -3.44 | 11.68 | 0.32 | 0.32 | 3.37 | |||
| F608-1 | 38.79 0.04 | -2.43 | -2.63 | -3.07 | 0.55 | 0.55 | 3.99 | 1.13 | 2.40 | |
| F615-1 | 36.97 0.33 | -4.25 | -4.76 | 0.55 | 0.55 | 1.20 | 2.12 | |||
| F651-2 | 39.71 0.04 | -1.52 | -2.81 | -2.91 | 0.79 | 0.73 | 2.39 | 1.08 | 2.14 | |
| F721-V2 | 39.14 0.02 | -2.09 | -2.15 | -2.51 | 0.25 | 0.15 | 1.34 | 0.43 | 0.89 | |
| F750-V1 | 38.54 0.05 | -2.69 | -3.07 | -2.95 | 0.35 | 0.35 | 1.97 | 0.93 | 2.28 | |
| IC 10 | 39.92 0.00 | -1.31 | -1.31 | 9.78 | 99.99 | |||||
| IC 1613 | 38.62 0.00 | -2.61 | -3.13 | -2.64 | 10.27 | 99.99 | ||||
| IC 4662 | 40.21 0.00 | -1.01 | -0.48 | 9.65 | 1.62 | 1.62 | 4.66 | |||
| LGS 3 | 0.00 | |||||||||
| M81dwA | 0.00 | |||||||||
| NGC 1156 | 40.68 0.00 | -0.54 | -2.20 | -0.87 | 9.70 | 1.79 | 1.79 | 1.07 | 0.84 | 4.96 |
| NGC 1569 | 40.74 0.00 | -0.49 | 0.11 | 8.61 | 99.99 | |||||
| NGC 2101 | 40.46 0.05 | -0.76 | -1.25 | 10.16 | 0.94 | 0.94 | 4.20 | |||
| NGC 2366 | 40.20 0.00 | -1.02 | -2.40 | -1.73 | 9.98 | 5.64 | 5.64 | 1.91 | 1.19 | 4.10 |
| NGC 3413 | 39.68 0.01 | -1.55 | -2.69 | -1.50 | 10.16 | 0.47 | 0.47 | 0.63 | 0.45 | 2.47 |
| NGC 3738 | 39.77 0.00 | -1.45 | -2.63 | -1.72 | 9.77 | 1.04 | 0.66 | 0.43 | 0.28 | 1.23 |
| NGC 3952 | 40.77 0.00 | -0.45 | -2.45 | -1.34 | 9.79 | 0.85 | 0.85 | 0.99 | 0.70 | 3.56 |
| NGC 4163 | 38.19 0.08 | -3.04 | -3.26 | -2.43 | 10.35 | 1.04 | 1.04 | 1.16 | 0.71 | 3.03 |
| NGC 4214 | 40.35 0.00 | -0.88 | -2.30 | -1.10 | 9.76 | 99.99 | ||||
| NGC 6822 | 39.26 0.00 | -1.97 | -1.96 | 10.21 | 99.99 | |||||
| SagDIG | 37.43 0.15 | -3.79 | -3.71 | -3.02 | 10.82 | 1.58 | 1.58 | 0.98 | 2.17 | |
| UGC 199 | 39.23 0.15 | -2.00 | -2.86 | -3.40 | 11.04 | 0.68 | 0.68 | 3.90 | 0.97 | 2.09 |
| UGC 5209 | 38.04 0.07 | -3.18 | -3.45 | -2.99 | 10.74 | 0.30 | 0.30 | 0.90 | 1.52 | |
| UGC 8011 | 38.97 0.03 | -2.26 | -3.14 | 10.81 | 0.66 | 0.66 | 0.61 | 1.43 | ||
| UGC 8055 | 38.62 0.04 | -2.60 | -2.71 | -2.67 | 10.90 | 0.56 | 0.56 | 2.17 | 2.25 | |
| UGC 8276 | 38.28 0.07 | -2.95 | -3.54 | -3.42 | 11.29 | 0.56 | 0.56 | 1.93 | 1.06 | 2.21 |
| UGC 8508 | 38.45 0.01 | -2.77 | -2.88 | -2.12 | 10.31 | 1.04 | 0.84 | 1.00 | 0.66 | 2.39 |
| UGC 10140 | 39.61 0.04 | -1.61 | -3.01 | -2.78 | 10.63 | 0.25 | 0.25 | 1.10 | 1.43 | |
| UGC 10281 | 39.02 0.04 | -2.21 | -2.73 | -3.19 | 11.02 | 0.68 | 0.68 | 3.54 | 0.94 | 2.10 |
| WLM | 38.39 0.00 | -2.84 | -3.33 | -2.85 | 10.74 | 4.25 | 4.25 | 1.25 | 0.73 | 2.15 |
| 0467-074 | 40.44 0.03 | -0.78 | -3.06 | -2.48 | 10.30 | 0.32 | 0.32 | 1.31 | 2.52 | |
| 1397-049 | 39.06 0.05 | -2.16 | -4.01 | -3.74 | 11.79 | 0.00 | 0.00 | 0.00 | 0.00 | 0.00 |
| BCD Galaxies: | ||||||||||
| Haro 3 | 40.91 0.00 | -0.31 | -0.16 | 9.26 | 0.51 | 0.51 | 4.86 | |||
| Haro 4 | 39.97 0.00 | -1.26 | -1.50 | -0.29 | 8.91 | 0.46 | 0.15 | 0.56 | 0.37 | 2.24 |
| Haro 8 | 40.58 0.00 | -0.65 | -2.21 | -1.05 | 9.22 | 0.46 | 0.15 | 0.28 | 0.20 | 1.08 |
| Haro 14 | 40.12 0.00 | -1.11 | -2.40 | -1.03 | 9.73 | 0.46 | 0.25 | 0.44 | 0.35 | 2.14 |
| Haro 20 | 40.18 0.01 | -1.04 | -2.74 | -1.91 | 9.92 | 0.25 | 0.05 | 0.10 | 0.26 | |
| Haro 23 | 40.22 0.00 | -1.01 | -2.33 | -1.69 | 9.13 | 0.25 | 0.15 | 0.34 | 0.19 | 0.71 |
| Haro 29 | 39.77 0.00 | -1.46 | -1.72 | -0.82 | 9.39 | 0.56 | 0.35 | 0.72 | 0.41 | 2.04 |
| Haro 36 | 39.41 0.01 | -1.82 | -2.87 | -1.96 | 10.11 | 0.76 | 0.66 | 0.91 | 2.60 | |
| Haro 38 | 39.64 0.01 | -1.59 | -2.40 | -1.78 | 9.82 | 0.56 | 0.25 | 0.69 | 0.40 | 1.42 |
| Haro 43 | 40.15 0.00 | -1.08 | -2.33 | -1.33 | 10.09 | 0.28 | 0.20 | 0.75 | 0.48 | 2.35 |
| HS0822+3542 | 39.09 0.01 | -2.14 | -1.86 | -0.73 | 9.53 | 0.13 | 0.05 | 0.39 | 1.43 | |
| Mrk 5 | 39.88 0.00 | -1.35 | -2.17 | -1.14 | 9.57 | 0.40 | 0.17 | 0.49 | 1.60 | |
| Mrk 16 | 40.49 0.01 | -0.74 | -2.58 | -1.55 | 9.93 | 0.35 | 0.15 | 0.35 | 1.14 | |
| Mrk 32 | 39.20 0.01 | -2.02 | -2.65 | -2.10 | 10.29 | 0.25 | 0.15 | 0.52 | 0.31 | 0.99 |
| Mrk 67 | 39.86 0.05 | -1.36 | -0.55 | 8.93 | 0.25 | 0.04 | 0.82 | |||
| Mrk 178 | 39.10 0.00 | -2.12 | -2.31 | -1.53 | 9.25 | 1.03 | 0.91 | 1.49 | 0.90 | 3.64 |
| Mrk 408 | 40.23 0.00 | -1.00 | -2.26 | -1.09 | 9.68 | 0.28 | 0.06 | 0.17 | 0.12 | 0.65 |
| Mrk 600 | 40.15 0.00 | -1.08 | -2.10 | -1.02 | 9.82 | 0.51 | 0.51 | 1.27 | 4.43 | |
| Mrk 757 | 39.25 0.01 | -1.98 | -2.45 | -1.53 | 9.51 | 0.20 | 0.08 | 0.21 | 0.62 | |
| NGC 1705 | 40.15 0.00 | -1.07 | -0.82 | 9.29 | 1.54 | 0.45 | 1.58 | |||
| NGC 6789 | 38.55 0.04 | -2.68 | -2.98 | -1.91 | 0.47 | 0.34 | 0.48 | 1.54 | ||
| SBS1415+437 | 39.05 0.01 | -2.18 | -2.92 | -2.31 | 0.60 | 0.33 | 0.79 | 1.60 | ||
| UGCA 290 | 37.92 0.06 | -3.31 | -2.83 | -1.77 | 0.62 | 0.43 | 1.08 | 0.79 | 3.68 | |
| IZw115 | 38.52 0.05 | -2.71 | -3.75 | -2.87 | 11.10 | 0.35 | 0.15 | 0.29 | 0.20 | 0.79 |
| VIIZw403 | 39.34 0.00 | -1.88 | -2.19 | -1.82 | 9.86 | 0.99 | 0.68 | 1.09 | 0.61 | 1.67 |
| Zw2335 | 40.20 0.00 | -1.02 | -2.10 | -0.89 | 9.27 | 0.15 | 0.01 | 0.04 | 0.02 | 0.14 |
| Sm Galaxies: | ||||||||||
| DDO 18 | 39.76 0.05 | -1.47 | -3.30 | -3.05 | 10.78 | 0.85 | 0.85 | 1.35 | 0.89 | 1.82 |
| DDO 48 | 39.64 0.01 | -1.59 | -2.57 | -2.95 | 10.82 | 1.61 | 1.61 | 4.77 | 1.43 | 3.10 |
| DDO 54 | 39.54 0.04 | -1.69 | -3.36 | -2.63 | 10.58 | 0.85 | 0.85 | 1.15 | 0.76 | 2.68 |
| DDO 88 | 38.90 0.03 | -2.33 | -3.33 | -2.60 | 10.42 | 1.04 | 1.04 | 1.25 | 0.82 | 2.91 |
| DDO 122 | 39.87 0.00 | -1.36 | -2.91 | -2.11 | 10.06 | 1.42 | 1.23 | 0.98 | 0.74 | 2.45 |
| DDO 135 | 39.18 0.00 | -2.05 | -2.78 | -1.88 | 8.41 | 1.79 | 1.79 | 1.36 | 0.95 | 3.83 |
| DDO 150 | 39.67 0.00 | -1.55 | -2.86 | -2.09 | 10.13 | 1.42 | 1.42 | 1.38 | 0.99 | 3.34 |
| DDO 173 | 40.07 0.01 | -1.16 | -2.93 | -2.18 | 10.35 | 1.04 | 1.04 | 1.19 | 0.84 | 2.80 |
| DDO 180 | 40.68 0.00 | -0.54 | -2.64 | -1.66 | 9.86 | 1.04 | 1.04 | 0.90 | 0.64 | 2.80 |
| DDO 204 | 40.46 0.00 | -0.76 | -2.62 | -1.74 | 9.97 | 1.79 | 1.79 | 1.47 | 1.20 | 4.05 |
| DDO 214 | 40.71 0.01 | -0.51 | -3.04 | -2.36 | 10.12 | 1.23 | 1.23 | 0.98 | 0.76 | 2.14 |
| DDO 217 | 40.13 0.00 | -1.09 | -3.07 | -2.73 | 10.44 | 3.50 | 3.50 | 1.78 | 1.20 | 2.64 |
| F561-1 | 40.29 0.05 | -0.93 | -2.68 | 10.42 | 0.47 | 0.47 | 2.33 | |||
| F567-2 | 0.00 | |||||||||
| F583-1 | 39.96 0.02 | -1.26 | -2.72 | -2.57 | 10.75 | 0.99 | 0.91 | 3.25 | 1.29 | 3.87 |
| NGC 2552 | 40.06 0.00 | -1.16 | -2.83 | -1.98 | 10.05 | 1.42 | 1.42 | 0.92 | 0.71 | 2.43 |
| NGC 3109 | 39.52 0.00 | -1.71 | -2.39 | 10.49 | 99.99 | |||||
| NGC 3510 | 40.43 0.00 | -0.80 | -2.36 | -1.52 | 10.11 | 1.79 | 1.79 | 1.59 | 0.99 | 4.19 |
| UGC 5716 | 39.51 0.03 | -1.72 | -2.93 | -2.65 | 10.75 | 0.68 | 0.68 | 1.65 | 0.77 | 2.28 |
| UGC 11820 | 40.07 0.01 | -1.15 | -2.59 | -2.74 | 10.59 | 2.01 | 1.92 | 3.95 | 1.33 | 3.33 |
| R25 | RD | aaTotal galactic atomic gas mass. The HI mass has been multiplied by 1.34 to account for He. | |||
|---|---|---|---|---|---|
| Galaxy | (kpc) | (kpc) | MV | (M) | RefbbReference from which the HI mass was taken. Masses were modified to reflect the distances used here as necessary. |
| Im Galaxies: | |||||
| A1004+10 | 1.29 | 0.35 | -15.93 | 7.59 | 12 |
| A2228+33 | 3.83 | 2.57 | -17.75 | 9.35 | 11 |
| CVnIdwA | 0.65 | -12.65 | 7.92 | 25 | |
| D508-2 | 1.94 | 1.81 | -15.74 | 9.18 | 17 |
| D575-5 | 0.85 | -12.85 | 7.52 | 17 | |
| D634-3 | 0.09 | 0.13 | -10.16 | 5.98 | 17 |
| D646-8 | 2.02 | -14.69 | 7.79 | 17 | |
| DDO 9 | 3.87 | 3.11 | -17.46 | 9.29 | 7 |
| DDO 22 | 1.61 | 1.09 | -15.44 | 8.54 | 7 |
| DDO 24 | 3.35 | 1.29 | -17.09 | 9.13 | 7 |
| DDO 25 | 3.72 | 1.44 | -17.27 | 8.84 | 7 |
| DDO 26 | 3.27 | 1.68 | -16.80 | 9.43 | 11 |
| DDO 27 | 1.54 | -15.28 | 8.86 | 7 | |
| DDO 33 | 7.36 | 5.62 | -18.63 | 9.80 | 7 |
| DDO 34 | 1.19 | 1.08 | -15.36 | 8.68 | 7 |
| DDO 35 | 6.18 | 1.84 | -18.74 | 9.57 | 7 |
| DDO 38 | 3.36 | 2.93 | -17.11 | 9.39 | 7 |
| DDO 39 | 2.61 | 3.71 | -17.42 | 9.36 | 7 |
| DDO 40 | 4.97 | 2.36 | -17.88 | 9.31 | 7 |
| DDO 43 | 0.99 | 0.43 | -14.31 | 8.10 | 11 |
| DDO 46 | 1.19 | 1.03 | -14.45 | 8.26 | 7 |
| DDO 47 | 1.09 | 1.37 | -15.46 | 8.73 | 11 |
| DDO 50 | 2.93 | 1.11 | -16.61 | 8.99 | 3 |
| DDO 52 | 0.79 | 0.76 | -14.27 | 8.10 | 7 |
| DDO 53 | 0.72 | 0.73 | -13.84 | 8.39 | 16 |
| DDO 63 | 1.43 | 2.22 | -14.73 | 8.31 | 18 |
| DDO 64 | 1.78 | 1.33 | -15.42 | 8.52 | 11 |
| DDO 68 | 1.41 | 0.60 | -15.17 | 8.65 | 11 |
| DDO 69 | 0.31 | 0.26 | -11.67 | 7.13 | 1 |
| DDO 70 | 0.80 | 0.48 | -14.10 | 7.72 | 11 |
| DDO 75 | 0.90 | 0.22 | -13.91 | 8.01 | 11 |
| DDO 86 | 2.58 | 2.28 | -16.51 | 9.19 | 7 |
| DDO 87 | 1.25 | -14.67 | 8.37 | 11 | |
| DDO 99 | 1.17 | 0.92 | -14.88 | 8.32 | 18 |
| DDO 101 | 1.81 | 1.32 | -15.75 | 7.40 | 20 |
| DDO 105 | 3.90 | 3.28 | -17.70 | 9.33 | 7 |
| DDO 115 | 0.61 | 0.32 | -13.28 | 7.24 | 2 |
| DDO 120 | 2.23 | 1.01 | -16.33 | 8.33 | 7 |
| DDO 125 | 0.48 | -14.70 | 7.76 | 7 | |
| DDO 126 | 1.18 | 0.88 | -14.85 | 8.27 | 7 |
| DDO 133 | 1.89 | 2.15 | -15.96 | 8.71 | 7 |
| DDO 143 | 2.05 | -15.58 | 8.82 | 2 | |
| DDO 154 | 1.11 | 0.69 | -14.51 | 8.62 | 4 |
| DDO 155 | 0.40 | 0.15 | -12.53 | 7.13 | 11 |
| DDO 165 | 1.98 | 1.95 | -15.69 | 8.32 | 7 |
| DDO 167 | 0.60 | 0.33 | -12.98 | 7.39 | 7 |
| DDO 168 | 1.45 | 0.66 | -15.27 | 8.48 | 11 |
| DDO 169 | 1.06 | 0.78 | -14.58 | 8.13 | 7 |
| DDO 171 | 4.16 | 1.95 | -17.90 | 8.82 | 7 |
| DDO 183 | 1.16 | 0.86 | -14.54 | 8.02 | 11 |
| DDO 185 | 1.20 | 0.86 | -14.95 | 8.12 | 21 |
| DDO 187 | 0.50 | 0.20 | -12.95 | 7.48 | 11 |
| DDO 210 | 0.12 | 0.17 | -10.88 | 6.52 | 14 |
| DDO 215 | 1.67 | 1.15 | -15.63 | 8.73 | 7 |
| DDO 216 | 0.40 | 0.44 | -13.29 | 6.02 | 7 |
| DDO 220 | 2.49 | 1.94 | -16.28 | 8.84 | 7 |
| F533-1 | 1.29 | 1.17 | -15.34 | ||
| F563-V1 | 3.71 | -17.22 | 9.05 | 5 | |
| F563-V2 | 7.26 | 2.47 | -18.63 | 9.61 | 5 |
| F564-V3 | 0.59 | 0.38 | -13.24 | 7.27 | 5 |
| F565-V1 | 0.34 | 0.32 | -12.45 | ||
| F565-V2 | 1.52 | -16.17 | 9.10 | 5 | |
| F608-1 | 0.71 | 1.18 | -14.86 | ||
| F615-1 | 1.02 | -13.89 | |||
| F651-2 | 2.50 | 2.80 | -16.42 | ||
| F721-V2 | 0.61 | 0.92 | -14.34 | ||
| F750-V1 | 0.88 | 0.76 | -14.34 | ||
| IC 10 | 0.57 | -17.11 | 8.47 | 10 | |
| IC 1613 | 1.03 | 0.59 | -14.60 | 7.66 | 10 |
| IC 4662 | 0.30 | -16.56 | 8.64 | 2 | |
| LGS 3 | 0.20 | -9.41 | 5.18 | 23 | |
| M81dwA | 0.37 | -11.73 | 7.26 | 19 | |
| NGC 1156 | 3.81 | 0.82 | -18.67 | 9.16 | 11 |
| NGC 1569 | 0.28 | -17.57 | 8.12 | 12 | |
| NGC 2101 | 0.99 | -17.69 | 9.40 | 2 | |
| NGC 2366 | 2.76 | 1.28 | -16.66 | 8.96 | 7 |
| NGC 3413 | 2.10 | 0.54 | -17.16 | 8.61 | 2 |
| NGC 3738 | 2.18 | 0.77 | -17.12 | 8.32 | 11 |
| NGC 3952 | 5.61 | 1.56 | -18.91 | 9.34 | 2 |
| NGC 4163 | 0.73 | 0.28 | -14.37 | 7.31 | 2 |
| NGC 4214 | 2.90 | 0.72 | -17.56 | 8.88 | 2 |
| NGC 6822 | 0.56 | -15.12 | 8.24 | 6 | |
| SagDIG | 0.52 | 0.23 | -12.45 | 7.03 | 14 |
| UGC 199 | 1.52 | 2.85 | -16.48 | 9.04 | 24 |
| UGC 5209 | 0.77 | 0.46 | -13.76 | 7.56 | 2 |
| UGC 8011 | 1.57 | -15.56 | 8.55 | 2 | |
| UGC 8055 | 0.64 | 0.61 | -13.62 | 8.30 | 2 |
| UGC 8276 | 1.12 | 0.98 | -14.57 | 8.34 | 2 |
| UGC 8508 | 0.64 | 0.27 | -13.59 | 7.54 | 7 |
| UGC 10140 | 2.81 | 2.17 | -16.80 | 9.02 | 24 |
| UGC 10281 | 1.03 | 1.74 | -15.64 | 8.81 | 24 |
| WLM | 0.99 | 0.58 | -14.39 | 7.90 | 10 |
| 0467-074 | 7.72 | 4.00 | -18.69 | 9.52 | 9 |
| 1397-049 | 4.75 | 3.47 | -17.73 | 9.63 | 9 |
| BCD Galaxies: | |||||
| Haro 3 | 0.48 | -18.23 | 8.95 | 12 | |
| Haro 4 | 0.74 | 0.19 | -14.80 | 7.65 | 8 |
| Haro 8 | 3.42 | 0.90 | -17.91 | 8.57 | 8 |
| Haro 14 | 2.49 | 0.52 | -17.77 | 8.62 | 8 |
| Haro 20 | 3.99 | 1.53 | -18.32 | 8.88 | 8 |
| Haro 23 | 2.58 | 1.24 | -17.72 | 8.12 | 8 |
| Haro 29 | 0.76 | 0.27 | -14.47 | 7.93 | 8 |
| Haro 36 | 1.90 | 0.67 | -15.84 | 8.29 | 8 |
| Haro 38 | 1.45 | 0.70 | -15.22 | 8.23 | 8 |
| Haro 43 | 2.39 | 0.76 | -17.18 | 9.01 | 8 |
| HS0822 | 0.41 | 0.11 | -13.15 | 7.39 | 13 |
| Mrk 5 | 1.45 | 0.44 | -16.02 | 8.22 | 22 |
| Mrk 16 | 4.72 | 1.44 | -18.74 | 9.19 | 22 |
| Mrk 32 | 1.16 | 0.61 | -15.43 | 8.27 | 22 |
| Mrk 67 | 2.61 | 7.57 | 22 | ||
| Mrk 178 | 0.70 | 0.28 | -14.11 | 7.13 | 22 |
| Mrk 408 | 2.43 | 0.63 | -18.02 | 8.68 | 22 |
| Mrk 600 | 1.83 | 0.53 | -16.30 | 8.74 | 22 |
| Mrk 757 | 0.97 | 0.34 | -15.46 | 7.53 | 22 |
| NGC 1705 | 0.42 | -16.25 | 8.22 | 15 | |
| NGC 6789 | 0.80 | 0.23 | -14.77 | ||
| SBS1415 | 1.32 | 0.66 | -15.01 | ||
| UGCA 290 | 0.33 | 0.10 | -11.73 | ||
| IZw115 | 1.88 | 0.68 | -16.01 | 8.39 | 8 |
| VIIZw403 | 0.80 | 0.52 | -14.27 | 7.98 | 22 |
| Zw2335 | 1.95 | 0.49 | -17.47 | 8.25 | 8 |
| Sm Galaxies: | |||||
| DDO 18 | 4.66 | 3.47 | -17.52 | 9.31 | 7 |
| DDO 48 | 1.75 | 2.70 | -16.67 | 9.23 | 7 |
| DDO 54 | 3.89 | 1.67 | -17.39 | 8.89 | 7 |
| DDO 88 | 1.80 | 0.77 | -15.87 | 8.09 | 7 |
| DDO 122 | 3.37 | 1.34 | -17.15 | 8.70 | 7 |
| DDO 135 | 1.31 | 0.47 | -15.06 | 6.36 | 7 |
| DDO 150 | 2.54 | 1.05 | -16.31 | 8.58 | 7 |
| DDO 173 | 4.32 | 1.84 | -17.56 | 9.19 | 7 |
| DDO 180 | 6.33 | 2.04 | -19.19 | 9.32 | 7 |
| DDO 204 | 4.80 | 1.75 | -17.58 | 9.21 | 11 |
| DDO 214 | 10.33 | 4.75 | -19.48 | 9.61 | 7 |
| DDO 217 | 5.52 | 3.71 | -17.94 | 9.35 | 7 |
| F561-1 | 4.21 | -18.66 | 9.49 | 5 | |
| F567-2 | -17.40 | 9.67 | 5 | ||
| F583-1 | 3.03 | 2.54 | -17.17 | 9.49 | 5 |
| NGC 2552 | 3.84 | 1.45 | -17.34 | 8.89 | 11 |
| NGC 3109 | 1.24 | 8.79 | 7 | ||
| NGC 3510 | 3.44 | 1.30 | -17.27 | 9.31 | 11 |
| UGC 5716 | 2.28 | 1.65 | -16.30 | 9.03 | 2 |
| UGC 11820 | 2.96 | 3.51 | -17.56 | 9.44 | 2 |
References. — (1) Allsopp 1978; (2) Bottinelli et al. 1990; (3) Bureau & Carignan 2002; (4) Carignan & Beaulieu 1989; (5) de Blok, McGaugh, & van der Hulst 1996; (6) de Blok & Walter 2000; (7) Fisher & Tully 1981; (8) Gordon & Gottesman 1981; (9) Huchtmeier, Hopp, & Kuhn 1997; (10) Huchtmeier, Seiradakis, & Materne 1981; (11) Hunter & Gallagher 1985a; (12) Hunter, Gallagher, & Rautenkranz 1982; (13) Kniazen et al. 2000; (14) Lo, Sargent, & Young 1993; (15) Meurer, Staveley-Smith, & Killeen 1998; (16) Nordgren et al., private communication; (17) Pildis, Schombert, & Eder 1997; (18) RC3; (19) Sargent, Sancisi, & Lo 1983; (20) Stil & Israel 2002; (21) Swaters 1999; (22) Thuan & Martin 1981; (23) Young & Lo 1997; (24) van Zee, Haynes, & Giovanelli 1995; and (25) van Zee et al. 1997.
| HII Region | ApertureaaAperture diameter in arcseconds. | [OII]3727bbIntegrated emission in units of ergs cm-2 s-1. | [OIII]5007bbIntegrated emission in units of ergs cm-2 s-1. | HbbIntegrated emission in units of ergs cm-2 s-1. | HbbIntegrated emission in units of ergs cm-2 s-1. | [NII]6584bbIntegrated emission in units of ergs cm-2 s-1. | [SII]6717,6731bbIntegrated emission in units of ergs cm-2 s-1. |
|---|---|---|---|---|---|---|---|
| NGC 595 | 13.5 | 5.95 | 4.37 | 3.47 | 18.31 | 2.01 | 1.54 |
| 22.0 | 16.22 | 11.22 | 8.69 | ||||
| NGC 604 | 13.5 | 16.36 | 23.33 | 10.44 | 53.69 | 6.05 | 6.21 |
| 22.0 | 51.19 | 50.31 | 25.27 | ||||
| NGC 2363 | 13.5 | 8.60 | 85.04 | 12.06 | 42.30 | 0.75 | 1.33 |
| NGC 5461 | 13.5 | 4.41 | 3.36 | 22.42 | 3.46 | 2.69 | |
| NGC 5462 | 13.5 | 4.25 | 0.37 | 1.04 |
References
- (1) Allsopp, N. J. 1978, MNRAS, 184, 397
- (2) Aparicio, A. 1994, ApJ, 437, L27
- (3) Aparicio, A., Gallart, C., & Bertelli, G. 1997a, AJ, 114, 669
- (4) Aparicio, A., Gallart, C., & Bertelli, G. 1997b, AJ, 114, 680
- (5) Aparicio, A., & Tikhonov, N. 2000, AJ, 119, 2183
- (6) Aparicio, A., Tikhonov, N., & Karachentsev, I. 2000, AJ, 119, 177
- (7) Bekki, K., & Freeman, K.C. 2003, ApJ, 574, L21
- (8) Binggeli, B., & Popescu, C. C. 1995, A&A, 298, 63
- (9) Bosma, A. 1981, AJ, 86, 1825
- (10) Bothun, G. D., Schombert, J. M., Impey, C. D., Sprayberry, D., & McGaugh, S. S. 1993, AJ, 106, 530
- (11) Bottinelli, L., Gouguenheim, L., Fouque, P., & Paturel, G. 1990, A&AS, 82, 391
- (12) Bravo-Alfaro, H., Brinks, E., Baker, A. J., Walter, F., & Kunth, D. 2004, AJ, 127, 264
- (13) Brinchmann, J., Charlot, S., White, S. D. M., Tremonti, C., Kauffmann, G., Heckman, T., & Brinkmann, J. 2004, MNRAS, in press
- (14) Brosch, N., Heller, A., & Almoznino, E. 1998, ApJ, 504, 720
- (15) Buat, V., Deharveng, J. M., & Donas, J. 1989, A&A, 223, 42
- (16) Bureau, M., & Carignan, C. 2002, AJ, 123, 1316
- (17) Burstein, D., & Heiles, C. 1984, ApJS, 54, 33
- (18) Cairós, L. M., Vílchez, J. M., Pérez, J. N. G., & Igelsias-Páramo, J., & Caon, N. 2001, ApJS, 133, 321
- (19) Campos-Aguilar, A., & Moles, M. 1991, A&A, 241, 358
- (20) Cannon, J.M., Dohm-Palmer, R.C., Skillman, E.D., Bomans, D.J., Cté, S., & Miller, B.W. 2003. AJ, 126, 2806
- (21) Cardelli, J. A., Clayton, G. C., & Mathis, J. S. 1989, ApJ, 345, 245
- (22) Carignan, C., & Beaulieu, S. 1989, ApJ, 347, 760
- (23) Chamaraux, P. 1977, A&A, 60, 67
- (24) Cole, A. A., et al. 1999, AJ, 118, 1657
- (25) Cté, S., Carignan, C., & Freeman, K. C. 2000, AJ, 120, 3027
- (26) Crone, M. M., Schulte-Ladbeck, R. E., Greggio, L., & Hopp, U. 2002, ApJ, 567, 258
- (27) Davies, R. I., Sugai, H., & Ward, M. J. 1998, MNRAS, 295, 43
- (28) de Blok, W. J. G., & Walter, F. 2000, ApJ, 537, L95
- (29) de Blok, W. J. G., McGaugh, S. S., & van der Hulst, J. M. 1996, MNRAS, 283, 18
- (30) de Vaucouleurs, G., de Vaucouleurs, A., Corwin, H., Buta, R., Paturel, G., & Fouqué, P. 1991, Third Reference Catalogue of Bright Galaxies (New York, Springer-Verlag), =RC3
- (31) Dohm-Palmer, R. C., et al. 1998, AJ, 116, 1227
- (32) Dolphin, A. E. 2000, ApJ, 531, 804
- (33) Dolphin, A. E., et al. 2002, AJ, 123, 3154
- (34) Dolphin, A. E., et al. 2003, AJ, 125, 1261
- (35) Dopita, M. A., & Ryder, S. D. 1994, ApJ, 430, 163
- (36) Elmegreen, B. G. 1993, ApJ, 419, L29
- (37) Elmegreen, B. G., & Elmegreen, D. M. 1986, ApJ, 311, 554
- (38) Elmegreen, B. G., & Hunter, D. A. 2000, ApJ, 540, 814
- (39) Ferraro, F. R., Pecci, F. F., Tosi, M., & Buonanno, R. 1989, MNRAS, 241, 433
- (40) Fisher, J. R., & Tully, R. B. 1975, A&A, 44, 151
- (41) Fisher, J. R., & Tully, R. B. 1981, ApJS, 47, 139
- (42) Freedman, W. L. et al. 2001, ApJ, 553, 47
- (43) Gallagher, J. S., Hunter, D. A., & Tutukov, A. V. 1984, ApJ, 284, 544
- (44) Gallagher, J. S., Tolstoy, E., Dohm-Palmer, R. C., Skillman, E. D., Cole, A. A., Hoessel, J. G., Saha, A., & Mateo, M. 1998, AJ, 115, 1869
- (45) Gallart, C., Aparicio, A., Bertelli, G., & Chiosi, C. 1996a, AJ, 112, 1950
- (46) Gallart, C., Aparicio, A., Bertelli, G., & Chiosi, C. 1996b, AJ, 112, 2596
- (47) Gallart, C., Aparicio, A., & Vilchez, J. M. 1996, AJ, 112, 1928
- (48) Gallart, C., Freedman, W., Mateo, M., Chiosi, C., Thompson, I., Aparicio, A., Bertelli, G., Hodge, P., Lee, M., Olszewski, E., Saha, A., Stetson, P., & Suntzeff, N. 1999, ApJ, 514, 665
- (49) Gil de Paz, A., Aragón-Salamanca, A., Gallego, J., Alonso-Herrero, A., Zamorano, J., & Kauffmann, G. 2000, MNRAS, 316, 357
- (50) Gordon, D., & Gottesman, S. T. 1981, AJ, 86, 161
- (51) Greggio, L., Marconi, G., Tosi, M., & Focardi, P. 1993, AJ, 105, 894
- (52) Greggio, L., Tosi, M., Clampin, M., de Marchi, G., Leitherer, C., Nota, A., & Sirianni, M. 1998, ApJ, 504, 725
- (53) Hashimoto, Y., Oemler, A., Jr., Lin, H., & Tucker, D. L. 1998, ApJ, 499, 589
- (54) Heller, A.B., Brosch, N., Almoznino, E., van Zee, L., & Salzer, J.J. 2000, MNRAS, 316, 569
- (55) Hidalgo, S. L., Marín-Franch, A., & Aparicio, A. 2003, AJ, 124, 1247
- (56) Hodge, P. W. 1971, Ann Rev A&A, 9, 35
- (57) Hodge, P. W., & Hitchcock, J. L. 1966, PASP, 78, 79
- (58) Hopkins, A. M., Connolly, A. J., Haarsma, D. B., & Cram, L. E. 2001, AJ, 122, 288
- (59) Hopkins, A. M., Schulte-Ladbeck, R. E., & Drozdovsky, I. O. 2002, AJ, 124, 862
- (60) Huchtmeier, W. K., Hopp, U., & Kuhn, B. 1997, A&A, 319, 67
- (61) Huchtmeier, W. K., Seiradakis, J. H., & Materne, J. 1981, A&A, 102, 134
- (62) Hunter, D. A. 2001, ApJ, 559, 225
- (63) Hunter, D. A., Elmegreen, B. G., & Baker, A. L. 1998a, ApJ, 493, 595
- (64) Hunter, D. A., Elmegreen, B. G., van Woerden, H. 2001, ApJ, 556, 773
- (65) Hunter, D. A., & Gallagher, J. S. 1985a, AJ, 90, 1789
- (66) Hunter, D. A., & Gallagher, J. S. 1985b, ApJS, 58, 533
- (67) Hunter, D. A., & Gallagher, J. S. 1986, PASP, 98, 5
- (68) Hunter, D. A., Gallagher, J. S., & Rautenkranz, D. 1982, ApJS, 49, 53
- (69) Hunter, D. A., Hawley, W. N., & Gallagher, J. S., III 1993, AJ, 106, 1797
- (70) Hunter, D. A., & Hoffman, L. 1999, AJ, 117, 2789
- (71) Hunter, D. A., Wilcots, E., van Woerden, H., Gallagher, J. S., & Kohle, S. 1998b, ApJ, 495, L47
- (72) Israel, F. P. 1988, A&A, 194, 24
- (73) Jacoby, G. H., Hunter, D. A., & Christian, C. A. 1984, ApJS, 56, 257
- (74) James, P. A., Shane, N. S., Beckman, J. E., Cardwell, A., Collins, C. A., Etherton, J., de Jong, R. S., Fathi, K., Knapen, J. H., Peletier, R. F., Percival, S. M., Pollacco, D. L., Seigar, M. S., Stedman, S., & Steele, I. A. 2004, A&A, 414, 23
- (75) Karachentsev, I. D., Aparicio, A., & Makarova, L. 1999, A&A, 352, 363
- (76) Karachentsev, I. D., Musella, I., & Grimaldi, A. 1996, A&A, 310, 722
- (77) Karachentsev, I. D., et al. 2002, A&A, 383, 125
- (78) Karachentsev, I. D., et al. 2003a, A&A, 398, 467
- (79) Karachentsev, I. D., et al. 2003b, A&A, 398, 479
- (80) Kennicutt, R. C., Jr. 1983, ApJ, 272,54
- (81) Kennicutt, R. C., Jr. 1989, ApJ, 344, 685
- (82) Kennicutt, R. C., Jr. 1998, ARA&A, 36, 189
- (83) Kennicutt, R. C., Balick, B., & Heckman, T. 1980, PASP, 92, 134
- (84) Kennicutt, R. C., Jr., & Skillman, E. D. 2001, AJ, 121, 1461
- (85) Kennicutt, R. C., Tamblyn, P., & Congdon, C. W. 1994, ApJ, 435, 22
- (86) Klessen R.S. 2000, ApJ, 535, 869
- (87) Kniazen, A. Y., et al. 2000, A&A, 357, 101
- (88) Komiyama, Y., et al. 2003, ApJ, 590, L17
- (89) in Star-Forming Dwarf Galaxies edited by D. Kunth, T. X. Thuan, & J. T. Thanh Van, (France:Editions Frontieres), p. 183
- (90) Lee, M. G., Aparicio, A., Tikonov, N., Byun, Y.-I., & Kim, E. 1999, AJ, 118, 853
- (91) Lee, M. G., & Kim, S. C. 2000, AJ, 119, 777
- (92) Li, Y., Klessen, R.S., Mac Low, M.-M. 2003, ApJ, 592, 975
- (93) Lo, K. Y., Sargent, W. L. W., & Young, K. 1993, AJ, 106, 507
- (94) Lynds, R., Tolstoy, E., O’Neil, E. J., & Hunter, D. A. 1998, AJ, 116, 146
- (95) Mac Low, M.-M., & Klessen, R. S. 2004, Rev Mod Phys, 76, 125
- (96) Maiz-Apellaniz, J., Cieza, L., & Mackenty, J. W. 2002, AJ, 123, 1307
- (97) Makarova, L., Karachentsev, I., Takalo, L. O., Heinaemaeki, P., & Valtonen, M. 1998, A&AS, 128, 459
- (98) Marconi, G., Tosi, M., Greggio, L, & Focardi, P. 1995, AJ, 109, 173
- (99) McGaugh, S. S., & Bothun, G. D. 1994, AJ, 107, 530
- (100) Massey, P., & Armandroff, T. E. 1995, AJ, 109, 2470
- (101) Massey, P., & Hunter, D. A. 1998, ApJ, 493, 180
- (102) Méndez, B., Davis, M., Moustakas, J., Newman, J., Madore, B. F., & Freedman, W. L. 2002, AJ, 124, 213
- (103) Méndez, D. I., & Esteban, C. 2000, A&A, 359, 493
- (104) Meurer, G. R., Staveley-Smith, L., & Killeen, N. E. B. 1998, MNRAS, 300, 705
- (105) Miller, B. W., Dolphin, A. E., Lee, M. O., Kim, S. C., & Hodge, P. 2001, ApJ, 562, 713
- (106) Minniti, D., & Zijlstra, A. A. 1997, AJ, 114, 147
- (107) Minniti, D., Zijlstra, A. A., & Alonso, M. V. 1999, AJ, 117, 881
- (108) Noeske, K. G., Papaderos, P., Cairós, L. M., & Fricke, K. J. 2003 å, 410, 481
- (109) Noeske, K. G., Iglesias-Páramo, J., Vílchez, J. M., Papaderos, P., & Fricke, K. J. 2001, A&A, 371, 806
- (110) Noguchi, M. 1988, A&A, 201, 37
- (111) O’Connell, R. W., Gallagher, J. S., III, Hunter, D. A. 1994, ApJ, 433, 65
- (112) Osterbrock, D. E. 1974, Astrophysics of Gaseous Nebulae, (San Francisco:W.H. Freeman and Company)
- (113) Östlin, G., Amram, P., Bergvall, N., Masegosa, J., Boulesteix, J., & Márquez, I. 2001, A&A, 374, 800
- (114) Östlin, G., Zackrisson, E., Bergvall, N., Rönnback, J. 2003, A&A, 408, 887
- (115) Ostriker, E.C., Gammie, C.F., & Stone, J.M. 1999, ApJ, 513, 259
- (116) Ostriker, E.C., Stone, J.M., Gammie, C.F. 2001, ApJ, 546, 980
- (117) Padoan, P., Juvela, M., Bally, J., Nordlund, A. 2000, ApJ, 529, 259
- (118) Panagia, N. 1973, AJ, 78, 929
- (119) Papaderos, P., Loose, H.-H., Fricke, K. J., & Thuan, T. X. 1996, A&A, 314 59
- (120) Parodi, B. R., & Binggeli, B. 2003, A&A, 398, 501
- (121) Patterson, R. J., & Thuan, T. X. 1996, ApJS, 107, 103
- (122) Pérez-González, P. G., Gil de Paz, A., Zamorano, J., Gallego, J., Alonso-Herrero, A., & Aragón-Salamanca, A. 2003, MNRAS, 338, 525
- (123) Pildis, R. A., Schombert, J. M., & Eder, J. A. 1997, ApJ, 481, 157
- (124) Popescu, C. C., Hopp, U., & Rosa, M. R. 1999, A&A, 350, 414
- (125) Pustilnik, S.A., Kniazev, A.Y., Lipovetsky, V.A., & Ugryumov, A.V. 2001a, A&A, 373, 24
- (126) Pustilnik, S.A., Brinks, E., Thuan, T.X., Lipovetsky, V.A., Izotov, Y.I. 2001b, AJ, 121, 1413
- (127) Pustilnik, S.A., Kniazev, A.Y., Pramskij, A.G., Ugryumov, A.V., & Masegosa, J. 2003, A&A, 409, 917
- (128) Putman, M. E., Bureau, M., Mould, J. R., Staveley-Smith, L., & Freeman, K. C. 1998, AJ, 115, 2345
- (129) Roye, E. W., & Hunter, D. A. 2000, AJ, 119, 1145
- (130) Ryder, S. D., & Dopita, M. A. 1994, ApJ, 430, 142
- (131) Salpeter, E. E. 1955, ApJ, 121, 161
- (132) Sargent, W. L. W., Sancisi, R., & Lo, K. Y. 1983, ApJ, 265, 711
- (133) Schaerer, D., Meynet, G., Maeder, A., & Schaller, G. 1993, A&AS, 98, 523
- (134) Schlegel, D. J., Finkbeiner, D. P., & Davis, M. 1998, ApJ, 500, 525
- (135) Schombert, J. M., & Bothun, G. D. 1988, AJ, 95, 1389
- (136) Schombert, J. M., Bothun, G. D., Schneider, S. E., & McGaugh, S. S. 1992, AJ, 103, 1107
- (137) Schulte-Ladbeck, R. E., Hopp, U., Greggio, L., & Crone, M. M. 2000, AJ, 120, 1713
- (138) Schulte-Ladbeck, R.E., Hopp, U., Greggio, L., Crone, M.M., & Drozdovsky, I.O. 2001, AJ, 121, 3007
- (139) Simpson, C. E., & Gottesman, S. T. 2000, AJ, 120, 2975
- (140) Simpson, C. E., Hunter, D. A., & Knezek, P. 2004, AJ, submitted
- (141) Staveley-Smith, L., Davies, R. D., & Kinman, T. D. 1992, MNRAS, 258, 334
- (142) Stil, J. M., & Israel, F. P. 1998, A&A, 337, 64
- (143) Stil, J. M., & Israel, F. P. 2002, A&A, 389, 29
- (144) Sung, E.-C., Han, C., Ryden, B. S., Patterson, R. J., Chun, M.-S., Kim, H.-I., Lee, W.-B., & Kim, D.-J. 1998, ApJ, 505, 199
- (145) Swaters, R. 1999, Ph.D. thesis, Rijksuniversiteit Groningen
- (146) Swaters, R. A., Madore, B. F., & Trewhella, M. 2000, ApJ, 531, L107
- (147) Taylor, C. L. 1997, ApJ, 480, 524
- (148) Taylor, C. L., Brinks, E., Grashuis, R. M., & Skillman, E. D. 1995, ApJS, 99, 427
- (149) Taylor, C. L., Brinks, E., & Skillman, E. D. 1993, AJ, 105, 128
- (150) Telles, E., & Maddox, S. 2000, MNRAS, 311, 307
- (151) Telles, E., & Terlevich, R. 1995, MNRAS, 275, 1
- (152) Thuan, T. X., & Martin, G. E. 1981, ApJ, 247, 823
- (153) Thuan, T.X. 1991, in Massive Stars in Starbursts, ed. C. Leitherer, N. R. Walborn, T, M. Heckman, & C. A. Norman (Cambridge: Cambridge Univ. Press), 183
- (154) Tolstoy, E. 1996, ApJ, 462, 684
- (155) Tolstoy, E., Gallagher, J. S., Cole, A. A., Hoessel, J. G., Saha, A., Dohm-Palmer, R. C., Skillman, E. D., Mateo, M., & Hurley-Keller, D. 1998, AJ, 116, 1244
- (156) Tolstoy, E., Saha, A., Hoessel, J. G., & Danielson, G. E. 1995, AJ, 109, 579
- (157) Tosi, M., Greggio, L., Marconi, G., & Focardi, P. 1991, AJ, 102, 951
- (158) Tosi, M., Sabbi, E., Bellazzini, M., Aloisi, A., Greggio, L., Leitherer, C., & Montegriffo, P. 2001, AJ, 122, 1271
- (159) van den Bergh, S. 1959, Publ David Dunlap Obs, VOl 2, No 5, p 147
- (160) van den Bergh, S. 1966, AJ, 71, 922
- (161) van den Bergh, S. 1988, PASP, 100, 344
- (162) van den Hoek, L. B., de Blok, W. J. G., van der Hulst, J. M., & de Jong, T. 2000, A&A, 357, 397
- (163) van Zee, L., Skillman, E. D., & Salzer, J. J. 1998, AJ, 116, 1186
- (164) van Zee, L. 2000, AJ, 119, 2757
- (165) van Zee, L. 2001, AJ, 121, 2003
- (166) van Zee, L., Salzer, J. J., & Skillman, E. D. 2001, AJ, 122, 121
- (167) van Zee, L., Haynes, M. P., & Giovanelli, R. 1995, AJ, 109, 990
- (168) van Zee, L., Maddalena, R. J., Haynes, M. P., Hogg, D. E., & Roberts, M. S. 1997, AJ, 113, 1638
- (169) Vázquez-Semadeni, E., & García, N. 2001, ApJ, 557, 727
- (170) Vitvitska, M., Klypin, A. A., Kravtsov, A. V., Wechsler, R. H., Primack, J. R., & Bullock, J. S. 2002, ApJ, 581, 799
- (171) Weilbacher, P. M., & Fritze-v. Alvensleben, U. A&A, 2001, 373, L9
- (172) Wilcots, E.M. & Miller, B.W. 1998, AJ, 116, 2363
- (173) Willick, J. A. 1999, ApJ, 522, 647
- (174) Wyder, T. K. 2001, AJ, 122, 2490
- (175) Young, L. M., & Lo, K. Y. 1997, ApJ, 490, 710
- (176) Youngblood, A. J., & Hunter, D. A. 1999, ApJ, 519, 55


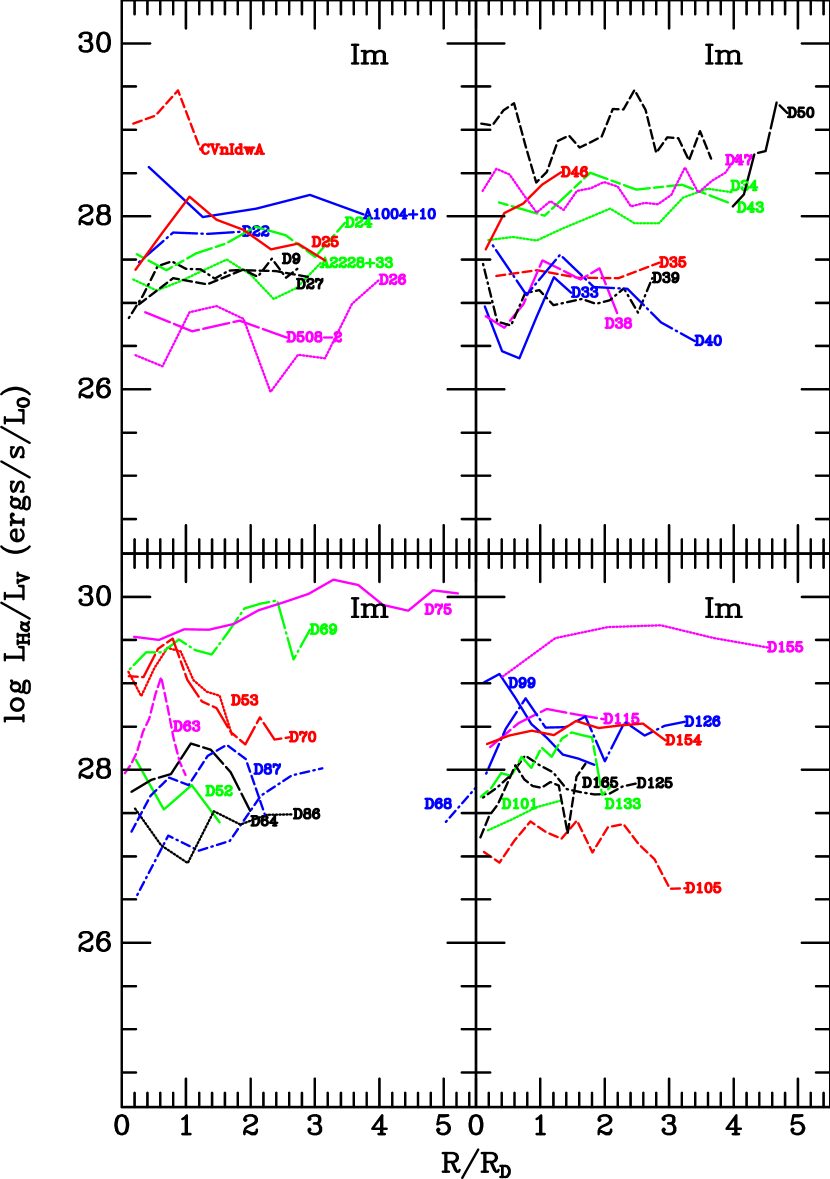
![[Uncaptioned image]](/html/astro-ph/0408229/assets/x19.png)
![[Uncaptioned image]](/html/astro-ph/0408229/assets/x20.png)


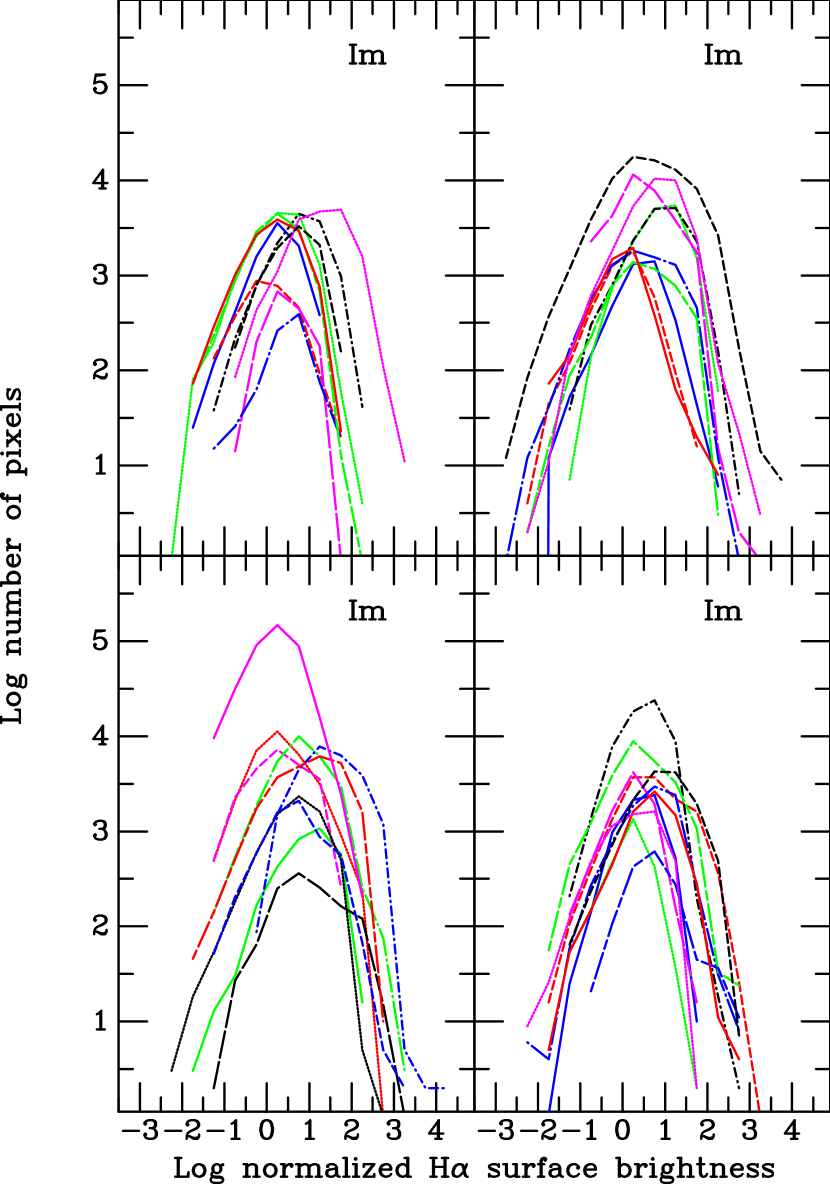
![[Uncaptioned image]](/html/astro-ph/0408229/assets/x24.png)
![[Uncaptioned image]](/html/astro-ph/0408229/assets/x25.png)