Rotation periods of Post-T Tauri stars in Lindroos systems ††thanks: Based on observations collected at Cerro Tololo Inter-American Observatory and the European Southern Observatory, La Silla, under project 66.C-0119(B)
We present a rotational study of Post-T Tauri stars (PTTSs) in Lindroos systems, defined as binaries with early type primaries on the main-sequence (MS) and late-type secondaries on the pre-main-sequence (PMS) phase. The importance of this study in comparison with previous ones is that the Lindroos sample is not X-ray selected so we avoid a possible bias towards fast rotators. In this preliminary study we have monitored eleven stars in the UBVRI bands during two campaigns of ten consecutive nights each. Eight of the observed PTTSs show periodic modulations in their lightcurves and the derived periods range from 1.9 d to 8.0 d. The comparison of these results with theoretical rotational tracks based on disk-star locking theory shows that star-disk decoupling times of 1-20 Myr could reproduce the rotational properties of the targets, assuming an initial rotation period of 8 d and a mass of 1 M⊙. We have studied the rotation-activity relations of Lindroos PTTSs and compared them with those found in other groups of PMS and zero-age main-sequence (ZAMS) 1 M⊙ stars. The Lindroos sample displays activity-rotation relations very similar to those found in TTSs. It contains a mixture of very active stars, with ratios close to the saturation level of –3, and less active (unsaturated) stars. This could be the result of different star-disk decoupling times. Future monitoring of a larger and unbiased sample of PTTS will be important to confirm the significance of these results.
Key Words.:
Stars: pre-main sequence – stars: late-type – stars: rotation – X-rays: stars – stars: binaries1 Introduction
In the last decade a large number of works have been devoted to study the angular momentum evolution of T Tauri stars (TTSs), that is, late-type stars contracting towards the main-sequence (MS). Observations of late-type pre-main sequence (PMS) stars have allowed investigators to derive the rotational properties of TTSs in different star forming regions (e.g. Bouvier et al. 1993, Edwards et al. 1993, Choi & Herbst 1996, Wichmann et al. 1998, Herbst et al. 2001a, Rebull 2001, Lamm et al. 2004). The earliest studies reported the existence of a bimodal distribution of rotational periods among TTSs in Taurus: while accreting TTSs surrounded by disks were generally slow rotators with periods longer than 4.4 days, non-accreting TTSs were faster rotators showing periods that range from a few hours to 3 days. Recent rotational studies on late-type PMS stars in Orion are more controversial: while some works do not find a bimodal distribution among late-type PMS stars (e.g. Stassun et al. 1999), other studies (e.g. Herbst et al. 2001b) have shown that the bimodal distribution is present but is mass-dependent, that is, it is only found in stars with masses above a certain limit (0.25 ).
Most of the results from the rotational studies support disk-locking as the most plausible mechanism to regulate the angular momentum of late-type PMS stars (see Rebull et al. 2002). The so-called disk-locking theory (e.g. Königl 1991, Collier Cameron & Campbell 1993, Shu et al. 1994, Bouvier et al. 1997a) explains the rotational properties of late-type PMS stars as a result of magnetic coupling between the star-disk system, that prevents the star from spinning-up during the mass accretion phase. Once the disk is dissipated the couping no longer exists and the star begins to rotate faster due to on-going contraction to the MS.
The rotational properties of late-type Zero-Age Main-Sequence (ZAMS) dwarfs in open clusters like the Pleiades or Per have been also extensively studied in different works (e.g. Stauffer et al. 1989, Soderblom et al., 1993, Prosser et al. 1995, Allain et al. 1996, Queloz et al. 1998, Terndrup et al. 2000). These works have reported a large scatter in the rotational rates of these stars: while half of the objects display projected velocities () of a few km/s, half of them are faster rotators with velocities up to 200 km/s (the so-called ultra fast rotators, UFR’s). A decoupling between the radiative core and the convective envelope has been studied to explain the large spread of rotational properties among ZAMS stars (e.g. Allain 1998). In the case of older clusters like the Hyades (Radick et al. 1987, Stauffer et al., 1997), the rotation rates are significantly smaller and most of the late-type stars display projected velocities of km/s.
Post-T Tauri stars (PTTSs, Herbig 1978) are intermediate between the oldest T Tauri stars and the youngest dwarfs in open clusters. As noted by Bouvier et al. (1997b), it is precisely at this evolutionary stage when the stellar interior changes from completely convective to radiative, so the internal changes may be reflected in the surface rotation properties. Two main studies have tried to derive the rotational properties of PTTSs: Bouvier et al. (1997b) and Wichmann et al. (1998) in the Taurus and Lupus star forming regions (SFR), respectively. Both works showed that most of the PTTSs under study were fast rotators. However, this conclusion could be the result of their sample selection criteria which included the X-ray detection of the sources. X-ray selected samples tend to be biased towards fast rotators: late-type stars show a connection between magnetic activity and rotation, with the strongest X-ray emitters being the fastest rotators (e.g. Bouvier 1990, Neuhäuser et al. 1995). Hence, an unbiased sample of PTTSs is required to understand the rotational properties of late-type stars at that evolutionary stage.
In this context, the so-called Lindroos sample of PTTSs (Lindroos 1986) is important because it is not X-ray selected and complements the previous samples of PTTSs. Lindroos systems are defined as visual binary systems mainly comprised of early-type primaries on the MS and late-type secondaries (Lindroos 1985). The ages of Lindroos primaries have been derived through photometric and spectroscopic observations, showing values between 107-108 yr. This age interval is comparable to the contraction time-scale of late-type stars to the MS. If the systems are physically bound, the secondaries are late-type PMS stars still contracting to the ZAMS, that is, PTTSs.
Lindroos (1985, 1986) carried out an exhaustive study of 253 visual binary systems and found 78 binary or multiple systems likely to be physical. A total of 45 companion candidates with spectral types later than F0 were selected among the binary and multiple systems. Pallavicini et al. (1992) and Martín et al. (1992) have reported the presence of indicators of youth (Li I absorption line) and activity (H emission line) in 40% of the Lindroos late-type secondaries. The analysis of the X-ray emission from 22 Lindroos systems resolved by the ROSAT High Resolution Imager (HRI) has shown that most of the Lindroos PTTSs candidates are X-ray emitters, with X-ray luminosities comparable to those from younger late-type PMS stars (Huélamo et al. 2000).
In this preliminary work we have analyzed the rotational properties of bona-fide PTTSs in Lindroos systems. Given that the sample is not X-ray selected, it is ideal to study the rotational properties of PMS stars in that evolutionary phase. Our main goal is twofold: first, we will compare the observed rotational properties with theoretical predictions of angular momentum evolution of late-type stars and, second, we will derive the rotation-activity relations for our sample and compare them with groups of late-type stars at different evolutionary stages. This way, we can trace the evolution of activity parameters as stars evolve and reach the MS. The Lindroos sample is described in Section 2. The optical observations of the sample are described in Section 3, while the analysis of the data is provided in Section 4. The main results are described in sections 5, 6 and 7, while our preliminary conclusions are drawn in Section 8.
| HD | Sp.Type1 | Distance2 | Sep.3 | V4 | Av5 | 6 | Mass7 | Age8 |
|---|---|---|---|---|---|---|---|---|
| (pc) | (AU) | (mag) | (mag) | (erg/s) | (M⊙) | Myr | ||
| 560 B | G5 + B9 | 1009 | 770 | 10.37 | 0.00 | 30.56 | 0.95 | 20/30/36/30 |
| 17543 B | F8 + B6 | 18737 | 4625 | 10.73 | 0.21 | 30.17 | 1.18 | 24/28/-/25 |
| 23793 B | F3 + B3 | 17331 | 1557 | 9.41 | 0.08 | 30.25 | - | 28∗ |
| 27638 B | G2 + B9 | 828 | 1558 | 8.43 | 0.00 | 28.49 | 1.25 | 12/15/19/15 |
| 33802 B | G8 + B8 | 744 | 940 | 9.92 | 0.01 | 30.03 | 0.90 | 25/50/47/37 |
| 38622 C | G2 + B2 | 24554 | 6125 | 12.01 | 0.04 | 29.99 | 1.05 | 30/100/-/110 |
| 40494 B | G8 + B3 | 26338 | 8889 | 12.66 | 0.00 | 28.57 | 0.94 | 35/100/-/76 |
| 53191 B | G3 + A0 | 20725 | 3519 | 11.75 | 0.05 | 29.53 | 1.00 | 30/80/-/39 |
| 60102 B | G8 + B9.5 | 20625 | 3378 | 11.86 | 0.22 | 30.62 | 1.00 | 15/25/-/20 |
| 86388 B | F5 + B9 | 17721 | 1628 | 9.98 | 0.02 | 29.42 | 1.28 | -/30/-/110 |
| 90972 B | F9 + B9.5 | 14716 | 1617 | 9.65 | 0.03 | 30.11 | 1.25 | 14/18/18/15 |
| 108767 B | K2 + B9 | 279 | 648 | 8.43 | 0.00 | 28.95 | 0.8 | 40/90/-/93 |
| 109573 B+ | M2.5 + A0 | 673 | 509 | 13.3 | 0.00 | 29.75 | 0.3 | 10 |
| 113703 B | K0 + B4 | 12712 | 1448 | 10.8 | 0.00 | 30.22 | 0.98 | 15/25/19/23 |
| 113791 B | F7 + B2 | 12613 | 3163 | 9.38 | 0.00 | 29.98 | 1.22 | 18/22/11/21 |
| 127304 B | K1 + A0 | 1068 | 2734 | 11.37 | 0.04 | 28.73 | 0.84 | 50/100/-/100 |
| 129791 B | K5 + B9.5 | 12916 | 4554 | 12.93 | 0.26 | 29.82 | - | 39∗ |
| 143939 B | K3 + B9 | 16727 | 1436 | 11.80 | 0.00 | 30.52 | 1.15 | 2.5/7/8.3/6 |
Notes: 1. Adopted from Pallavicini et al. (1992). The spectral type of the early-type primary star is also provided; 2. Deduced from Hipparcos parallax of the primary star; 3. Separation between the stars of the Lindroos binary system using Hipparcos parallax; 4. Adopted from Pallavicini et al. (1992) 5. Adopted from L86; 6. Adopted from Huélamo et al. (2000); 7. Masses estimated adopted from Gerbaldi et al. (2001) using Palla & Stahler (1999) evolutionary tracks; 8. Ages adopted from Gerbaldi at al. (2001). The four entries correspond to the ages computed with D’ Antona & Mazzitelli (1998), Palla & Stahler (1999), Siess et al. (2000) and Tout et al. (1999) evolutionary tracks, respectively; + Data from Webb et al. (1999); ∗ Ages adopted from L86; data not available.
2 The Lindroos sample of PTTSs
The Post-T Tauri stars in the sample were selected according to these criteria: their ages must be within 10-100 Myr and they must show indications of being physically bound to their primaries. The ages of the Lindroos PTTSs have been derived using four sets of evolutionary tracks (Gerbaldi et al. 2001). Different models provide different age estimations (see Table 1) but, in general, all lie within the selected interval. Most of the late-type stars in the sample show ages and/or radial velocity measurements consistent with those of the early-type primaries. Moreover, if the systems are bound the secondaries are in the PMS phase. Hence, we have also looked for indicators of youth among the sample to reinforce the evidences of being physically bound to their primaries (see Jensen 2002). All these properties are summarized in Table 7 of Huélamo et al. (2000). The final sample contains 18 stars.
The Lindroos sample is not X-ray selected implying that our rotational study should not be biased towards fast rotators. However, Lindroos PTTSs are found in binary systems and we were concerned that such binarity could introduce a different bias in our analysis. We have analyzed whether the Lindroos secondary stars studied here are representative PTTSs or, on the other hand, they are somehow ”special” PTTSs because of being members of binary systems. In the next subsections we have analyzed two binarity effects that can influence the rotational evolution of these young objects: first, we have analyzed if the separation between the members of the binary systems is small enough to produce a circularization of their orbits and, subsequently, a synchronization of both the orbital and rotation period. Secondly, we have analyzed the effect of the UV radiation field of the early-type primaries on the late-type secondaries. Given that such radiation can accelerate the dissipation of circumstellar matter around PMS stars, it could produce an earlier spin-up of the PTTSs (in the framework of the disk-star locking theory).
2.1 Binarity and rotation: Circularization
It is an observational fact that close binary systems with orbital periods smaller than a given critical value (called the circularization period) evolve to circularize their orbits (e = 0). In this process, a synchronization of their rotational and orbital periods is observed (e.g. Zahn 1977, Mathieu 1992, Melo et al. 2001). The mechanism that produces such circularization is still not well understood (i.e. a tidal-torque mechanism or a hydrodynamical mechanism).
The circularization is a slow process, so that the larger the separation of the system the longer it takes to circularize the orbit. Observations of PMS binary systems have shown that all short period () binaries display circular orbits at ages of 106 yrs (Melo et al. 2001). This period can be taken as a circularization cutoff period for PMS stars. The lack of circular or near-circular (e 0.1) orbits for PMS binaries with orbital periods longer than the cutoff period is evident for systems with (Duquennoy & Mayor 1991, Pan et al. 1998). Taking into account the separations and the masses of the Lindroos systems, we have derive orbital periods larger than 1000 yr. Hence, we do not expect any circularization process among the Lindroos sample.
2.2 Binarity and rotation: Stellar Winds
B-type stars mostly radiate in the far ultraviolet (FUV) range. If FUV radiation impacts onto a circumstellar disk it can produce its photoevaporation whenever the incident FUV flux is of the order of 104 , being the average UV photon flux in the local interstellar medium (Johnstone et al. 1998). As an example, such a radiation flux is produced by O-type stars in the Orion Trapezium which photoevaporate disks up to a distance of 1pc (Störzer & Hollenbach 1999). In the case of the Lindroos systems, the presence of a B-type star close to a late-type companion could produce the same effect.
As shown in Table 1, the spectral types of the Lindroos primaries range between B2 and A0. As discussed by Bouvier & Corporon (2001), the distance up to which these stars produce the minimum flux required to photoevaporate disks is of the order of 104 AU for a B3 star and about 500 AU for a A0 star. Most of the Lindroos primaries are late B-type stars and the separations of the systems range between 600 AU and 9000 AU (with a mean value of 3000 AU). Hence, we do not expect any effect of the UV radiation field from the primaries into the secondaries. There are two exceptions, HD 113703 B and HD 113791 B, with early B-type primaries (B4 and B2) and separations smaller than 3500 AU. These two stars will be discussed in section 6.
3 Data acquisition
Lindroos PTTSs are spread over different regions in the Northern and Southern hemisphere. In order to monitor the stars in the northern hemisphere, four weeks were allocated at the 1.5m Spanish telescope and the 1.23m telescope at the Calar Alto Observatory (CAHA). Unfortunately, we could not obtain good quality data due to poor weather conditions.
We observed the southern sources in two campaigns in different observatories: seven sources were observed at the 0.9m CTIO telescope at the beginning of January 2001, while a second campaign at the 1.5m Danish telescope in La Silla Observatory in February 2001 allowed us to observe the rest of the targets. In both campaigns (CTIO and La Silla) we monitored the sources during 10 consecutive nights each. The stellar data of the observed sample is summarized in Table 1. Note that two of the stars in the sample could not be monitored: HD108767 B was too bright and saturated the detector, while HD 109573 B, the only M-type star of the sample, is too faint and too close to the early-type primary.
3.1 CTIO 0.9m telescope data
The observations at the 0.9 m CTIO telescope were carried out during ten consecutive nights in January 2001 (from the 4th to the 13th). The detector used was an ARCON 20242024 pixels CCD camera, which is a multi-readout camera with four different amplifiers. The plate-scale of the camera is 0.396”/pixel, providing a total field of view of . We made use of the UBV(RI)C filter set.
We observed the Lindroos secondary stars during ten nights with random spacing times to avoid as much as possible false periodicities. Most of the stars were observed at least twice during the same night to be sensitive to periods shorter than one day. The exposure times of the scientific images ranged between 0.5 s and 10 s. The shortest exposure times were necessary to avoid the light of the primary star in those binaries with smaller separations. In these cases, several consecutive exposures were taken in each filter in order to average them and to increase the signal to noise ratio (SNR) of the final images.
The data were reduced using the QUADPROC/CCRED package into IRAF (Image Reduction and Analysis Facility111IRAF is distributed by the National Optical Astronomy Observatories, which is operated by the Association of Universities for Research in Astronomy, Inc. (AURA) under cooperative agreement with the National Science Foundation.), specially designed to reduce multi-readout data. All the images were bias subtracted and flatfield corrected. The shutter delay of the camera is not negligible, so we have applied a shutter correction to the images to compensate the inhomogeneous illumination of the detector at short exposure times. In order to do this we created shutter masks at different exposures times. After their normalization, we corrected the scientific images multiplying by the corresponding shutter mask. The correction must be applied to images with exposures times shorter than 10 s.
We carried out aperture photometry on the sources. For the closest pairs (separations 10) with a very bright primary (-mag6 mag), the emission from the late-type secondary could be contaminated with the light from the early-type star. In these cases we have applied multi-aperture photometry on the secondaries correcting the magnitudes with field stars. We have measured the brightness of the objects in both the individual and the averaged images to check the reliability of the combined image. In general, there is a good agreement between the magnitudes derived in this two ways. We have assumed that the uncertainties in the final magnitudes are given by the ratio of the standard deviation of the mean of the individual magnitudes to the square root of the number of individual observations.
Apart from the Lindroos objects we have also selected objects in the field of view as comparison stars. We have used these stars to carry out differential photometry on the Lindroos secondaries.
3.2 La Silla 1.5m Danish telescope data
The data from the 1.5m telescope were collected from the 29th January to the 8th February 2001. The telescope is equipped with DFOSC, a 20242024 pixels CCD camera with a plate-scale of 0.39/pixel. The total field of view is 1313. We used the UBVRi filter set.
The data reduction was carried out using the CCDRED package within IRAF. The images were bias and flat-field corrected. DFOSC is equipped with a fast shutter (the shutter delay is of the order of milliseconds), so in this case it was not necessary to apply a shutter correction to the data. For those binaries with smaller separations we took several short exposures in each filter. The final images are the result of combining all individual frames.
The optical magnitudes have been measured following the same procedure described for the CTIO data: we carried out aperture photometry on the sources; for the closest pairs (separation 5) we carried out multi-aperture photometry correcting with field stars. Finally, we carried out differential photometry of all the targets using comparison stars which were monitored during the ten nights.
4 Analysis of the data
4.1 Variability analysis
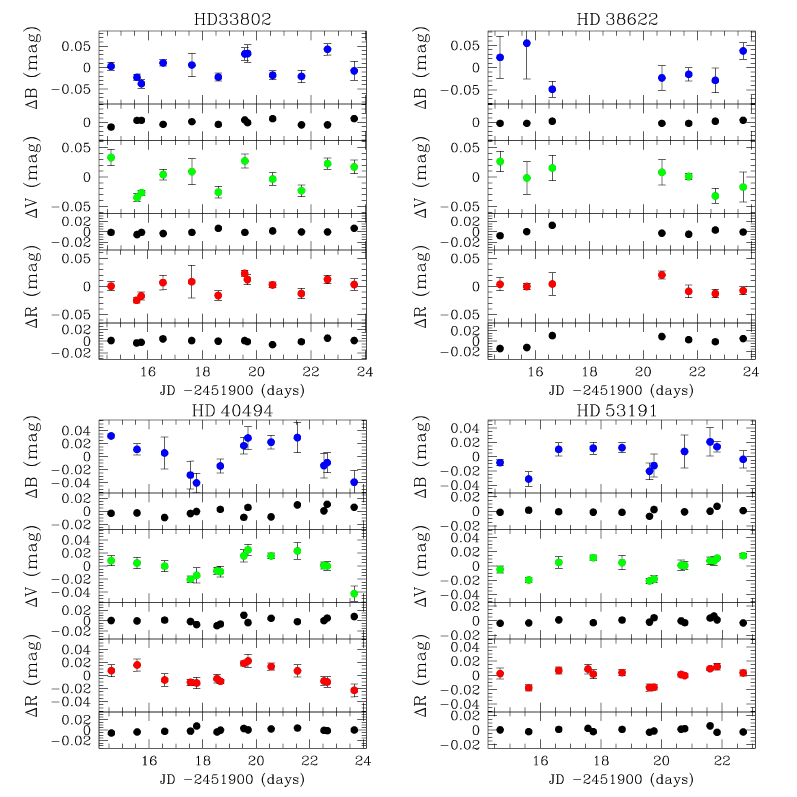
The optical lightcurves of the sample in the BVR-bands are displayed in Fig. 1. We have constructed them subtracting the magnitudes of the targets from the magnitudes of an ’artificial comparison’ star. The ’artificial’ stars have been derived in the following way: for each observation we have analyzed the lightcurves of several field stars in order to select those that are not varying over the ten nights. From these stars we have rejected those displaying instrumental magnitudes and colors very different from that of the targets. We have finally weighted the selected stars according to their observational errors (the weight is taken as the inverse of the square of the magnitude error, ) and computed their averaged magnitude. The lightcurve of the corresponding ’artificial’ star is shown in the panel below the lightcurve of each target in Fig. 1.
In order to detect variability in the stellar light of the Lindroos stars, we have adopted the following criteria: we consider the Lindroos stars to be variable when the standard deviation of their mean magnitude over the ten nights is three times larger than the standard deviation of the mean magnitude of the artificial star, that is, .
We have analyzed the lightcurves of each target in the five filters. In general, the U-band data show a lower SNR when compared to the BVRI filters given that the targets (and the comparison stars) are fainter at that wavelength. However, the amplitudes in this band are larger, so in most of the cases we can use the U-band to report significant variability of the targets.
4.2 Determination of rotation periods
The rotation periods have been computed from the photometric data applying two different methods: the string-length (SL) method proposed by Dworetsky (1983) and the Scargle periodogram (SP, Scargle 1982).
The string length method works in the phase space and it is well suited for samples with a small number of unevenly spaced data points (Dworetski 1983). This method seems not to be well-suited for large and clumped datasets (Scholz & Eislöffel 2004). In this method, a rotational period is assumed and the phase-folded lightcurve is constructed. Afterward, the length of the string that joins consecutive points in the folded diagram is computed. The string-length algorithm is then applied to a set of trial periods and the one showing the shortest string length is chosen as the best period. We have applied the algorithm to all the targets in the different filters.
In order to check the significance level of the derived periods, we have performed several tests. Firstly, we have generated 10000 synthetic lightcurves using a Monte-Carlo method. The 10000 aleatory samples have the same temporal sampling as our data (that is, we have preserved the Julian Dates) but aleatory photometric values within the amplitudes of the observational data. We have applied the string length method to the 10000 synthetic lightcurves. Each data set provides a minimum value of the string length that corresponds to the best period. The percentage of samples showing a string length larger than the string length of the observational data provides the confidence level of the period determination. We assignee a 99% confidence level to a case in which all the randomized data show a string length larger than that obtained with the observational data, because we consider that we cannot discriminate between 99% and 100%. Whenever more than one period is found to be statistically significant, the visual inspection of the data and the quality of the phase-folded lightcurve has helped us to choose the most probable one. The main disadvantage of this test is that if the random magnitudes can adopt any value within the given amplitude, the probability of having a string value larger than the one found in the real data can be high. This translates into a high significance of the derived period that may be overestimated.
As a second test, we have generated 10000 aleatory samples preserving the Julian Date and randomly distributing the real magnitude values. We have applied the SL method to the 10000 samples and kept the minimum SL for each of them. The confidence level is given the fraction of samples with SL values smaller than the one obtained with the real data. The results obtained with this method are similar to the ones obtained with the first test.
As a final test, we have generated 10000 pseudo-aleatory samples retaining the Julian Dates of the observations and generating randomized magnitudes within a given interval. The magnitudes are not completely random in the sense that they can only adopt values following this expression:
| (1) |
where is a random generated increment that follows a Gaussian distribution, with maximum value the upper limit for the photometric error. The idea behind this method is to increase the noise of the data and to check whether the period that we found in the original data persists or not. In general, we have adopted the derived photometric error as the maximum value of the increment. However, we have also used larger values to analyze the effect of a large noise in our period search, given that a spurious period should be much affected by the extra noise. The fact that the increments follow a gaussian function ensures that the probability of having a magnitude that differs significantly from the measured one is smaller than the probability of having a magnitude closer to the most probable value. In this way, the string length of the random sample is not artificially enlarged. After applying the string length method to the 10000 aleatory samples generated in this way, we have obtained that the previously derived periods persist. Moreover, we do not get significant alias periods for most of the stars in the sample.
We have also analyzed the periodicity of our lightcurves using the Scargle method, which works in the frequency domain. We have used Interactive Data Language (IDL) routines to derive the periodogram of the sources within a period interval of Pmin=1 days to Pmax= 10 days. In the case of HD 60102, we have considered a Pmin=0.5 days given the better temporal sampling of the data. We have also derived the SP of the ’artificial’ comparison stars and we have checked that the periods obtained for the Lindroos sample are not present in their periodograms.
Given that most of the lightcurves show unevenly distributed datapoints, we have not applied Horne & Baliunas (1986) to derive the false alarm probability (fap). Instead, we have generated 10000 aleatory samples preserving the Julian Date and randomly distributing the magnitude values (as in the case of the SL method). We have derived the Scargle periodogram for each sample and retained the power of the highest peak. The significance level is given by the fraction of samples with power values smaller than the one obtained with the real data.
As an extra test, we have averaged the data points taken during a single night and repeated the period search applying both the SL and the SP methods. In the latter case we have derived the fap following Horne & Baliunas (1986). As a result, the derived periods are similar to the ones derived previously. The faps are larger than those derived with our significance method for some of the stars. We think this result is related with the small number of data points used to derive the periodogram.
The results provided by the two methods, SP and SL, are shown in Table 2. We can consider as more secure (or probable) periods those that fulfilled the conditions: (i) the periods are similar in both the V- and B-band. We have chosen these two bands because they provide the best combination of amplitude and signal to noise ratio. Whenever possible, we have also used the R-band and/or the U-band and/or the I-band data to confirm the periodicity; (ii) such periodicity is not found in the comparison stars and (iii) the confidence level is higher than 95%. We have classified as less secure (or possible) those periods that only have data in one optical filter but fulfilled statements (ii) and (iii) and those periods that fulfilled (i) and (ii) but show confidence levels between 90-95%.
The results for each star are discussed in detail in the next section.
| Star | period | ||||||||
| SP (B-band) | SP (V-band) | SL (B-band) | SL (V-band) | ||||||
| (mag) | (mag) | (mag) | (mag) | (mag) | (days) | (days) | (days) | (days) | |
| (a) | |||||||||
| HD 33802 B | 0.15 | 0.08 | 0.07 | 0.05 | 2.8 (99) | 2.8 (99) | 2.8 (98) | 2.8 (99) | |
| HD 40494 B | 0.30 | 0.09 | 0.07 | 0.05 | - | 6.1 (99) | 6.4 (99) | 6.4 (99) | 6.4 (99) |
| HD 53191 B | 0.10 | 0.05 | 0.04 | 0.03 | 0.03 | 4.3 (99) | 4.4 (99) | 4.5 (97) | 4.4 (99) |
| HD 60102 B | 0.14 | 0.12 | 0.09 | 0.09 | 0.09 | 1.8 (99) | 1.9 (99) | 1.8 (99) | 1.9 (99) |
| (b) | |||||||||
| HD 90972 B | - | 0.05 | 0.04 | 0.04 | 0.04 | 3.2 (91) | 3.2 (91) | 3.4 (91) | 3.2 (93) |
| HD 113703 B | - | 0.09 | 0.05 | 0.05 | 0.04 | 8.2 (99) | 7.7 (98) | 8.1 (99) | 7.6 (99) |
| HD 113791 B | 0.08 | - | - | - | - | 3.9 (96)1 | - | 3.81 (98) | - |
| HD 143939 B | - | - | - | 0.07 | 0.07 | 3.02(97) | 3.23 (85) | 3.02 (97) | 3.23 (97) |
| (c) | |||||||||
| HD 86388 B | - | - | 0.05 | - | - | - | 5.3 (85) | - | 5.7 (90) |
| HD 38622 C | - | 0.10 | 0.06 | 0.03 | - | - | - | - | - |
| HD 129791 B | 0.07 | 0.03 | 0.03 | 0.03 | 0.02 | - | - | - | - |
Notes: The sample has been divided in three groups according to the uncertainties of the derived periods: (a) stars with more secure (or probable) periods, (b) stars with less secure (or possible) periods, and (c) stars without periods and stars for which we could not derive a period; 1 Obtained with U-band data; 2 obtained with R-band data; 3 obtained with I-band data
5 Results
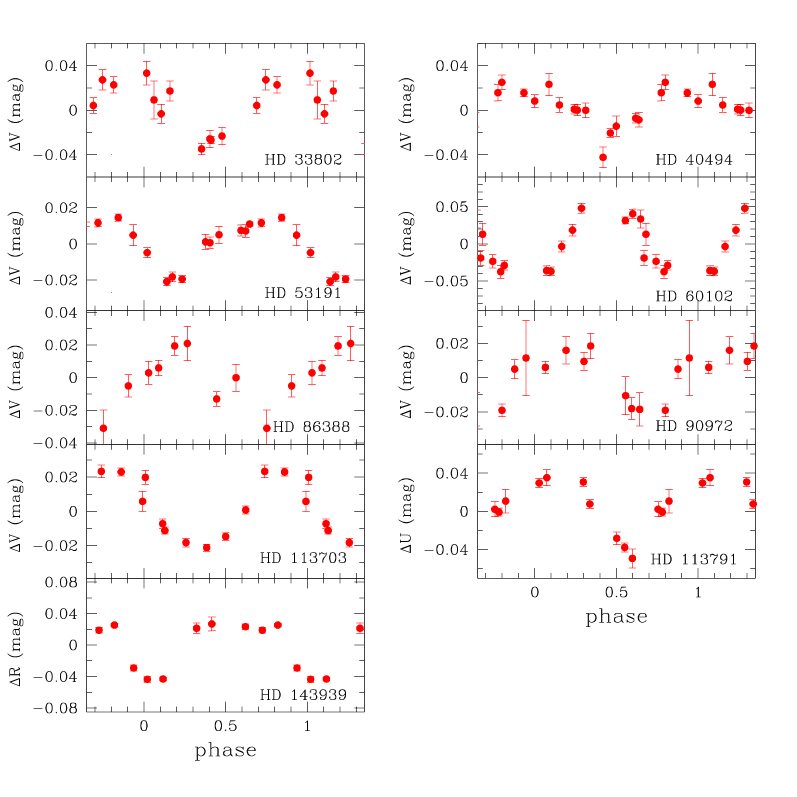
The phase-folded lightcurves of the targets have been plotted using the periods provided in Table 2. They are shown in Figure 2. The amplitudes derived in the BV bands are very similar to those derived by Wichmann et al. (1998) and Bouvier et al. (1997b) in their samples of PTTSs. We have analyzed the individual stars separately:
HD 33802 B: it is a variable star according to its BVR lightcurves (Figure 1). The data in the three filters are in phase and they display a significant variation in comparison with the artificial star. The derived period is 2.8 days for the BV data, and a period of 3.0 days for the R-data. According to the lightcurves, a period of 2.8 days fits better the observed variation. We have obtained the same result with the two methods, with a confidence level of 99%.
HD 38622 C: This PTTSs could not be monitored during the ten consecutive nights given its proximity to the moon path. We have plotted the obtained data points in Figure 1. The star is variable in the BVR filters but we cannot report any periodicity due to the scarcity of data.
HD 40494 B: We have recorded a clear modulation of the light in the BVRI filters. The string-length method provides two periods to fit the data: 6.4 days (VB-bands) and 5.6 (R-band). The minimum value of the string-length is obtained for 6.4 days with a significance of 99%. Moreover, the visual inspection of the data suggests that a period larger than six days fits better the observed modulation. The SP method provides a period of 6.4 d for the V-band and 6.1 d for the B-band. We have constructed the phase-folded lightcurve using a value of 6.4 d (see Figure 2).
HD 53191 B: The UBVRI lightcurves of HD 53191 B show a clear modulation over the ten nights of observations. The minimum and maximum values of the brightness are observed at the same Julian dates in the five filters. We have found a large number of comparison stars in the field of view of HD 53191 B whose relative brightness is constant over the ten nights. The derived period is 4.4 days with the two methods, with a significance level of 99%.
HD 60102 B: This source shows clear variability in all lightcurves although it is difficult to see a periodic modulation in the data. We observed the star three times during one of the nights and we could see that the object is varying significantly in a short timescale (see Figure 1). We have derived a period of 1.9 days (UVR-bands) that provides a smooth phase-folded lightcurve. The B-band provides a very close period of 1.8 d. We obtain the same result with the two methods with a significance level of 99%.
If we averaged the data points, the SP method provides a period of 2.3 days with a lower significance level (96% in VR and smaller in the UB-bands). The phase-folded lightcurve is not well fitted with such period in any of the optical bands, so we have rejected this period.
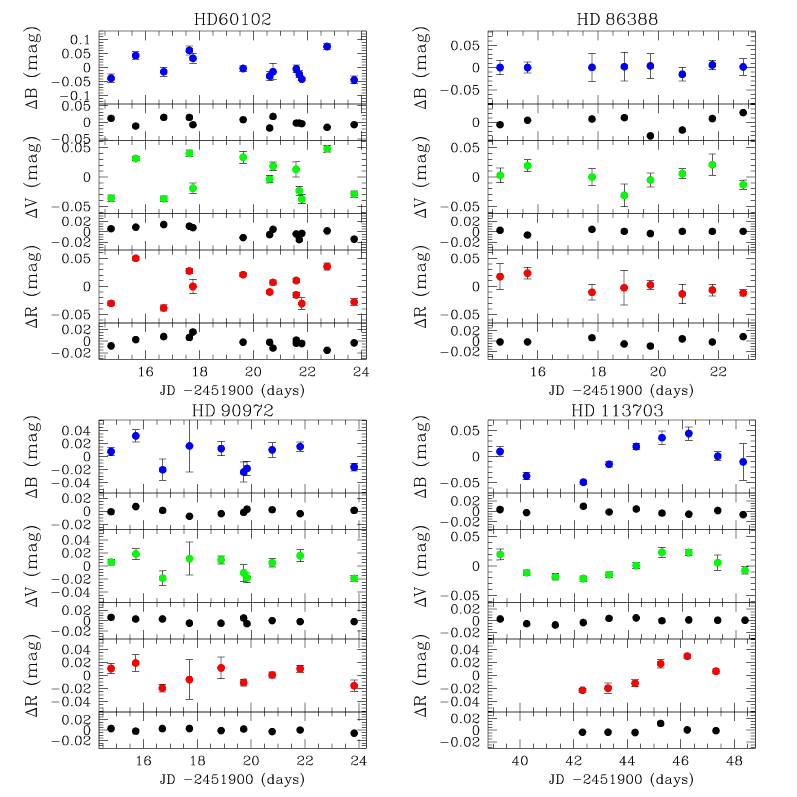
HD 86388 B shows variations in the V-band lightcurve, but we cannot study this variation in the BRI filters due the lack of non-variable comparison stars.
We have applied the string-length method to the V-band data obtaining a period of 5.7 days with a confidence level smaller than 90%. When using the Scargle periodogram we derived a photometric period of 5.3 days and a confidence level of 85%. The visual inspection of the V-band lightcurve shows a clear modulation. However, given that (i) there is only one band to derive the period and (ii) the significance level is very low, we conclude that more data is needed to validate the periodicity of this object.
HD 90972 B: In the case of HD 90972, the U-band data are noisy and the artificial star shows a large scatter, so we have only used the BVRI data to study the variability and periodicity of the object. The target shows a significant variability in these four filters over the ten observing nights. The errors associated to the data points are larger than in other stars because the separation of this Lindroos system is small (11) and the primary star is very bright (-mag = 5.6 mag). As a result, the multi-aperture photometry is less accurate than in other targets.
The SL provides a period of 3.3 d in BVR-bands with a confidence level of 93%. The SP provides a period of 3.2 d (in BVR-bands) with a 91% confidence level. The observational data are well fitted with a period of 3.3 d, as shown in the phase-folded lightcurve (Figure 2). However, we have classified this period as ’possible’ given its relatively low significance level.
HD 113703 B: The PTTSs HD 113703 B was observed with the 1.5 m Danish telescope on La Silla. We obtained lightcurves in the BVI filters. We have not considered the R-band data of this object, given that it is too bright and it was saturated in some of the exposures. In the U-band there were no suitable reference stars.
The BV-band lightcurves show a clear modulation and we have found two significant periods: 7.6 days (obtained with the V-band data and 8.0 days (obtained with the B- and I-band data). We have also derived a shorter period of 0.9 days that fits the observed data. We have found that this period is an alias of 8 days. Unfortunately, our time sampling is not short enough to confirm a short period of 0.9 days. The visual inspection of the lightcurves suggests that a period of 8.0 days is the one that better reproduces the observed modulation, so we have adopted this value as the most probable. Given this discrepancy in the V and B-data and the possibility of having a shorter period, we have classified the derived period as ’possible’. The phase-folded lightcurve is shown in Figure 2.
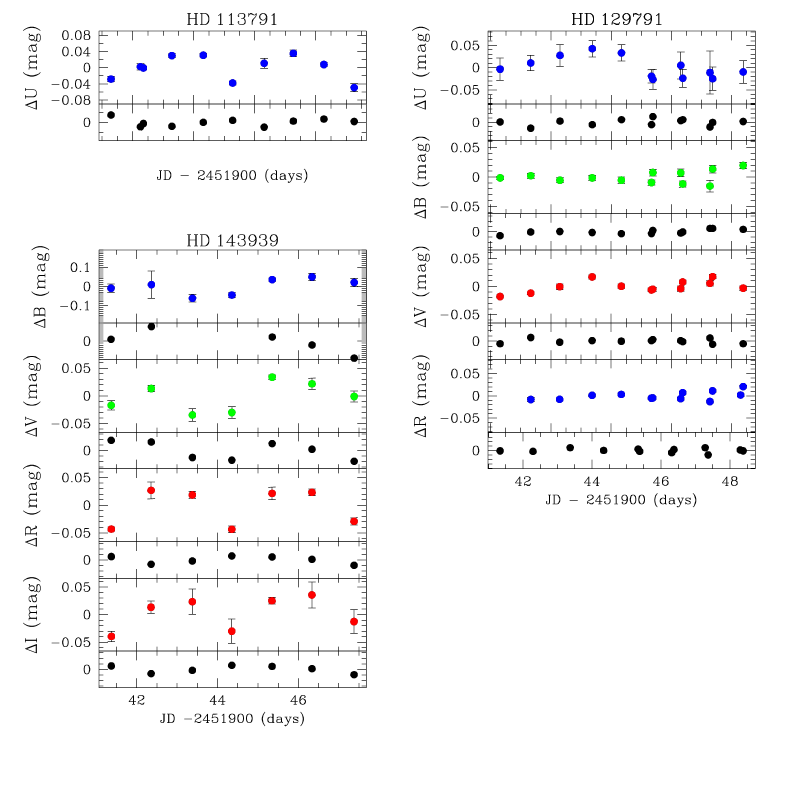
HD 113791 B could only be monitored in the U-filter given that it is too bright at longer wavelengths, saturating the detector. The U-band lightcurve of HD 113791 B is displayed in Figure 1. It shows a clear variability in its brightness displaying a U-band amplitude 0.08 mag. We have derived a possible period of 3.8 days with a confidence level of 98%. A very similar result is obtained with the SP method. As seen in Figure 2, this rotation period fits the modulation observed in the U-band data. Due to the lack of data in a different optical filter, we have classified the period as ’possible’.
HD 129791 B: this K-type star seems to be a variable source according to its U-band lightcurve. The standard deviation of the data is exactly 3 times that of the artificial star. The amplitude in this band is 0.07 mag, which is one of the smallest among the sample. In the BVRI-bands the amplitudes are 0.03 mag, with the artificial star varying at the same level, so these bands do not provide further information.
There is no obvious modulation in the U-band lightcurve of HD 129791 B. The star was observed twice during three different nights, so we have studied if it could be a short-period variable. After applying the SL and SP methods we do not find any significant period. Hence, we can only conclude that HD 129791 B seems to be a variable star without an obvious periodicity within ten days of monitoring.
HD 143939 B: We have found non-variable comparison stars only in the R- and I-band. Using the R-band data we have derived a period of 3.0 d which provides the phase-folded lightcurves displayed in Figure 2. The confidence level is of 97%. We obtain the same result with both the SL and the SP methods. In the case of the I-band we obtain a periodicity of 3.2 d with a confidence level of 97% when using the SL method. The SP method provides a similar period value but a lower significance (85%). Hence, we have classified this period as ’possible’.
6 Rotational properties of Lindroos PTTSs: comparison with theoretical models
In order to examine the rotational properties of Lindroos PTTSs, we have represented the sample with probable and possible periods (groups a and b in Table 2) in an age-rotation diagram (Fig. 3). The rotational evolution of late-type PMS stars is mass-dependent. The estimated masses of the Lindroos PTTSs with measured rotation periods range between 0.9–1.2 (see Table 1), so we have focused our study on this mass range.
As shown in Fig. 3, the Lindroos PTTSs populate the central part of the diagram with ages that range from 10-100 Myr and periods larger than 1.9 d. We have represented the ages derived by Palla & Stahler (1999, PS99 hereafter) which results on a mixture of PMS and ZAMS stars among the Lindroos sample. If we consider the ages provided by D’Antona & Mazzitelli (1998, DM98), the Lindroos sample populate a narrower age interval (10-35 Myr) of the diagram (see Table 1) and all the stars can be classified as PMS stars.
We have overplotted the PTTSs samples studied by Bouvier et al. (1997b) and Wichmann et al. (1998). In both cases we have only considered stars with masses between 0.9 and 1.2 . The comparison of the three samples of PTTSs shows that they are complementary: while most of the Lindroos PTTSs display periods longer than 3 d, the other two samples contain faster rotators that populate the lower part of the diagram. This result is probably related with the different criteria used to select the samples: X-ray selected samples mostly contains fast rotators, while non X-ray selected samples can contain both slow and fast rotators. Our study has not revealed the presence of very slow rotators among the Lindroos PTTSs, that is, the slowest rotators among the Lindroos sample show rotation periods comparable to the largest periods reported in Lupus and Taurus PTTSs samples.
The rotational properties of the Lindroos systems can be compared with the predictions of the disk-locking theory. In order to do this we have used the rotational tracks by Bouvier et al. (1997a). Fig. 3 shows the theoretical age-rotation diagram for 1 star (suitable to study the Lindroos PTTSs with masses between 0.9-1.2) and an initial rotation period of d for CTTSs. This value is based on the period distribution of CTTSs in the Taurus SFR (Bouvier et al. 1993). Younger late-type stars presumably undergoing a mass accretion process (with masses 0.25 M⊙) in the Orion Nebula Cluster (ONC) show a broader range of rotation periods but they also display a peak at 8 d in their period distribution. Only a 5% of the sample of periodic variables display periods longer than 12 d (e.g. Attridge & Herbst 1992, Eaton et al. 1995, Choi & Herbst 1996, Stassun et al. 1999, Herbst et al. 2002). Hence, we have kept the value of 8 days as the initial rotation period in the model. The solid and dotted lines represent the rotational tracks for different star-disk decoupling times, which range between .
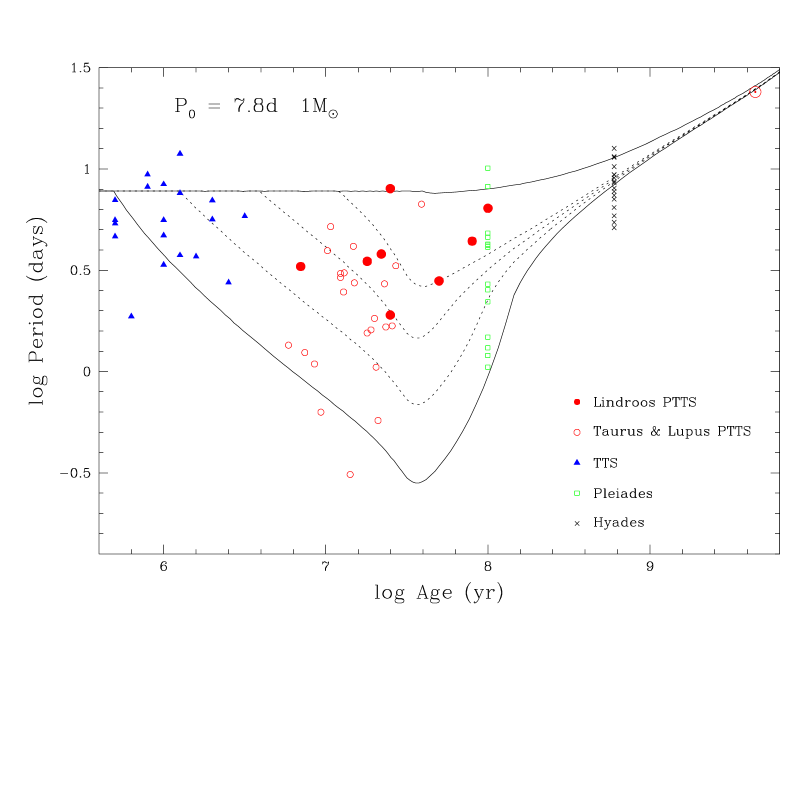
The Lindroos PTTSs lie in different regions within the diagram (Fig. 3) which suggests different decoupling times for the star-disk system. Their rotational properties can be explained assuming decoupling times between 1-20 Myr. Note that HD 113703 B and HD 113791 B, the two PTTS close to its early B-type primary, show relatively long rotation periods with estimated decoupling times of 10 and 20 Myr , respectively. Both, the long periods and the estimated decoupling times, suggest that the UV radiation field of the early-type primaries have not played an important role in the early dissipation of their disks. When adopting the ages provided by DM98 instead of PS99, we find a similar decoupling time interval (10-20 Myr) for the Lindroos sample. However, three stars displaying younger ages (HD 33802 B, HD 40494 B and HD 53191 B) show different properties: although they remain almost on the same rotational tracks, they lie at the end of the spin-up phase, while PS99 ages suggest that the three of them are spinning down.
All our conclusions are model-dependent, given the uncertainties in the initial rotation periods of the Lindroos sample. If we assume a longer initial rotation period (15 d) in the theoretical model, the absolute values of the star-disk decoupling times are different for the individual Lindroos PTTS. However, their rotational properties can still be explained with decoupling times between 1-20 Myr. In the case of shorter initial periods (e.g. 4.4 d), all the decoupling times are longer than 5 Myr while the stars with longer periods are not well-fitted by the model.
If we include the other two samples of PTTSs (Taurus and Lupus) in our analysis, a slightly different range of decoupling times is necessary to explain their rotational properties (0.5-10 Myr). And, finally, if we consider other samples of late-type stars at different evolutionary stages (TTS, PTTS and ZAMS stars) a broader range of decoupling times (0.5-20 Myr) is required to explain their position in the age-rotation diagram (see Figure 3).
The decoupling times are related to the lifetime of optically thick circumstellar disks. According to Figure 3, the existence of both short and long-lived disks is required to explain the different rotational properties of Lindroos, Taurus and Lupus PTTS stars. Infrared studies of young stellar clusters have shown that the mean lifetime of protoplanetary disks is 6 Myr (Haisch et al. 2001). This disk lifetime can explain the rotational properties of most of the TTSs and part of the PTTSs and ZAMS stars represented in Figure 3. However, it cannot explain the presence of slow rotators among the PTTSs and Pleiades samples.
The existence of long-lived optically thick disks has been studied by Strom (1995) who showed that 30% of 10 Myr old late-type PMS stars in the L 1641 cloud display infrared excesses. More recently, Lyo et al. (2003) have reported the presence of circumstellar disks around 60% of 10 Myr old late-type stars in the young cluster Chamaleontis. One important result from their study is that 30% of the stars with infrared excesses also show on-going accretion processes. This result supports the possibility of having decoupling times of 10 Myr among late-type PMS stars and could explain the presence of 10-100 Myr old slow rotators in the age-rotation diagram. The Lindroos stars located in this part of the diagram have already decoupled from their disks which have presumably dissipated at earlier stages in their evolution. Hence, we do not expect these PTTSs to show IR excesses at near-IR wavelengths but maybe at longer wavelengths as a result of grain growth during disk evolution (Brandner et al. 2000). In fact, some Lindroos PTTS were observed by the Infrared Space Observatory (ISO) at 6.5 and 15 m and display mid-IR excesses. This result is interpreted as evidence of remnant circumstellar matter (Moneti et al. 1998).
7 The age-activity-rotation relation in PTTSs
The connection between coronal activity and rotation in late-type PMS stars has been extensively studied in different works (e.g. Pallavicini et al. 1981, Bouvier 1990, Stauffer et al. 1994, Neuhäuser et al. 1995, Flaccomio et al. 2003). These studies have revealed that most 1 M⊙ late-type PMS stars with ages less than 10 Myr display a high level of magnetic activity. Stelzer & Neuhäuser (2001) have studied the rotation-age-activity relation for TTSs in Taurus (with ages between 105–107 yrs) in comparison to dwarf stars in the Pleiades (age 108 yrs; Meynet et al. 1993) and the Hyades (age6108 Myr; Perryman et al. 1998). They have reported a tight connection between coronal activity and rotation for all three groups.
Lindroos PTTSs are intermediate between TTSs and Pleiades, so we have studied the rotation-activity relations for our sample and compared it with other groups of younger and older late-type stars.
7.1 X-ray luminosity versus rotation period
We have started our study comparing the rotation period and the X-ray luminosity of the Lindroos PTTSs. As seen in the upper panel of Fig. 4, Lindroos PTTS show a clear anti-correlation between rotation and X-ray emission being the strongest X-ray emitters are the fastest rotators. The other two samples of PTTS contain faster rotators. They show a flatter relation with a larger spread in rotation periods for a given X-ray luminosity.
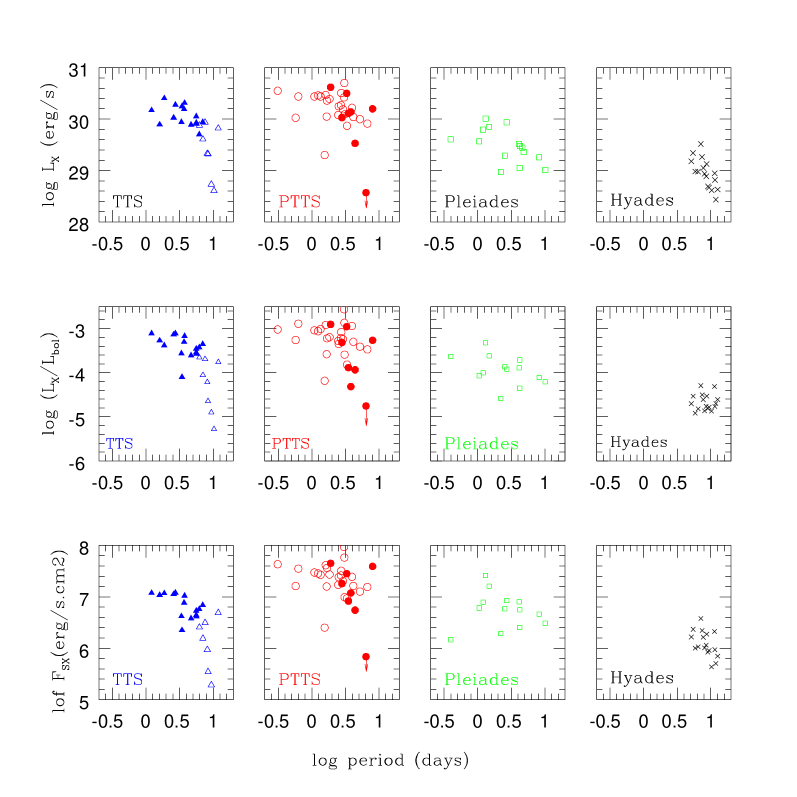
In order to analyze the evolution of the -period relation with age, we have also included in Fig. 4 three samples of late-type stars at different evolutionary stages: TTSs in Taurus, Pleiades and Hyades dwarf stars. The observational data for these three samples have been taken from Stelzer & Neuhäuser (2001) and references therein. As in the previous section, our study is focused on late-type stars with masses between 0.9–1.2.
PTTSs and TTSs show a very similar X-ray luminosity-period relation: the strongest X-ray emitters display a broad range of rotation periods (from 0.3 d-10 d) and show no correlation between X-ray luminosity and rotation period. On the other hand, the less active stars show periods longer than 4 d and display a steep relation between X-ray luminosity and rotation with the strongest X-ray emitters being the fastest rotators.
Five Lindroos PTTSs occupy the same region of the diagram as WTTSs, displaying the strongest X-ray luminosity of the whole sample. Their X-ray emission is not correlated with the rotation period. On the other hand, two Lindroos systems (HD 40494 B, HD 53191) display lower activity levels. These are the oldest stars in the sample. According to PS99, HD 40494 and HD 53191 B show ages of 80 Myr and 100 Myr respectively, so they could be considered as ZAMS stars. In that case, their position in the diagram could reflect an age effect, that is, they show lower levels of X-ray emission due to their older ages. However, if we consider DM98 tracks, these stars are significantly younger (35 Myr and 30 Myr, respectively) and an age effect is not longer able to explain their position in the diagram. In this case, they could be considered the less active PTTSs among the sample.
According to Fig. 4, the most active late-type PMS stars (erg/s) do not show a correlation between activity and rotation: for a given X-ray luminosity we found a wide range of rotation periods. On the other hand, the weakest X-ray PMS emitters erg/s) display a correlation between the X-ray luminosity and rotation period. At the age of the Pleiades, all stars display X-ray luminosities erg/s and show a connection between activity and rotation.
The comparison of PTTS with Pleiades and Hyades stars shows a connection between activity-rotation with age. ZAMS stars do not display a -period relation as steep as that found for less active late-type PMS stars. Moreover, the fastest rotators in the Pleiades exhibit lower X-ray luminosities than those from PTTSs and TTSs samples. The decrease in the magnetic activity is more evident in the Hyades, where the mean X-ray luminosity is one order of magnitude smaller than that from the other three samples.
7.2 ratio and X-ray surface flux versus rotation period
The X-ray luminosity depends, among other factors, on the stellar radius. We have taken into account this effect studying normalized activity parameters like the ratio between the X-ray and the bolometric luminosity, , and the X-ray surface flux, , of the Lindroos PTTSs. We have computed these parameters adopting the bolometric luminosities and effective temperatures listed in Gerbaldi et al. (2001).
The ratio has been derived for a large number of late-type star samples. In general, the most active stars show ratios close to the saturation value of (e.g. Fleming et al. 1989, Feigelson et al. 1993, Micela et al. 1999): late-type stars displaying that ratio have reached the highest level of X-ray activity, e.g. by coverage of the whole surface with magnetic spots. The middle panel of Fig. 4 shows the relation between the ratio and the rotation period for TTSs, PTTSs, Pleiades and Hyades stars. In the case of the Lindroos PTTSs, the relation is very steep and includes both saturated and unsaturated stars. Three of the stars display ratios close to the saturation value of –3 and short rotation periods.
The Lindroos sample display a -period relation very similar to that found in TTSs, containing the two samples very active stars with both short and long rotation periods. The most active PTTSs show a relation very similar to that of WTTSs while the less active Lindroos PTTSs occupy the same region in the diagram as CTTSs. In both groups, TTSs and PTTSs, we find stars with periods between 1–8 days and with ratios close to the saturation value of –3, indicating that during the PMS phase the saturation level is reached with different rotational properties. ZAMS and MS stars show flatter activity-rotation relations, with all of them displaying ratios lower than the saturation value of –3. In the case of the Hyades, most of the targets exhibit ratios close to the value of –4.5 and long periods.
Flaccomio et al. (2003) have shown that at ages between 1-7 Myr most of the 1 late-type PMS stars are saturated and their X-ray and rotational properties are not correlated. They report a decrease in the magnetic activity at the age of the Pleiades (100 Myr) suggesting that this decrease must take place at ages older than 10 Myr. We find a mixture of saturated and non-saturated stars among the Lindroos sample. This result suggests high activity levels at ages of 10 Myr and a decrease in coronal activity at longer ages.
Finally, we have studied the relation between the rotation period and the X-ray surface flux for PTTSs, TTSs, Pleiades and Hyades stars (lower panel in Figure 4). The X-ray surface flux is implicitly related to the fraction of stellar surface covered with active regions. As seen in Fig. 4, there is a clear variation in the steepness of the relation from the younger stars to the older ones. As in the case of the ratio, TTS and PTTS display very similar relations although the most active stars among the PTTSs sample show larger X-ray surface fluxes than the most active TTSs. These could be related to the fact that TTSs are still contracting to the MS, displaying larger surface areas than PTTSs. The latest have finished their contraction and approach the MS following the radiative part of the evolutionary tracks. The -period relation becomes flatter for stars in the Pleiades and the Hyades.
8 Conclusions
In this preliminary study, we have analyzed the rotational properties of a sample of PTTSs in Lindroos systems. We have derived their rotation periods after an optical monitoring of the targets during two campaigns of 10 nights each. We have compared the derived periods with theoretical PMS rotational tracks. Finally, we have studied the activity-rotation relation for PTTSs and compared it with samples of younger and older stars. The main results of this study can be summarized as follows:
1. The optical monitoring of the Lindroos sample has allowed us to study the rotational properties of 11 PTTSs in Lindroos systems. The analysis of the optical data revealed that most of the Lindroos PTTSs are variable. The amplitudes computed in both the B- and V-band are comparable to those measured in other samples of PTTSs candidates. Our analysis has shown that eight (out of 11) Lindroos PTTS show periodic modulations in their lightcurves. We have classified the derived periods as probable or possible depending on their confidence levels. Finally, we could not report any periodicity for these three targets: HD 38622, HD 86388 and HD 129791. This preliminary work complements previous rotational studies of PTTSs candidates in which the samples were X-ray selected and, therefore, biased towards fast rotators.
2. We have examined the rotational properties of the Lindroos sample in comparison with two other samples of PTTSs through a period-age diagram: while most of the Lindroos PTTSs have rotation periods longer than 3 days, this is not the case of the other two samples that mostly contain fast rotators. We think this is related to the different sample selection criteria. The three samples of PTTSs fill the region between 107–108 yrs, displaying a broad range of periods that range between 0.3 and 8.0 d. It is indeed at such age interval that theoretical models predict the largest dispersion of the rotational properties of late-type PMS stars, as a result of the spin-up of late-type PMS stars in their approach to the MS.
We have compared the rotation periods of Lindroos PTTS with theoretical models by Bouvier et al. (1997a). The largest scatter in rotation periods corresponds to the PTTSs phase, and it can be explained as a result of the different decoupling times between the star-disk system during the PMS phase. The rotational properties of the Lindroos PTTSs can be explained assuming different star-disk decoupling times, between 1-20 Myr, for an initial period of 8 d. If we consider other samples of PTTSs, the range of decoupling times is broader (0.5-20 Myr). This range of times is directly related to the lifetime of circumstellar disks. IR studies of young stellar clusters have shown that disks can survive up to 10 Myr. The reason why disks could dissipate at such different timescales is still an open question, although the initial star formation conditions (dust and gas content in the initial cloud) and the environment in which disks evolve (close to early-type stars) could certainly have an influence in their lifetimes.
3. We have studied the connection between magnetic activity and rotation for Lindroos PTTSs through three different activity indicators: the X-ray luminosity (), the X-ray to the bolometric luminosity ratio and the X-ray surface flux (). We have reported steep activity-rotation relations for Lindroos PTTSs. In general, the less active stars display longer rotation periods. Some of the Lindroos PTTSs are very active, displaying ratios close to the saturation value of –3. This could be the result of the spin-up phase. The fact that the Lindroos sample also contains non-saturated stars with low levels of magnetic activity could indicate that part of the sample has started to spin-down. This result is consistent with a decrease in the coronal activity at ages 10 Myr, as suggested by Flaccomio et al. (2003).
4. We have compared the activity-rotation relations of PTTSs with those displayed by different samples of younger and older late-type stars: TTSs in Taurus, Pleiades and Hyades dwarfs stars. PTTSs show rotation-activity relations very similar to those from TTSs mainly because both groups contain young and magnetically active stars. Some of the stars display ratios closer to the saturation limit. The rotation periods of these stars range between 1–8 d, that is, PMS late-type stars reach the saturation level with different rotation properties. When comparing PMS stars with ZAMS and MS stars, we see that older stars display ratios smaller than the saturation limit of –3.
Future monitoring of a larger sample of PTTS for a longer period of time will be important to confirm the conclusions derived in this preliminary study.
Acknowledgements.
We thank the referee, W. Herbst, for useful comments that improved the manuscript. We thank CTIO and La Silla staff, in special E. Cosgrove and F. Selman, for their support during the observations. NH thanks B. Stelzer and A. Scholz for useful comments on the manuscript and M. Billeres for her assistance. MF was partially supported by the Spanish grant AYA2001-1696. NH and RN did most of this work at MPE Garching, where RN was supported by the BMBF Verbundforschung ROSAT.References
- (1) Allain S., 1998, A&A 333, 629
- (2) Allain S., Bouvier, J., Prosser, C., et al., 1996, A&A, 305, 498
- (3) Attridge J.M. & Herbst W., 1992, ApJ 398, L61
- (4) Bouvier J. & Corporon P., 2001, The formation of binary systems, IAU Symp. 200, ed. H. Zinnecker and R.D. Mathieu
- (5) Bouvier, J., Forestini, M. and Allain, S., 1997a, A&A 326, 1023
- (6) Bouvier, J., Wichmann, R., Grankin et al. 1997b, A&A 318, 495
- (7) Bouvier, J., Cabrit, S., Fernández, M. et al., 1993, A&A 272, 176
- (8) Bouvier, J., 1990, AJ 99, 946
- (9) Brandner, W., Zinnecker, H., Alcalá, J. et al., 2000, AJ 120, 950
- (10) Choi, P.I. & Herbst, W., 1996, AJ 111, 283
- (11) Colllier Cameron, A., & Campbell, C.G., 1993, A&A 274, 309
- (12) D’Antona, F. & Mazzitelli, I., 1998, ApJS 90, 467, (DM98)
- (13) Duquennoy, & Mayor, M., 1991, A&A 248, 485
- (14) Dworetsky, M.M., 1983, MNRAS 203, 917
- (15) Eaton, N.L., Herbst, W. and Hillenbrand, L.A. , 1995, AJ 110, 1735
- (16) Edwards, S., 1993, Strom, S.E., Hartigan, P., et al., 1993, AJ 106, 372
- (17) Feigelson, E.D., Casanova, S., Montmerle, T. et al., 1993, ApJ 416, 623
- (18) Flaccomio, E., Micela, G. and Sciortino, S., 2003, A&A 402, 277
- (19) Fleming, T.A., Gioia, I.M. and Maccacaro, T., 1989, ApJ 340, 1011
- (20) Gerbaldi, M., Faraggiana, R. and Balin, N., 2001, A&A 379, 162
- (21) Haisch, K., Lada, E.A. and Lada, C.J., 2001, ApJL 553, 153
- (22) Herbig, G.H., 1978, Problems of Physics and evolution of the Universe, Eds. L.V. Mirzoyan, Publishing House of the Armenian Academy of Sciences, p. 171
- (23) Herbst, W., Maley, J.A. and Williams, E.C., 2001a, AJ 120, 349
- (24) Herbst, W., Bailer-Jones, C.A.L. and Mundt, R., 2001b, ApJL 554, 197
- (25) Herbst, W., Bailer-Jones, C.A.L., Mundt, R. et al., 2002, A&A 396, 513
- (26) Horne J.H. & Baliunas S.L. (1986), ApJ ,302, 757
- (27) Huélamo, N., Neuhäuser, R., Stelzer, B., Supper, R. and Zinnecker, H., 2000, A&A 359, 227
- (28) Jensen E.L.N., 2002, Young Stars Near Earth: Progress and Prospects, ed. R. Jayawardhana & T. Greene, ASP Conference Series, vol. 244, p.3
- (29) Johnstone, D., Hollenbach, D. and Bally, J., 1998, ApJ 499, 758
- (30) Königl, A., 1991, ApJ 370, L39
- (31) Lamm, M., Mundt, R., Bailer-Jones, C.A.L. et al., 2004, A&A, 417, 557
- (32) Lindroos, K.P., 1985, A&AS 60, 183
- (33) Lindroos, K.P., 1986, A&A 156, 223
- (34) Lyo, A., Lawson, W.A., Mamajek, E.E. et al., 2003, MNRAS 338, 616
- (35) Martín, E.L., Magazzù, A., Rebolo, R., 1992, A&A 257, 186
- (36) Mathieu, R.D., 1992, Binaries as tracers of stellar formation, ed. Duquennoy & Mayor, Cambridge University Press, p.155
- (37) Melo, C.H.F., Covino E., Alcalá J.M. and Torres G., 2001, A&A 378, 898
- (38) Meynet, G., Mermilliod J.C. and Maeder, 1993, A&AS 98, 447
- (39) Micela, G., Sciortino, S., Harnden, Jr.F.R. et al., 1999, A&A 341, 751
- (40) Moneti, A., Zinnecker, H., Kunkel, M. and Preisbich, T., 1998, Proc. Star formation with the Infrared Space Observatory, eds. J. L. Yun & R. Liseau
- (41) Neuhäuser, R., Sterzik, M.F., Schmitt, J.H.M.M., Wichmann, R. and Krautter, J., 1995, A&A 297, 391
- (42) Palla, F. & Stahler, S.W., 1999, ApJ 525, 772, (PS99)
- (43) Pallavicini, R., Golub, L., Rosner, R., et al., 1981, ApJ 248, 279
- (44) Pallavicini, R., Pasquini, L. and Randich, S., 1992, A&A 261, 245
- (45) Pan, K., Tan, H. and Shan, H., 1998, A&A 335, 179
- (46) Perryman, M.A.G., Brown, A.G.A., Lebreton, Y. et al., 1998, A&A 331, 81
- (47) Prosser, C.F., Shetrone, M.D., Dasgupta, A., et al., 1995, PASP 107, 211
- (48) Queloz, D., Allain, S., Mermilliod, J.C., et al., 1998, A&A, 335, 183
- (49) Radick, R.R., Thompson, D.T., Lockwood, G.W., et al., 1987, ApJ, 321, 459
- (50) Rebull, L.M., 2001, AJ 121, 1676
- (51) Rebull, L.M., Wolff, S.C., Strom, S.E. and Makidon, R.B., 2002, AJ 124, 546
- (52) Scargle, J. D., 1982, ApJ 263, 835
- (53) Scholz A. & Eislöffel J., 2004, A&A, 421, 259
- (54) Shu, F., Najita, J. Ostriker, E., et al., 1994, ApJ 429, 781
- (55) Siess, L., Dufour, E. & Forestini, M., 2000, A&A 358, 593
- (56) Soderblom, D.R., Stauffer J.R., MacGregor, K.B, and Jones B.F., 1993, ApJ 409, 624
- (57) Stassun, K., Mathieu, R.D., Mazeh, T. and Vrba, F.J., 1999, AJ 117, 2941
- (58) Stauffer, J.R., Balachandran, S.C., Krishnamurthi, A. et al., 1997, ApJ 475, 604
- (59) Stauffer, J.R., Caillault, J.P., Gagné, M. et al., 1994, 1994, ApJS 91, 625
- (60) Stauffer, J.R, Hartmann, L., Jones, B.F., 1989, ApJ 346, 160
- (61) Stelzer, B. and Neuhäuser, R., 2001, A&A 377, 538
- (62) Störzer, H. & Hollenbach D., 1999, ApJ 515, 669
- (63) Strom, S., 1995, RMxAC 1, 317
- (64) Terndrup, D., Stauffer, J.R., Pinsonneault, M.H. et al., 2000, AJ 119, 1303
- (65) Tout, C.A., Livio, M. & Bonnell, I. A., 1999, MNRAS 310, 360
- (66) Webb, R.A, Zuckermann, B., Platais, I. et al., 1999, ApJ 512, L63
- (67) Wichmann, R., Bouvier, J., Allain, S. et al., 1998 A&A 350, 521
- (68) Zahn J.P., 1977, A&A 57, 383