PROBING COLLIDING WIND BINARIES WITH HIGH-RESOLUTION X-RAY SPECTRA
Abstract
X-ray line profiles represent a new way of studying the winds of massive stars. In particular, they enable us to probe in detail the wind-wind collision in colliding wind binaries, providing new insights into the structure and dynamics of the X-ray-emitting regions. We present the key results of new analyses of high-resolution Chandra X-ray spectra of two important colliding wind systems, Velorum and WR140. The lines of Vel are essentially unshifted from their rest wavelengths, which we suggest is evidence of a wide shock opening angle, indicative of sudden radiative braking. The widths of the lines of WR140 are correlated with ionization potential, implying non-equilibrium ionization. The implications of these results for the radio emission from these systems are discussed, as are some of the future directions for X-ray line profile modelling of colliding wind binaries.
1 Introduction
Massive, early-type stars () have profound effects on their environments through their intense UV radiation fields, their powerful stellar winds (–, ) and their violent deaths as supernovae. The winds from massive stars provide 30% of the mechanical energy input into the interstellar medium (Abbott, 1982), and the mass-loss also substantially affects the stars’ own evolution (Chiosi & Maeder, 1986). Thus, understanding mass-loss from massive stars is essential for understanding feedback to the ISM, stellar evolution and galactic evolution.
Most massive stars reside (or resided) in binaries or multiple systems (Zinnecker, 2003). In such systems, the winds of the massive stars collide highly supersonically (Mach number 100), and they are compressed and shock-heated to K. The shock-heated gas produces copious X-rays (e.g. Stevens, Blondin, & Pollock, 1992), though there are observational signatures throughout the electromagnetic spectrum, including non-thermal radio emission from relativistic electrons accelerated at the shocks (e.g. Eichler & Usov, 1993; Dougherty & Williams, 2000).
Previously, studies of X-rays from colliding wind binaries (CWBs) have tended to focus on their broad-band spectral properties, due to the poor spectral resolution of the satellites then in operation (e.g. for the ASCA SIS). Nevertheless, by comparing the variable ASCA spectrum of Velorum with hydrodynamical models of the system, Stevens et al. (1996) were able place constraints on the stars’ mass-loss rates and wind velocities. This technique has more recently been applied to the high-resolution Chandra grating spectrum of Carinae (Pittard & Corcoran, 2002).

The unprecedented spectral resolution offered by the gratings on board Chandra and XMM-Newton enables us to resolve line shifts and widths down to a few hundred km s-1, providing a unique probe of the dynamics of the wind-wind colllision. Furthermore, the X-ray forbidden-intercombination-resonance (fir) triplets from He-like ions provide diagnostics of the density and temperature of the X-ray-emitting plasma, as well as potentially providing diagnostics of the UV radiation field (e.g. Paerels & Kahn, 2003). Using these tools we can obtain new insights into the location, geometry, structure and dynamics of the wind-wind collision region.
2 Velorum
We have carried out a new analysis of an archived 65-ks Chandra High-Energy Transmission Grating Spectrometer (HETGS) observation of the well-studied WR+O binary Velorum (Skinner et al., 2001; Henley et al., in prep.). Vel is a double-lined spectroscopic binary of spectral type WC8 + O7.5 (de Marco & Schmutz, 1999) whose orbit is well determined, with a period of days, , (Schmutz et al., 1997) and (de Marco & Schmutz, 1999).
The first order Medium Energy Grating (MEG) spectrum of Vel is shown in Fig. 1. The spectrum is dominated by strong emission lines from S (–5 Å), Si (–7 Å) and Mg (–9 Å), with weaker lines from Ne (–14 Å) and Fe (e.g. Å and Å).
We have measured the line centroid shifts and the line widths by fitting Gaussian line profiles (plus a constant continuum) to a narrow wavelength region around the particular line of interest. Although colliding wind binaries are expected to exhibit a wide range of line profile shapes (Henley, Stevens, & Pittard, 2003), Gaussians give good fits to the emission lines in Vel and thus provide a good way of quantifying the line shifts and widths.
The measured line shifts and widths are plotted against wavelength in Fig. 2. The lines are generally unshifted from their lab wavelengths. The mean shift is and the mean FWHM is . Neither the line shift nor width is correlated with wavelength or ionization potential.
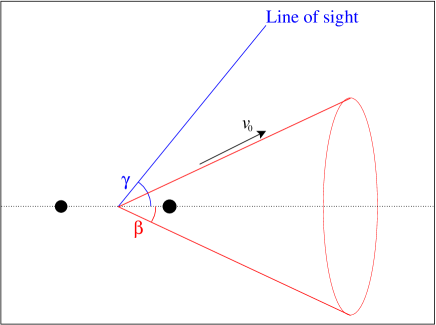
In order to understand our measured shifts and widths in terms of the geometry of the wind-wind collision, we use a simple model in which the wind-wind interaction region is a conical surface (Lührs, 1997) with opening half-angle . The X-ray-emitting gas streams along this cone away from the line of centres at speed (see Fig. 3). Assuming the material is distributed symmetrically around the shock cone, the line centroid shift () and width are given by (Pollock et al., 2004)
| (1) |
| (2) |
The angle can be calculated from the orbit (Schmutz et al., 1997; de Marco & Schmutz, 1999); at the time of the Chandra observation. By eliminating from the above equations, and using our measured shifts and widths (, ) we find that . Note, however, that the mean observed line shift is comparable to the absolute wavelength accuracy of the HETGS (100 km s-1; Chandra Proposers’ Observatory Guide). This means that the measured value of (and hence the derived value of ) may not be completely trustworthy. However, we can say that (since we would unambiguously be able to detect a larger value of ). This implies that .
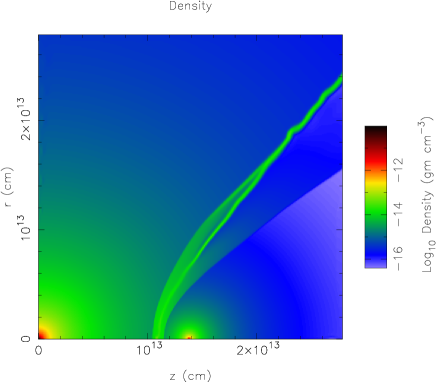
To understand this value in terms of the dynamics of the system, we have carried out a hydrodynamical simulation of the wind-wind collision. For simplicity we have assumed non-accelerating, spherically symmetric winds. Since there is evidence that the O star wind collides below its terminal velocity (e.g. St-Louis, Willis, & Stevens, 1993), we have adopted an O star wind speed of 1500 km s-1 (cf. –2400 km s-1; Prinja, Barlow, & Howarth, 1990; St-Louis et al., 1993). We assume the WR star collides at its terminal velocity (1500 km s-1; Barlow, Roche, & Aitken, 1988). We adopt mass-loss rates of and . Figure 4 shows a density map from the resulting simulation.
We have used this simulation to model the X-ray line emission from Vel using the model described in Henley et al. (2003), which calculates X-ray emission line profiles from the hydrodynamical simulation results assuming collisional ionization equilibrium. The resulting profiles are typically blueshifted by 300 km s-1, in contrast to the essentially unshifted lines in the observed spectrum.
The discrepancy between the observed and calculated line shifts is most likely due to the shock opening half-angle in the hydrodynamical simulation being 40∘, whereas the simple geometrical model described above implies a shock opening half-angle of 85∘. In a CWB with non-accelerating winds, is a function only of the wind momentum ratio (). As this ratio increases, decreases, because the more powerful wind of the WR star overwhelms that of the O star. The shock opening angle in our hydrodynamical simulation therefore depends on the adopted values of the wind parameters. However, the shock opening half-angle inferred from the simple geometrical model () implies approximately equal wind momenta, which is not the case for any sensible set of (constant velocity) wind parameters. We therefore suggest that this large implied opening angle may be evidence of sudden radiative braking (Owocki & Gayley, 1995; Gayley, Owocki, & Cranmer, 1997), in which the wind of the WR star is rapidly decelerated when it encounters the radiation field of the O star. This rapid deceleration leads to an increase in the shock opening angle (the larger the opacity of the WR star wind to the O star radiation field, the larger the shock opening angle; see Fig. 3 in Gayley et al., 1997). It also alters the Mach number of the wind-wind collision, resulting in softer X-ray emission than would otherwise be expected. However, as well as affecting the X-ray emission, radiative braking may also affect the non-thermal radio emission. This is because the orbital variability of the non-thermal radio emission (due to free-free absorption in the stars’ unshocked winds) is dependent on the shock opening angle.

Chapman et al. (1999) analysed ATCA radio observations of Vel at four wavelengths using a thermalnon-thermal emission model. The thermal free-free emission is from the unshocked stellar winds, while the non-thermal synchrotron emission is from the wind-wind collision and is attenuated by free-free absorption in the unshocked winds. Chapman et al. (1999) found that over the range 2–4 GHz, thermal and non-thermal emission make approximately equal contributions to the observed flux. However, their observations were made at two different orbital phases, and so their assumptions of constant non-thermal spectral index and constant optical depth for the non-thermal emission may not be valid.
Radio observations with better orbital coverage (S. Dougherty, priv. comm.) show no evidence of non-thermal emission from Vel. This is presumably because Vel is a relatively close binary, and so the non-thermal emission from the wind-wind collision is strongly absorbed by the unshocked stellar winds. Also, the population of shock accelerated relativistic electrons will be quickly reduced by efficient inverse Compton cooling. Thus, it may unfortunately be the case that the effects of radiative braking on the non-thermal radio emission discussed above will be very difficult to observe, because radiative braking is favoured in close systems (Gayley et al., 1997) in which any non-thermal radio emission from the wind-wind collision will be strongly attenuated by the unshocked winds.
3 WR140
The eccentric WC7 + O4.5 binary WR140 ( days, ; Williams et al., 1990) is another key system in our understanding of CWBs. Compared with Vel, WR140 is hotter and about two orders of magnitude more luminous. ROSAT and ASCA observations (Corcoran, 1996), and more recently RXTE observations (Pollock et al., 2004) show a gradual rise in X-ray flux from apastron to periastron, followed by a rapid drop in flux at around the time of periastron passage. The flux variations agree qualitatively with the theoretical predictions of Stevens et al. (1992) – the increase in flux prior to periastron is due to an increase in the density of the X-ray-emitting gas as the stars approach each other, whereas the subsequent sudden drop in flux is due to increased absorption as the line of sight moves from the O star wind into the denser WR star wind.
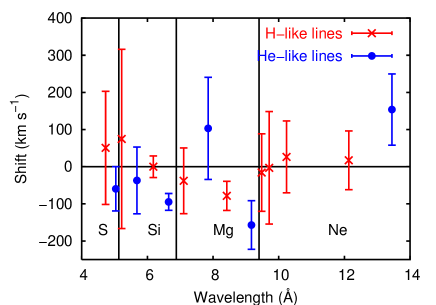
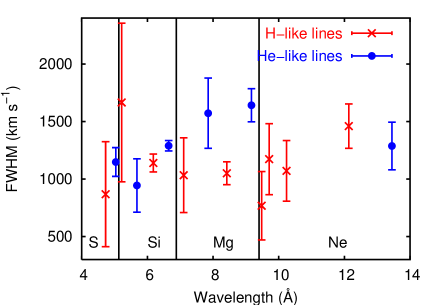
Figure 5 shows the first-order MEG spectrum from a 45-ks Chandra-HETGS observation of WR140 obtained a few weeks before its most recent periastron passage (Pollock et al., 2004). As for Vel, line shifts and widths were measured by fitting Gaussians to individual emission lines. The measured shifts and widths are shown in Fig. 6, plotted against ionization potential. The lines are systematically blue-shifted by 600 km s-1, and the line widths are correlated with ionization potential.
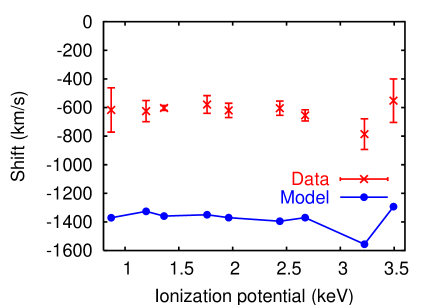
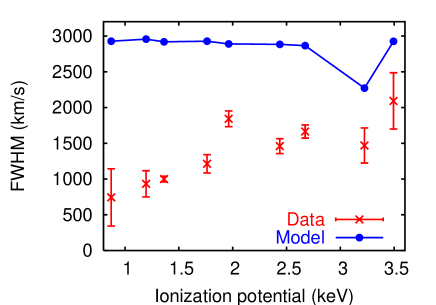
As for Vel, we have attempted to model the X-ray line emission from WR140 using the model of Henley et al. (2003), again assuming spherically symmetric winds and collisional ionization equilibrium. The wind parameters used are from Stevens et al. (1992). Radiative braking is not an issue in WR140, as it is a much wider binary than Vel [at the times of their respective Chandra observations, the stellar separations were 0.9 A.U. ( Vel) and 4.2 A.U. (WR140)]. The calculated line shifts and widths are compared with the observed values in Fig. 6. As can be seen, there is poor agreement between the predictions of the model and the observed shifts and widths. Firstly, the observed shifts are smaller than expected. This implies that the velocity along the shock cone is lower than expected. Indeed, the highest velocity observed in the resolved lines (2000 km s-1) is significantly lower than the velocities of the unshocked winds (3000 km s-1; Pollock et al., 2004). This may mean that some of the energy budget is going into the production of relativistic particles. Secondly, the correlation between the line widths and ionization potential is not reproduced by the model. This may be indicative of non-equilibrium ionization, as it implies that higher excitation lines (e.g. S XVI) originate further from the line of centres where the velocity is larger. This is contrary to what is expected if collisional ionization equilibrium holds, because the temperature of the shocked gas in the wind-wind collision decreases monotonically away from the line of centres (hence lines from more highly ionized species would be expected to originate nearer the line of centres).
Over the course of eight years at the VLA, White & Becker (1995) obtained a detailed radio light curve of WR140. The observed flux is non-thermal, and is highly variable at all three wavelengths observed (2, 6 and 20 cm). The radio emission peaks before periastron passage, at an orbital phase of –0.8 (where corresponds to periastron). The 2 cm emission peaks earliest, and is already on the decline while the 20 cm emission is still rising.
White & Becker (1995) were unable to explain the variation in the radio flux (which they attributed to both a varying intrinsic luminosity and a varying optical depth) with spherically symmetric winds. Instead they proposed a model in which the wind of the WR star is disk-like. The shifts and widths of the X-ray emission lines from WR140 are also not well described by our current model with spherically symmetric winds, as discussed above. This may lead one to speculate whether or not they can also be explained by a disk-like wind model. However, White & Becker (1995) essentially assume the non-thermal source is point-like, whereas theoretical modelling of the radio emission from wind-wind collisions shows that it is important to consider extended emission regions (Dougherty et al., 2003). Therefore, it may be possible to explain WR140’s radio lightcurve with spherically symmetric winds, without having to invoke a disk-like wind model. Furthermore, the variation in the observed X-ray flux is in good qualitative agreement with the predictions of a spherically symmetric colliding wind model (Corcoran, 1996; Pollock et al., 1999). It seems that more detailed modelling of the X-ray emission lines and the radio emission, and more spectral information from the radio are required to resolve the issue of the nature of WR140’s winds. (See also Pittard et al., these proceedings.)
4 Conclusions
High-resolution X-ray spectra allow us to probe the structure and dynamics of the wind-wind collision in CWBs. In the two key systems described here, the X-ray spectra have revealed evidence of a variety of interesting phenomena, such as sudden radiative braking and non-equilibrium ionization. From a radio point-of-view, the former is of particular interest, as radiative braking increases the shock opening angle, which in turn influences the variability of the non-thermal emission.
Future modelling of the X-ray emission lines needs to take into account the effects of the stars’ radiation fields and the acceleration of relativistic particles on the hydrodynamics, as well as calculating the ionization balance self consistently (rather than assuming collisional ionization equilibrium). Furthermore, while line emission is generally considered a thermal process, ions may equally well be excited by collisions with non-thermal electrons. If the relative abundance of non-thermal electrons is large (the energy density of relativistic electrons in CWBs may be as large as 1% of the thermal energy density; see Dougherty et al., 2003) these too will have to be included in the models.
Acknowledgments
DBH gratefully acknowledges funding from the School of Physics & Astronomy at the University of Birmingham.
References
- Abbott (1982) Abbott, D. C. 1982, ApJ, 263, 723
- Barlow et al. (1988) Barlow, M. J., Roche, P. F., & Aitken, D. K. 1988, MNRAS, 232, 821
- Chapman et al. (1999) Chapman, J. M., Leitherer, C., Koribalski, B., Bouter, R., & Storey, M. 1999, ApJ, 518, 890
- Chiosi & Maeder (1986) Chiosi, C., & Maeder, A. 1986, ARA&A, 24, 329
- Corcoran (1996) Corcoran, M. F. 1996, Rev. Mex. Astron. Astrofis. Ser. Conf., 5, 54
- de Marco & Schmutz (1999) de Marco, O., & Schmutz, W. 1999, A&A, 345, 163
- Dougherty et al. (2003) Dougherty, S. M., Pittard, J. M., Kasian, L., F., C. R., Williams, P. M., & Lloyd, H. M. 2003, A&A, 409, 217
- Dougherty & Williams (2000) Dougherty, S. M., & Williams, P. M. 2000, MNRAS, 319, 1005
- Eichler & Usov (1993) Eichler, D., & Usov, V. 1993, ApJ, 402, 271
- Gayley et al. (1997) Gayley, K. G., Owocki, S. P., & Cranmer, S. R. 1997, ApJ, 475, 786
- Henley et al. (2003) Henley, D. B., Stevens, I. R., & Pittard, J. M. 2003, MNRAS, 346, 773
- Lührs (1997) Lührs, S. 1997, PASP, 109, 504
- Owocki & Gayley (1995) Owocki, S. P., & Gayley, K. G. 1995, ApJ, 454, L145
- Paerels & Kahn (2003) Paerels, F. B. S., & Kahn, S. M. 2003, ARA&A, 41, 291
- Pittard & Corcoran (2002) Pittard, J. M., & Corcoran, M. F. 2002, A&A, 383, 636
- Pollock et al. (1999) Pollock, A. M. T., Corcoran, M. F., Stevens, I. R., & The Xmega Group. 1999, in Proc. IAU Symp. 193: Wolf-Rayet Phenomena in Massive Stars and Starburst Galaxies, ed. K. A. van der Hucht, G. Koenigsberger, & P. R. J. Eenens, 388
- Pollock et al. (2004) Pollock, A. M. T., Corcoran, M. F., Stevens, I. R., & Williams, P. M. 2004, ApJ, submitted
- Prinja et al. (1990) Prinja, R. K., Barlow, M. J., & Howarth, I. D. 1990, ApJ, 361, 607
- Schmutz et al. (1997) Schmutz, W. et al. 1997, A&A, 328, 219
- Skinner et al. (2001) Skinner, S. L., Güdel, M., Schmutz, W., & Stevens, I. R. 2001, ApJ, 558, L113
- St-Louis et al. (1993) St-Louis, N., Willis, A. J., & Stevens, I. R. 1993, ApJ, 415, 298
- Stevens et al. (1992) Stevens, I. R., Blondin, J. M., & Pollock, A. M. T. 1992, ApJ, 386, 265
- Stevens et al. (1996) Stevens, I. R. et al. 1996, MNRAS, 283, 589
- White & Becker (1995) White, R. L., & Becker, R. H. 1995, ApJ, 451, 352
- Williams et al. (1990) Williams, P. M., van der Hucht, K. A., Pollock, A. M. T., Florkowski, D. R., van der Woerd, H., & Wamsteker, W. M. 1990, MNRAS, 243, 662
- Zinnecker (2003) Zinnecker, H. 2003, in Proc. IAU Symp. 212, A Massive Star Odyssey: From Main Sequence to Supernova, ed. K. A. van der Hucht, A. Herrero, & C. Esteban, 80