eurm10 \checkfontmsam10 \pagerange1–8
Observations of convection in A-type stars
Abstract
Convection and turbulence in stellar atmospheres have a significant effect on the emergent flux from A-type stars. The recent theoretical advancements in convection modelling have proved a challenge to the observers to obtain measurements with sufficient precision and accuracy to allow discrimination between the various predictions.
A discussion of the current observational techniques used to evaluate the various convection theories is presented. These include filter photometry, spectrophotometry, hydrogen lines, and metal lines. The results from these techniques are given, along with the successes and limitations.
1 Introduction
The gross properties of a star, such as broad-band colours and flux distributions, are significantly affected by the effects of convection in stars later than mid A-type. Consequently, our modelling of convection in stellar atmosphere models can significantly alter our interpretation of observed phenomena.
Convection in stellar atmospheres is usually based on mixing-length theory (MLT) of Böhm-Vitense ([1958]). In their discussion of the Kurucz ([1979]) atlas6 models Relyea & Kurucz ([1978]) found discrepancies between theoretical and observed colours which might be the result of inappropriate treatment of convection within the models. Subsequently, several attempts have been undertaken to improve the situation. Lester et al. ([1982]), for example, introduced “horizontally averaged opacity” and a “variable mixing length” which improved the match with observed colours, but did not remove all the discrepancies. The atlas9 models introduced an “approximate overshooting” which has not been without its critics (see Castelli et al. [1997] for details).
Canuto & Mazzitelli ([1991, 1992]) proposed a turbulent model of convection in order to overcome one of the most basic short-comings of MLT, namely that a single convective element (or “bubble” or “eddy”) responsible for the transport of all the energy due to convection. This new model accounts for eddies of various sizes that interact with each other. The CM convection model was implemented in the atlas9 code by Kupka ([1996]).
Theoretical studies of convection in A-type stars have suggested that convection is inefficient (Freytag et al. [1996]), thus has only a very small influence on atmospheric structure (Heiter et al. [2002]). However, these effects are nonetheless still important and in need of observational confirmation. For the early A-type stars (hotter than 8500 K) convective flux is negligible. It is only from mid A-type and later when convection becomes important, as an extensive convection zone develops in the photosphere and below (e.g. Weiss & Kupka [1999]).
Convection in A-type stars poses a challenge to both theorists and observers. In this review I will concentrate on the observational effects of convection and what can be deduced from various types of observations.
2 Colours
Photometric indices are a fast and efficient method for determining approximate atmospheric parameters of stars. For the commonly-used Strömgren system a vast body of observational data exists (e.g. Hauck & Mermilliod [1998]) which can be used to estimate parameters using calibrated model grids (e.g. Moon & Dworetsky [1985], Lester et al. [1986], Smalley & Dworetsky [1995]). Conversely, knowing atmospheric parameters from other methods, allows observed colours to be compared to model predictions. This method has been used to compare various treatments of stellar convection.
Smalley & Kupka ([1997]) compared the predicted colours for the CM model with that from the standard Kurucz ([1993]) MLT models with and without “approximate overshooting”. Comparison against fundamental Teff and stars revealed that the CM models gave better agreement than MLT without overshooting. Models with overshooting were clearly discrepant. This result was further supported by stars with Teff obtained from the Infrared Flux Method (IRFM) and from stellar evolutionary models. However, some discrepancies still remained, including a “bump” around 6500 K in the obtained for the Hyades and continued problems with the Strömgen index. Similar conclusions were found by Schmidt ([1999]) using Geneva photometry.
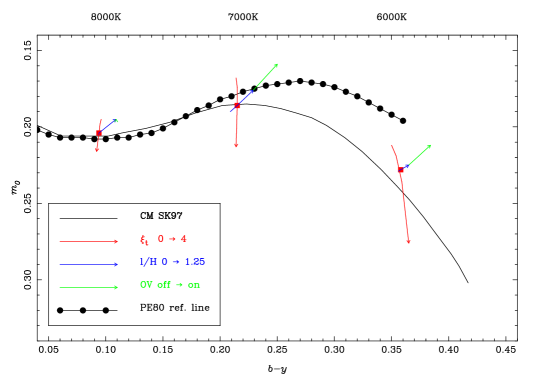
The index is sensitive to metallicity and microturbulence, but also convection efficiency as discussed by Relyea & Kurucz ([1978]) and Smalley & Kupka ([1997] Fig. 6). Inefficient convection (CM and MLT 0.5) clearly works in the domain of the A stars down to 0.20 (approx 7000 K, F0). For cooler stars, convection becomes more efficient and substantive within the atmosphere and higher values of mixing-length and lower microturbulent velocities would be required to fit the observed indices of the main sequence (see Fig. 1). The 2d numerical radiation hydrodynamics calculations of Ludwig et al. ([1999]) are useful in this regard. They indicate a rise in mixing-length from 1.3 at 7000 K to = 1.6 for the Sun (5777 K), while a much lower 0.5 was found for models at 8000 K (Freytag [1995]). This is in agreement with that implied by index. However, around 6000 K there still remains a significant discrepancy, which could only be reduced by invoking the approximate overshooting option (Fig. 1). Thus, none of the convection models used in classical model atmospheres allows for the reproduction of the index, unless two parameters, i.e. and the amount of “approximate overshooting”, are varied over the H-R Diagram.
3 Fluxes
The observed stellar flux distribution is influenced by the effects of convection on the atmospheric structure of the star. As we have seen with photometric colours, these effects have a clearly observable signature. Hence, high precision stellar flux measurements will provide significant and useful information on convection.
Lester et al. ([1982]) presented a study of convective model stellar atmospheres using a modified mixing-length theory. They found small, systematic differences in the optical fluxes. Their figures demonstrate that convection can have a measurable effect on stellar fluxes.
Figure 2 shows the effects of changing mixing length from 0, through 0.5 to 1.25 on the emergent flux for solar-composition models with 8000 K and 7000 K ( = 4.0 and = 2 kms). At 8000 K both the CM and MLT = 0.5 models give essentially the same fluxes as zero convection. At 7000 K, however, the differences are more noticeable, with the effect of overshooting being considerable.

In the ultraviolet the effects are even more significant, but comparison with observations would be complicated by the significant amount of metal line blanketing in this region. In contrast, in the infrared the effects are generally less compared to the optical. Hence, a combination of optical and infrared fluxes should provide a good basis for fixing the effective temperature of the star as well as testing the convective nature of the stellar atmosphere. In fact, the IRFM (Blackwell & Shallis [1977], Blackwell & Lynas-Gray [1994]) is a very useful method for determining nearly model-independent Teff for stars and has proved invaluable in our quest for accurate atmospheric parameters.
Unfortunately, very little high-precision stellar spectrophotometry exists. This situation will be rectified, once the ASTRA Spectrophotometer (Adelman et al., [2003]) begins operation. This will allow spectrophotometry to be added to our observational diagnostic toolkit.
4 Balmer Profiles
The temperature sensitivity of Balmer lines makes them an excellent diagnostic tool for late A-type stars and cooler (Gardiner [2000]). However, as emphasised by van’t Veer & Mégessier ([1996]), the and profiles behave differently due to convection: is significantly less sensitive to mixing-length than . Both profiles are affected by the presence of overshooting, with being more influenced than (see Fig. 3). Since is formed higher in the atmosphere than , Balmer lines profiles are a very good depth probe of stellar atmospheres. Naturally, Balmer profiles are also affected by microturbulence, metallicity and, for the hotter stars, surface gravity (Heiter et al. [2002]).

In their comparison of Balmer line profiles, Gardiner et al. ([1999]) found that both CM and MLT without overshooting gave satisfactory agreement with fundamental stars. Overshooting was again found to be discrepant. Intriguingly, they found that while = 0.5 was generally preferred, the region between 6000 K and 7000 K required a higher value ( 1.25). This corresponds to the “bump” region found for Hyades stars using . However, this is not supported by either Fuhrmann et al. ([1993]) or van’t Veer & Mégessier ([1996]).
Gardiner et al. ([1999]) also found evidence for significant disagreement between all treatments of convection for stars with around 8000 9000 K. Smalley et al. ([2002]) reviewed this region using binary systems with known values and their revised fundamental values of the component stars. They found that the discrepancy found by Gardiner et al. ([1999]) was no longer as evident. However, this region was relatively devoid of stars with fundamental values of both and . Further fundamental stars are clearly required in this region.
One potential difficulty with Balmer profiles is there great width, which can pose problems during the extraction and rectification of observations. Locating the ‘true’ continuum is non-trivial and a small error can lead to significant errors in any temperature obtained from fitting the profile (Smith & van’t Veer [1988]).
5 Microturbulence
Microturbulence (long used as a free parameter in abundance analyses) does appear to vary with effective temperature. Chaffee ([1970]) found that microturbulent velocity () rose from 2 km s-1 for early A-type stars up to 4 km s-1 for late A-type stars, and then back to 2 km s-1 for mid F-type stars and back up to 4 km s-1 for solar-type stars. He also found that microturbulence correlated weakly with the Strömgren index. Recently, Gray ([2001]) found that varied from around 3 km s-1 for mid-A type down to around 1 km s-1 for solar-type stars, confirming the results of Coupry & Burkhart ([1992]) who found a variation from around 0 km s-1 for late B-type, up to around 3 km s-1 for mid A-type type, down to around 2 km s-1 for early F-type. Nissen ([1981]) gave a regression fit to both Teff and for near-main-sequence solar-composition stars, from 2 km s-1 for F-type down to 1.5 km s-1 for solar-type stars. Fig. 4 shows the variation of with Teff for near main-sequence stars ( 4.0) based on the results given by Gray ([2001]).

Velocity fields are present in stellar atmospheres which can be measured using line bisectors (Dravins [1987], Gray [1992]). Compared to solar-type stars, the line bisectors are reversed, indicating small rising columns of hot gas and larger cooler downdrafts in A-type stars (Landstreet [1998]). It is these motions that are thought to be responsible, at least in part, for the existence of microturbulence. In fact, 3d numerical simulations of solar granulation can account for observed line profiles without the need for any microturbulence (Asplund et al. [2000]). Similar results have been found for Procyon (Gray [1985], Allende Prieto [2002]), which is also a star with well-known physical parameters (e.g. Kervella et al. [2004]). Unfortunately, current numerical simulations for A-stars predict bisectors in the opposite direction to that observed (Freytag [2004]).
6 Böhm-Vitense Gap
Böhm-Vitense ([1970]) found a scarcity of stars around 7000 K which were attributed to the abrupt onset of convection. Observationally, as discussed above, this region corresponds to the “bump” which is a mis-match between the from evolutionary models and model atmosphere calculations, an apparent change in behaviour of microturbulence around 6600K, and the suggestions that Balmer profiles require a higher value for mixing-length than other regions. In addition, there is a dip in chromospheric activity in this region (Böhm-Vitense, [1995]). D’Antona et al. ([2002]) discussed the Böhm-Vitense gaps and the role of turbulent convection, concluding that a gap in the region just below Teff of 7000 K is a Teff rather than just a colour gap. This is an interesting area of the H-R Diagram where the convective core shrinks to become radiative, while envelope and atmosphere change from radiative to convective (de Bruijne et al., [2001]). Chromospheric activity indicators are another useful diagnostic, with another transition regime around 8300 K (Simon et al. [2002]). All in all, this in an observationally challenging region of the H-R Diagram, since there are both atmospheric and internal effects which we need to differentiate between.
7 Conclusions
Fig. 5 summarizes the typical results of the various observational tests. While there are some contradictions and anomalies the figures does illustrate the current state of our observational understanding of stellar convection. For stars hotter than A0 there is no convection or significant microturbulence. For the early A-type stars there is essentially no convection within the atmosphere, since the temperature gradient is radiative, but there are velocity fields as indicated by the modest microturbulence values. Velocity fields increase as we go through mid to late A-type stars, and inefficient convection is required within the atmosphere. Once convection becomes efficient (F-type and later) the value of microturbulence is found to drop, while the mixing-length is required to increase (although some evidence points against this, such as the Balmer-line results discussed earlier).
| No convection | Weak convection | Strong convection | ||||
| (sub-surface) | (surface) | |||||
| 2km s-1 | 2-4 km s-1 | 1-2 km s-1 | ||||
| A0V | A5V | F0V | ||||
| 10 000 K | 8500 K | 7000 K | ||||
Overshooting is still an issue to be resolved, since there are clearly velocity fields above the convection zone. While the “approximate overshooting” of Kurucz appears to have been discounted by observational tests, there is clearly the need for some sort of overshooting to be incorporated within model atmosphere calculations.
The effects of convection on the stellar atmospheric structure can be successfully probed using a variety of observational diagnostics. The combination of photometric colours and Balmer-line profiles has given us a valuable insight into the nature of convection in A-type stars. High quality observations that are currently available and those that will be in the near future, will enable further refinements in our theoretical models of convection and turbulence in stellar atmospheres.
Acknowledgements.
The author gratefully acknowledges the support of PPARC, the Royal Society and the IAU. This research has made use of model atmospheres calculated with atlas9 at the Department of Astronomy of the University of Vienna, Austria, available from http://ams.astro.univie.ac.at/nemo/.References
- [2003] Adelman S.J., Gulliver A.F., Smalley B., Pazder J.S., Younger P.F., Boyd L. & Epand D., 2003 In: Adelman S.J., Kupka F., Weiss W.W. (eds.) Model Atmospheres and Spectrum Synthesis. A.S.P. Conf. Proc. 44, Poster E55.
- [2002] Allende Prieto C., Asplund M., López, R.J.G., Lambert D.L., 2002, ApJ 567, 544
- [2000] Asplund M., Nordlund Å., Trampedach R., Allende Prieto C., Stein R.F., 2000, A&A 359, 729
- [1994] Blackwell D.E., Lynas-Gray A.E., 1994, A&A 282, 899
- [1977] Blackwell D.E., Shallis M.J., 1977, MNRAS 180, 177
- [1958] Böhm-Vitense E., 1958, ZA 46, 108
- [1970] Böhm-Vitense E., 1970, A&A 8, 283
- [1995] Böhm-Vitense E., 1995, A&A 297, L25
- [1991] Canuto V.M., Mazzitelli I., 1991, ApJ 370, 295
- [1992] Canuto V.M., Mazzitelli I., 1992, ApJ 389, 724
- [1996] Canuto V.M., Goldman I., Mazzitelli I., 1996, ApJ 473, 550
- [1997] Castelli F., Gratton R.G., Kurucz R.L., 1997, A&A 318, 841
- [1970] Chaffee F.H., 1970, A&A 4, 291
- [1992] Coupry M.F., Burkhart C., 1992, A&AS 95, 41
- [2002] D’Antona F., Montalbán J., Kupka F., Heiter U., 2002, ApJ 564, L93
- [2001] de Bruijne J.H.J., Hoogerwerf R., de Zeeuw P.T., 2001, A&A 367, 111
- [1987] Dravins D., 1987, A&A 172, 200
- [1995] Freytag B., 1995, Ph.D. Thesis, Universität Kiel
- [2004] Freytag B., these proceedings
- [1996] Freytag B., Ludwig H.-G., Steffen M., 1996, A&A 313, 497
- [1993] Fuhrmann K., Axer M., Gehren T., 1993, A&A 271, 451
- [2000] Gardiner R.B., 2000, Ph.D. Thesis, University of Keele
- [1999] Gardiner R.B., Kupka F., Smalley B., 1999, A&A 347, 876
- [1985] Gray D.F., 1985, ApJ 255, 200
- [1992] Gray D.F., 1992, The observation and analysis of stellar photospheres, (2nd ed.), Cambridge University Press
- [2001] Gray R.O., Graham P.W., Hoyt S.R., 2001, AJ 121, 2159
- [1998] Hauck B., Mermilliod M., 1998, A&AS 129, 431
- [2002] Heiter U., Kupka F., van’t Veer-Menneret C., Barban C., Weiss W.W., Goupil M.-J., Schmidt W., Katz D., Garrido R., 2002, A&A 392, 619
- [2004] Kervella P., Thévenin F., Morel P., Berthomieu G., Bordé P., Provost J., 2004, A&A 413, 251
- [1996] Kupka F., 1996. In: Adelman S.J., Kupka F., Weiss W.W. (eds.) Model Atmospheres and Spectrum Synthesis. A.S.P. Conf. Proc. 44, p. 356
- [1979] Kurucz R.L., 1979, ApJS 40, 1
- [1993] Kurucz R.L., 1993, Kurucz CD-ROM 13: ATLAS9, SAO, Cambridge, USA
- [1998] Landstreet J.D., 1998, A&A 338, 1041
- [1986] Lester J.B., Gray R.O., Kurucz R.L., 1986, ApJS 61, 509
- [1982] Lester J.B., Lane M.C., Kurucz R.L., 1982, ApJ 260, 272
- [1999] Ludwig H.-G., Freytag B., Steffen M., 1999, A&A 346, 111
- [1985] Moon T.T., Dworetsky M.M., 1985, MNRAS 217, 305
- [1981] Nissen P.E., 1981, A&A 97, 145
- [1980] Philip A.G.D., Egret D., 1980, A&AS 40, 199
- [1978] Relyea L.J., Kurucz R.L., 1978, ApJS 37, 45
- [1999] Schmidt W., 1999, Master’s Thesis, Johannes Kepler University Linz, Austria
- [2002] Simon T., Ayres T.R., Redfield S., Linsky J.L., 2002, ApJ 579, 800
- [1995] Smalley B., Dworetsky M.M., 1995, A&A 293, 446
- [1997] Smalley B., Kupka F., 1997, A&A 328, 439
- [2002] Smalley B., Gardiner R.B., Kupka F., Bessell M.S., 2002, A&A 395, 601
- [1988] Smith K.C., van’t Veer C., 1988 in Elemental Abundance Analyses, Adelman S.J., Lanz T. (eds.), Institut d’Astronomie de l’Universite de Lausanne, p. 133
- [1996] van’t Veer C., Megessier C., 1996, A&A 309, 879
- [1999] Weiss W.W., Kupka F., 1999 In: Giménez Á., Guinan E.F., Montesinos B. (eds.), Theory and Tests of Convection in Stellar Structure, A.S.P. Conf. Proc. 173, p. 21
GrevesseTurbulence in the Sun not only shows up in the asymmetries of the lines through the shapes of the bisectors but also in a systematic but small blue shift of the centre of the line which is related to the depth of formation of the line.
KupkaIn stellar evolution, “alpha” is tuned to match the radius of the present sun. Now this may be calibrated by numerical simulations. But such an MLT calibrated model such matches the right entropy jump. It’s actual temperature gradient is likely to be wrong (and it will actually continue to fail in helioseismological tests), as will be the radiation field, and the colours computed from it. Thus, just tuning the alpha with simulations won’t help - you can only get one quantity at and perhaps near the calibration point. It does not dispatch us from finding a better model, and the alpha to match a particular quantity may be whatever in a particular case.
SmalleyIndeed, from a purely observational viewpoint we could use a negative mixing-length if that fitted the observational data better!