Discovery of the Near-IR Afterglow and of the Host of GRB 030528 ††thanks: Based on observations collected at the European Southern Observatory, La Silla and Paranal, Chile by GRACE under ESO Program 71.D-0355.
The rapid dissemination of an arcmin-sized HETE-2 localization of the long-duration X-ray flash GRB 030528 led to a ground-based multi-observatory follow-up campaign. We report the discovery of the near-IR afterglow, and also describe the detection of the underlying host galaxy in the optical and near-IR bands. The afterglow is classified as “optically dark” as it was not detected in the optical band. The -band photometry presented here suggests that the lack of optical detection was simply the result of observational limitations (lack of rapid and deep observations plus high foreground extinction). Simple power law fits to the afterglow in the -band suggest a typically decay with a slope of =1.2. The properties of the host are consistent with the idea that GRB hosts are star forming blue galaxies. The redshift of GRB 030528 can not be determined accurately, but the data favour redshifts less than unity. In addition, we present an optical and near-IR analysis of the X-ray source CXOU J170354.0–223654 from the vicinity of GRB 030528.
Key Words.:
gamma rays: bursts1 Introduction
Optical and near-IR afterglows play a crucial role in the understanding of the phenomenon of long duration Gamma-ray bursts (GRB). While prompt -ray emission has been known since 1973 (Klebesadel et al. 1973), a major breakthrough in GRB research came with the discoveries of the first X-ray afterglow (Costa et al. 1997) and optical transient (van Paradijs et al. 1997). Firm evidence for the cosmological origin of GRBs was first obtained with the determination of the redshift of =0.835 for GRB 970508 from absorption lines in the optical afterglow (Metzger et al. 1997). To date, afterglows for 75 well localized long duration GRBs have been detected and 36 redshifts from emission lines in the underlying host galaxy and/or absorption features in the optical afterglow were determined (see J. Greiner’s web page111http://www.mpe.mpg.de/jcg/grbgen.html). For nearly all well localized bursts an X-ray afterglow was found whenever X-ray observations were performed, but only 53 bursts were also detected in the optical and/or near-IR band. One day after the GRB, optical transients exhibit -band magnitudes that are typically in the range of 19–22 and -band magnitudes of 16–19. Optical/near-IR afterglow light curves can be characterized by a power law in time, Ft-α, with 1.3 (van Paradijs et al. 2000). For the remaining 23 GRBs with X-ray and/or radio afterglow no optical and/or near-IR transient could be detected. For this group of bursts the term “dark burst” was introduced. GRBs detected in the near-IR but lacking an optical afterglow constitute a sub-group, and can be labeled “optically dark bursts”.
In many cases observational limitations can account for the non-detection in the optical or near-IR-band. A slow reaction time, a location in a crowded field, possibly high Galactic foreground extinction, or unfavorable observing conditions, like bright moon and twilight, can explain non-detections of the counterparts. HETE-2 revealed that rapid and accurate localizations of the prompt emission in nearly all cases lead to the detection of an optical transient (Lamb et al. 2004). However, this does not provide a valid explanation for all dark bursts (Klose et al. 2003). In some cases , e.g. GRB 970828 (Groot et al. 1998; Djorgovski et al. 2001) and GRB 990506 (Taylor et al. 2000) even rapid (less than half a day after the GRB) and deep (23) observations did not reveal an afterglow, despite a clearly fading source in the X-ray and/or radio band.
There are many reasons for the non-detection of the optical transients of bursts with known X-ray or radio afterglows (e.g. Fynbo et al. 2001a; Lazzati et al. 2002). In addition to the observational biases mentioned above, the existence of “dark bursts” may reflect a broad distribution of physical parameters of the GRB itself or of its environment, as in the case of GRB 990506 (see Taylor et al. 2000). The rapidly decaying radio afterglow of this burst together with the non-detection in the optical could be due to an extremely low-density medium surrounding the GRB.
Since the spectroscopic confirmation of SN2003dh underlying the afterglow of GRB 030329 (Hjorth et al. 2003; Stanek et al. 2003) it is now widely believed that long-duration GRBs are associated with the death of massive stars (e.g., Heger et al. 2003). Because of the short lifetime of these progenitors of 106 years, they do not propagate far from their birth place in star forming regions. Consequently, the optical and near-IR emission could suffer from significant attenuation in the dusty medium. The X-ray and radio afterglow emission may still be observable. Whether a burst is “dark” or has a detectable optical/near-IR transient would therefore depend on the conditions of the ISM in the vicinity of the GRB. However, it is conceivable that dust destruction by the prompt emission and early afterglow phase alters the circumstances (Galama & Wijers 2001; Galama et al. 2003).
Another possibility to explain “dark bursts” is to place them at high redshift (Lamb & Reichart 2000). The observed redshift distribution of GRBs is very broad and currently ranges between =0.0085 to =4.5 with a broad peak around 1 (e.g. Jakobsson et al. 2004). GRBs at still higher redshifts are expected based on the association with massive stars discussed above. However, the sensitivity of stellar mass loss to metalicity combined with the requirement that jets must successfully emerge from the stellar envelope suggests that single, massive stars in the early universe may not result in observable GRBs (e.g., Heger et al. 2003). Alternative scenarios, some perhaps including binary stars, may very well produce GRBs at redshifts above =6, where the Lyman alpha absorption edge will be shifted through the optical into the near-IR band. The resulting Lyman alpha suppression could then easily account for the lack of optical detections. On the other hand, observations show that the high- explanation for “darkness” can not apply in all cases. For example, GRB 970828 and GRB 000210 revealed underlying host galaxies at positions coincident with those of the X-ray and radio afterglows (Djorgovski et al. 2001; Piro et al. 2002) for which spectra indicate redshifts of =0.958 and =0.8463, respectively.
Here we report on the discovery of the near-IR afterglow of the optically dark GRB 030528 and it’s underlying host galaxy. After describing the prompt emission properties and afterglow searches by other teams (Sect. 2), we present our optical and near-IR observations (Sect. 3) and their reduction (Sect. 4). We show the properties of the near-IR afterglow and of the host galaxy (Sect. 5) and discuss the results in the context of dark bursts (Sect. 6).
2 GRB 030528
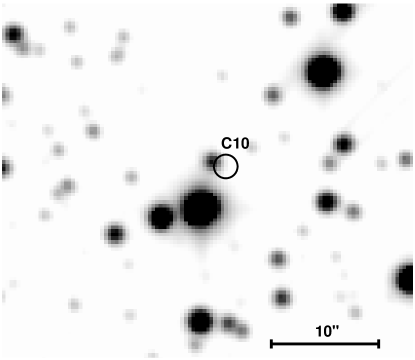
On May 28, 2003 the HETE-2 French Gamma-ray Telescope (FREGATE) and the Wide-field X-ray Monitor (WXM) triggered on a long-duration Gamma-ray burst (HETE trigger #2724) at 13:03 UTC. The event was moderately bright with a fluence222http://space.mit.edu/HETE/Bursts/Data of =5.610-6 erg cm-2 and a peak flux on a one second time scale of 4.910-8 erg cm-2 s-1 in the 30-400 keV band (Atteia et al. 2003a). The burst duration (given as T90, which is the time over which a burst emits from 5% of its total measured counts to 95%, was T90=49.1 s (30-400 keV) and the high energy spectrum peaked at 32 keV. The burst is classified as an X-ray flash according to the fluence ratio =1.130.15.The properties of XRFs, X-ray rich bursts and GRBs apparently form a continuum (Lamb et al. 2004). At 107 min after the onset of the burst a confidence circle with 2′ radius centered at RA(J2000)=17h04m02s, DEC(J2000)=22∘38′59′′ derived from the HETE-2 Soft X-ray Camera (SXC) was released to the community. Figure 1 shows a -band finding chart centered on this initial error circle.
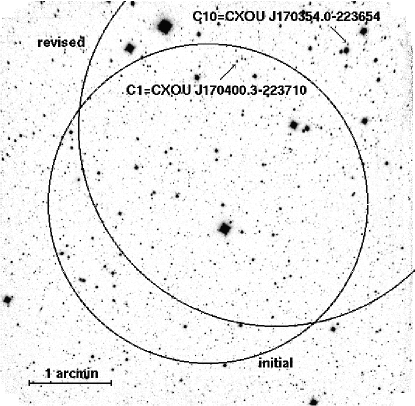
Despite several rapid response observations, no optical afterglow was found in this crowded field in the Galactic Plane (LII=00249, BII=11267). Table 1 provides a list of upper limits. Later, a correction of the initial HETE-2 error circle had to be applied. The radius of the confidence circle increased to 25 and the centroid was displaced by 13. This modification was announced on May 31, 2.4 days after the burst (Villasenor et al. 2003; Fig. 1).
| t | Filter | lim. mag | Ref. |
|---|---|---|---|
| 106 s | white | 15.8 | Torii 2003 |
| 252 s | white | 16.0 | Uemura et al. 2003 |
| 0.097 d | 18.7 | Ayani & Yamaoka 2003 | |
| 0.496 d | white | 20.5 | Valentini et al. 2003 |
| 5.831 d | 19.5 | Bogosavljevic et al. 2003 | |
| 7.653 d | 21.5 | Mirabal & Halpern 2003 |
A 26.1 ksec Chandra observation performed on June 3 (5.97–6.29 days after the burst) of the revised HETE-2 confidence circle revealed several X-ray sources in the 0.5–8 keV band (Butler et al. 2003a). Two of these, C1=CXOU J170400.3–223710 and C10=CXOU J170354.0–223654 were located inside our field of view. Following these detections, we inspected earlier multi-epoch near-IR SofI images and found that one source, coincident with C1, exhibited significant fading (Greiner et al. 2003a) which made this source the most likely afterglow candidate. A second Chandra observation (20 ksec exposure on June 9) showed that only one of the X-ray sources, C1, was in fact fading (Butler et al. 2003b). This observation confirmed the identification of C1 as the afterglow of GRB 030528. The X-ray observations are described by Butler et al. (2004). C1 is inside the initial HETE-2 error circle. Therefore, the optical non-detections mentioned above, are not a result of it’s later revision. Follow-up observations in the radio (Frail & Berger 2003) did not detect C1, or any other source inside the revised error circle.
3 Observations
Shortly (0.6684 days) after the initial 2′ confidence circle was released, ToO imaging with the 3.58 m ESO-New Technology Telescope (NTT) equipped with the Son of ISAAC (SofI) infrared spectrograph and imaging camera at La Silla/Chile were initiated (Tab. 2). SofI is equipped with a 10241024 HgCdTe Hawaii array with 18. 5m pixel size and a plate scale of 029 per pixel. It has a field of view of 55. During the first two nights (0.7 and 1.7 days after the burst) imaging in , and was performed. During the fourth night (3.6 days post-burst) only -band imaging was carried out. The seeing conditions during the observations of this very crowded field were good for the first and third epoch (08) but less favorable for the second epoch (11–16). All of the above imaging was centered on the initial HETE-2 error circle. Due to the later increase and shift of the confidence circle and the 55 field of view of NTT-SofI, the observations do not cover the entire revised error circle (see Fig. 1).
At 14.9 days after the burst, one -band observation was performed with the 3.8 m United Kingdom Infra-Red Telescope Fast-Track Imager (UKIRT UFTI) on Mauna Kea under good seeing conditions (0.6′′). UFTI consists of a 1024x1024 HgCdTe Rockwell array with 18.5 m pixels and a plate scale of 009 per pixel, giving a field of view of 92′′92′′.
Nearly-Mould -band photometry was obtained with the Mosaic2 imager at the 4 m Blanco Telescope at the Cerro Tololo Inter-American Observatory (CTIO) 6.6 and 32.6 days after the burst. The Mosaic2 consists of eight 2048x4096 SITe CCDs with a pixel size of 15 m. The plate scale of 027 per pixel at the 4 m Blanco-Telescope produces a field of view of 36′36′.
In addition, late time -band imaging was performed with the Infrared Spectrometer And Array Camera (ISAAC) at the 8.2 m ESO Very Large Telescope (VLT) Antu in Paranal/Chile 111, 121, 124, and 125 days after the burst. ISAAC is equipped with a 10241024 pixel Rockwell Hawaii HgCdTe array with a 18.5 m pixel size. The plate scale of 0147 per pixel provides a 2525 field of view.
Further, late epoch and -band observations were obtained with the Danish Faint Object Spectrograph and Camera (DFOSC) at the Danish 1.54m Telescope at La Silla/Chile 381–386 days after the burst. DFOSC consists of a 20484096 EEV/MAT CCD with a pixel size of 15 m and a plate scale of 039 per pixel. As the instument optics does not utilise the full chip area, only 21482102 pixels are illuminated, giving a field of view of 13133. These and the above mentioned observations are summarized in Tab. 2.
| Date | Telescope/Instrument | Filter | Exposure | Seeing | Brightness | log Flux Density | |
|---|---|---|---|---|---|---|---|
| (Start UT) | (days) | (min) | (mag) | (erg/cm2/s/Å) | |||
| 2003 May 29 04:58 | 0.6684 | NTT-SofI | J | 15 | 0.8′′ | 20.60.3 | –17.730.12 |
| 2003 May 29 05:16 | 0.6809 | NTT-SofI | H | 15 | 0.8′′ | 20.30.4 | –18.050.16 |
| 2003 May 29 05:32 | 0.6920 | NTT-SofI | Ks | 15 | 0.8′′ | 18.60.2 | –17.830.08 |
| 2003 May 30 04:54 | 1.6673 | NTT-SofI | J | 20 | 1.6′′ | 20.2 | –17.57 |
| 2003 May 30 05:16 | 1.6826 | NTT-SofI | H | 20 | 1.1′′ | 19.9 | –17.89 |
| 2003 May 30 05:40 | 1.6993 | NTT-SofI | Ks | 20 | 1.1′′ | 18.90.3 | –17.950.12 |
| 2003 Jun 01 04:07 | 3.6486 | NTT-SofI | Ks | 60 | 0.8′′ | 19.60.5 | –18.230.20 |
| 2003 Jun 04 02:10 | 6.5604 | Blanco-Mosaic2 | I | 40 | 1.2′′ | 21.40.3 | –17.630.12 |
| 2003 Jun 12 08:55 | 14.8680 | UKIRT-UFTI | K | 116 | 0.6′′ | 19.60.1 | –18.230.04 |
| 2003 Jun 30 03:00 | 32.5951 | Blanco-Mosaic2 | I | 40 | 1.1′′ | 21.20.3 | –17.550.12 |
| 2003 Sep 17 00:12 | 111.4820 | VLT-ISAAC | Js | 50 | 0.6′′ | 21.00.2 | –17.890.08 |
| 2003 Sep 27 00:27 | 121.4966 | VLT-ISAAC | Js | 60 | 0.9′′ | 21.10.3 | –17.930.12 |
| 2003 Sep 29 23:38 | 124.4743 | VLT-ISAAC | Js | 94 | 0.7′′ | 20.70.1 | –17.770.04 |
| 2003 Oct 01 00:04 | 125.4799 | VLT-ISAAC | Js | 60 | 0.6′′ | 20.70.2 | –17.770.08 |
| 2004 Jun 15–18 | 382.5 | D1m54-DFOSC | R | 75 | 1.4′′ | 22.00.2 | –17.550.08 |
| 2004 Jun 18–19 | 384.5 | D1m54-DFOSC | V | 135 | 1.5′′ | 21.90.2 | –17.190.08 |
| 2003 Sep 17 – Oct 01 | ISAAC-combined(1) | Js | 264 | 20.80.1 | –17.810.04 |
4 Data Reduction
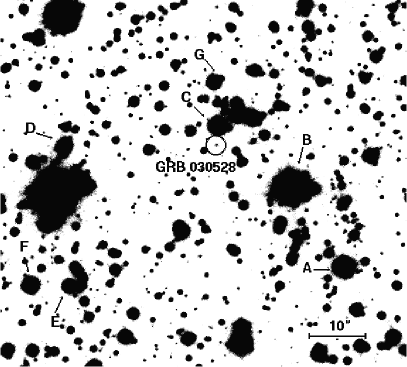
The NTT-SofI and VLT-ISAAC near-infrared images were reduced using ESO’s Eclipse package (Devillard 1997). The reduction of the Blanco-Mosaic2 data was performed with bbpipe, a script based on the IRAF/MSCRED, the UKIRT-UFTI observation was reduced using ORACdr and the DFOSC data were reduced with IRAF. Astrometry was performed using IRAF/IMCOORDS and the coordinates of stars in the field provided by the 2MASS All-Sky Point Source Catalog333http://irsa.ipac.caltech.edu/applications/Gator/. For the photometry we used IRAF/DAOPHOT. To account for the distortions in the SofI images caused by the position of C1 at the edge of the field of view (see Fig. 1), we used stars contained in the 2MASS Catalog from the vicinity of the source for the photometric calibrations of the and fields. The stars are listed in Tab. 3. We only used the stars for which magnitude uncertainties in the relevant bands were provided. The Mosaic2 -band images were calibrated using the USNOFS field photometry of Henden (2003), in particular the three stars B, C & G (Fig. 2). The photometric measurements are partly hampered by the combination of instrumental distortions and the high density of sources in the field. The crowdedness of the field also affected the set of comparison stars. Only source F (Fig.2) is sufficiently isolated to provided high quality calibration. The photometry for A, B, C, D, E and G is less accurate in comparison to F, but not by much. In any case all individual uncertainties are taken into account in the error analysis. The DFOSC and -band calibration was performed using observations of the standard star G153-41 (Landolt 1992).
| Star | RA (J2000) | DEC (J2000) | I | J | H | Ks |
|---|---|---|---|---|---|---|
| hh:mm:ss | dd:mm:ss | [mag] | [mag] | [mag] | [mag] | |
| A | 17:03:58.6 | –22:37:33 | (1) | 14.970.03 | 14.260.05 | 14.040.05 |
| B | 17:03:59.3 | –22:37:18 | 14.600.02 | 13.370.02 | 12.640.03 | 12.460.02 |
| C | 17:04:00.3 | –22:37:06 | 16.330.10 | 15.500.07 | 14.870.08 | 14.760.11 |
| D | 17:04:02.5 | –22:37:10 | (1) | 16.090.11 | 15.580.11 | 15.480.21 |
| E | 17:04:02.9 | –22:37:37 | (1) | 16.570.13 | 16.150.17 | 15.76(2) |
| F | 17:04:02.4 | –22:37:37 | (1) | 15.960.08 | 15.480.10 | 15.200.18 |
| G | 17:04:00.4 | –22:36:58 | 17.440.20 | 16.430.11 | 15.880.12 | 15.38(2) |
To establish the proper photometric zero-points for the different instruments used in this study we cross-checked stellar colors (of non-saturated stars in the field) against a set of theoretical colors along the main sequence. We utilized synthetic stellar spectra from the library of Pickles (1998) and convolved those with the filter transmission curves and efficiencies of SofI, ISAAC, Mosaic2 and DFOSC. A good match to within a zero-point accuracy of 0.05 mag is obtained in all bands.
The 2MASS catalog provides the standard , & -band magnitudes. In addition to these bands we also present observations obtained in and . The -band filter has a width of 0.16 m and is narrower than -band filter (0.29 m) and the -band filter is broader than the -band filter with a width of 0.35 m (instead of 0.27 m). Furthermore, the -band is centered at 2.16 m while the -band is centered at 2.20 m. However, since and have respectively higher and lower transmission than the and , the net effect is that -0.05 (-0.02).
All magnitudes are corrected for Galactic foreground extinction according to the prescription given by Schlegel et al. (1998). For the coordinates of the afterglow of GRB 030528 we find =0.60, AK=0.22 mag, AH=0.35 mag, AJ=0.54 mag, AI=1.17 mag, AR=1.61 mag and AV=2.00 mag.
5 Results
We now describe our results on the near-IR afterglow and on the optical/near-IR observations of the underlying host galaxy of GRB 030528 and discuss host properties in terms of population synthesis models. We apply the same methodology to the source C10, which is unrelated to the GRB, but defer the description to Appendix A.
C1 is the brightest X-ray source in the initial Chandra field at a flux level of 1.410-14 erg cm-2 s-1 at 0.5–8 keV (Butler et al. 2004). This value was calculated assuming a power law spectrum with a slope of =1.9 and taking into account Galactic foreground extinction due to a neutral hydrogen column density of 1.61021 cm-2. At the X-ray position of C1 a faint object in our SofI , & -band observations 0.7 days post-burst is apparent. The source is near the detection limits in and , but significantly detected in . The magnitudes, corrected for foreground extinction in the Galaxy, are =20.60.3, =20.30.4 and =18.60.2 (see also Tab.2).
Seeing conditions during the second night (1.6 days post-burst) only allow us to derive brightness limits for C1 in the and band but we were able to detect the source at =18.90.3. The and -band data are insufficient to test variability, and the two -band measurements are formally consistent with a constant source. However, on June 1 (3.6 days post-burst) fading became apparent. At that time the source had declined to =19.60.5, corresponding to a change by roughly 1 mag within three days. Fig. 3 shows the light curve of the source in together with all near-IR observations presented here and the near-IR upper limits published in the GRB Coordinates Network (GCN)444http://gcn.gsfc.nasa.gov/gcn/gcn3_archive.html.
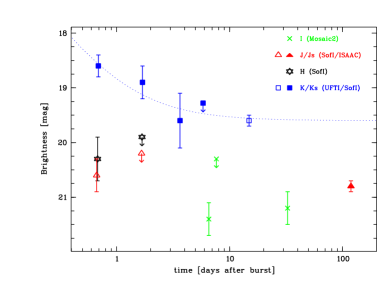
In contrast to the -band variability, no fading is observed in the -band observations taken 6.6 and 32.6 days after the burst. The source is persistent at a brightness of =21.30.3, which we interpret as the -band magnitude of the host galaxy. Similarly, comparing the late time (100 days post-burst) ISAAC -band observations with the SofI -band data from the first night (0.6 days post-burst), the source also remains constant within the uncertainties of the measurements. Thus, the decay of the near-IR afterglow is only detected in the -band.
In order to compare the afterglow decay in the near-IR with that in the X-ray band, we estimate the power law slope, , from the few -band data shown in Fig. 3. Obviously, the uncertainties in the photometry and the poor sampling of the light curve do not allow us to derive an accurate description of the afterglow behavior. A major source of uncertainty is introduced by the fact that we do not know when a jet break may have occurred. If the break occurred before our first -band observation at t=0.7 days the subsequent decay slope may have been close to =1.2. If the afterglow is best described by a single power law, the shallowest slope could be around =0.7. In that case, the afterglow contribution to the -band flux at 14.9 days post-burst is not negligible. Slopes much steeper than =1.2 can be imagined upon arbitrarily placing the break time close to t=3 days. This is likely to be the case considering typical break times of 0.4–4 days. Therefore, it appears reasonable that the post-break near-IR slope falls in the range of =0.7–2. The significant uncertainties in the slopes leave the possibility that the near-IR and X-ray (=2.00.8; Butler et al. 2004) decays are parallel.
The -band image from an UKIRT/UFTI observation 14.9 days after the burst shows that the image of the source is extended relative to the point spread function of the field in East-West direction (1.5′′0.8′′) (Fig. 4). This elongation is consistently seen in the late time ISAAC -band images. The center of the source is located at RA(2000)=17h04m00.3s, DEC(2000)=–22∘37′10s. The positional coincidence with the afterglow suggests that this is the underlying host galaxy of GRB 030528. We cannot exclude a residual point-like contribution to the total flux, including the afterglow and possibly an additional supernova (Zeh et al. 2004). A free fit to the -band afterglow light curve gives a host magnitude of =19.90.7. Assuming that after about 10 days all fluxes at shorter wavelengths (–) are exclusively due to the host galaxy, we find a host magnitude of =20.80.1, an average -band magnitude of =21.30.3, =22.00.2 and =21.90.2. In the -band we use the early SofI measurement of =20.30.4 as an upper limit to the host brightness.
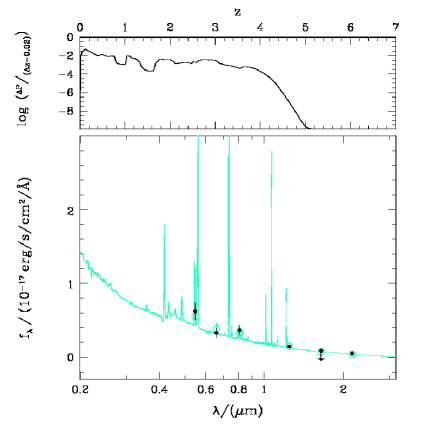
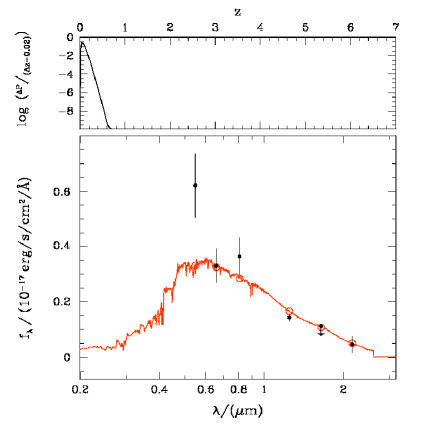
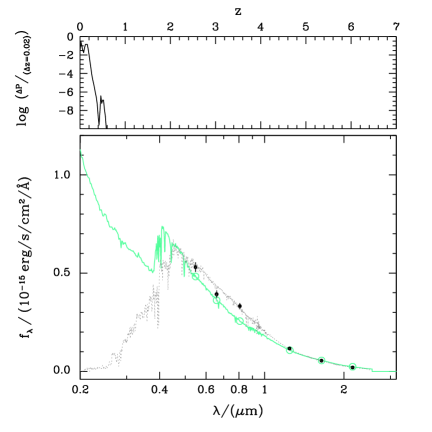
These broadband photometric measurements can be used to constrain the redshift range and galaxy classification of the host. Therefore, we applied the photometric redshift technique described in Bender et al. (2001). Thirty template spectra of a variety of galaxy types (from ellipticals to late type spirals as well as irregulars) were convolved with the filter curves and efficiencies used in our observations. The templates consist of local galaxy spectra (Mannucci et al. 2001; Kinney et al. 1996) and semi-empirical templates (Maraston 1998; Bruzual & Charlot 1993) and cover a wide range of ages and star formation histories. Varying the redshift between =0 and =10 we determine a probability density function via Bayesian statistic using eigenspectra. This photometric redshift method was earlier applied and calibrated e.g. on more than 500 spectroscopic redshifts of galaxies from the Munich Near-Infrared Cluster Survey with an rms scatter of 0.055 and no mean bias (Drory et al. 2003).
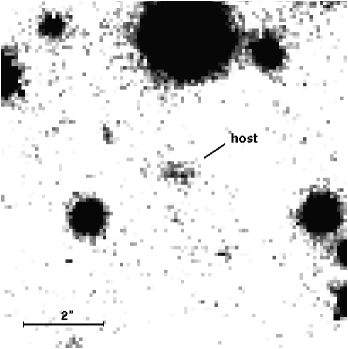
Fig. 5 and Fig. 6 show the resulting redshift probability density function together with the photometric measurements of the galaxy and two fitting galaxy template spectra. Late type star forming galaxies lead to significantly better matches to the observations (reduced 21) in contrast to ellipticals (reduced 22). The lack of -band observations for GRB 030528 and the poor quality of the photometry reduces the power of the method and results in a relatively unconstrained redshift range. For late type galaxies redshifts beyond of =4 appeared to be ruled out, while for ellipticals redshifts should not exceed . For completeness we also considered stellar spectra, and find that all available templates produce fits worse than those for elliptical galaxies (reduced 2.2; not plotted here).
6 Discussion
The discovery of the near-IR afterglow and optical/near-IR host galaxy of GRB 030528 presented here, again demonstrates the importance of rapid, deep multi-wavelength follow-up observations. In this particular case rapid and deep near-IR observations were obtained, but the afterglow would probably not have been identified without the Chandra observations in the X-ray band. Guided by the X-ray data, we discovered the afterglow in a crowded field at a position significantly affected by image distortions. However, it took additional X-ray observations to confirm the near-IR-candidate. The chain of events for GRB 030528 emphasizes that observational programs directed at the identification and study of GRB afterglows depend critically on at least three ingredients; rapid response, deep imaging, and multi wavelength coverage. Lacking any one of these, GRB 030528 would have most likely been labeled as a “dark burst”. The fact that it was caught in the near-IR still attaches the label “optically dark” GRB, and one wonders if this is an instrumental effect or intrinsic.
The non-detection of the optical afterglow may have several reasons. The lack of early, deep optical observations is perhaps the most important. Using the decay observed in the -band (Fig. 3) we estimate the -band magnitude at the time of the early observations at the Bisei Observatory (Ayani & Yamaoka 2003) which provide a upper limit of 18.7 at t=0.097 days. Ignoring the possibility of a break in the power law decay one predicts 16.5 at that time. With the typically observed afterglow colors of –2–5 mag (Gorosabel et al. 2002) this corresponds to =18.5–21.5. Applying the Galactic foreground extinction correction the observable brightness should have been =20.1–23.1. An early break in the light curve would suggest an even dimmer source. Clearly the depths of the Bisei observation did not reach a level required to capture the afterglow of GRB 030528. Depending on the – colour, the afterglow might have been detected if it would not had suffered from the large Galactic foreground extinction. Thus, the position in the Galactic Plane additionally hampered the optical detection. It is obvious that this GRB is yet another example of a burst which maybe “falsely accused of being dark”. HETE-2 observations indeed suggest that “optically dark” burst may mostly be due to a shortage of deep and rapid ground-based follow-up observations and adverse observing conditions (Lamb et al. 2004).
A further challenge to the task of finding afterglows is the competition in brightness between the afterglow and the host galaxy. Except for extremely early observations the afterglow flux may be comparable or significantly less than the integrated flux from a normal galaxy. This obviously poses a challenge as the signal-to-noise ratio is essential for any detection algorithm.
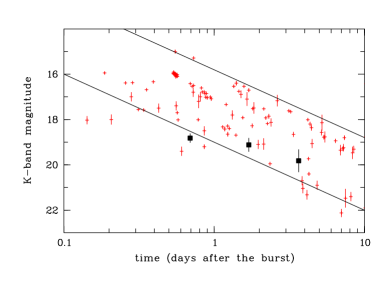
Considering the luminosity functions for the host galaxies and the afterglows one potentially encounters a further challenge. A bright afterglow against the backdrop of a faint host is probably easy to identify, while a faint afterglow from a bright host could more easily escape detection. Figure 7 demonstrates that the -band afterglow of GRB 030528 was indeed very faint when compared to all -band detections of afterglows reported in the literature so far. Only the -band afterglow of GRB 971214 was fainter at the time of its discovery (Ramaprakash et al. 1998). On the other hand, Fig. 7 also shows that most -band afterglows detected by mid 2004 occupy a region, which spans over only 3 magnitudes. Assuming that 19.6 measured at t=14.9 days is in fact the magnitude of the host (an underlying supernova contribution might introduce a small upwards correction) this galaxy would be among the brightest GRB hosts in the -band to date.
Based on the few photometric data points for the afterglow, some of which only provide upper limits due to the contribution of the host, we derive a rough lower limit on the spectral slope, . Such a spectral slope would not be atypical. Also, the temporal decay is in the range of the standard value of (van Paradijs et al. 2000).
The near-IR afterglow was significantly detected only in the -band. Does the non-detection in the and -bands require large intrinsic extinction? Both, the -band and the -band addresses the above question to some extent. Assuming a typical afterglow law for the spectral energy distribution of with =0.8 (0.4) we estimate foreground extinction corrected and -band magnitudes at =0.6 days post burst. The expected -band magnitude of 20.4 (20.6) is consistent with the observed value of =20.30.4. As the host seems to dominate the -band emission at that time, no constraint on the intrinsic extinction of the afterglow can be set. However, the expected -band magnitude of 19.5 (19.6) is significantly brighter than the observed value of =20.60.3 and thus indicative of some additional intrinsic extinction. Nevertheless, the data only allow us to derive a rough estimate for the observer frame extinction of 2. From estimates of the effective neutral hydrogen column density in the X-ray band (Butler et al. 2004) it is clear that intrinsic extinction in the host galaxy may account for at most a few magnitudes in the -band. These two approaches yield comparable values, but the uncertainties are large in either case.
The -2.4 mag color of the host seems to be consistent with the colors in the sample of GRB host galaxies detected in the -band (leFloc’h et al. 2003). Our spectral template fitting (see section 5) is consistent with the idea that GRB host galaxies are actively star forming blue galaxies as emphasized by leFloc’h et al. (2003). It is perhaps fair to assume that the host of GRB 030528 is similar to the host sample discussed by these authors. leFloc’h et al. find that GRB hosts appear to be sub-luminous at approximately 8% of L∗ in a Schechter distribution function. If, for simplicity, we assume that the host of GRB 030528 has an absolute brightness of exactly this value (corresponding MK=–22.25) the -band magnitude derived from the fit to the afterglow light curve of =19.90.7 implies a redshift of 0.4–0.6 (for currently accepted cosmological parameters). Applying the pseudo redshift indicator of Atteia (2003b) to the HETE-2 data gives ’=0.36, which is close to the above value. The assumed absolute magnitude is uncertain by about 2 mag and pseudo redshifts are also uncertain to within a factor two to three. It is thus clear that the redshift of the host of GRB 030528 is by no means established. However, it seems reasonable to interpret the observations to imply redshifts of the order of unity or less. At =0.4 the angular extent of 15 of the host (see Fig. 4) implies a linear dimension of 8.7 kpc (assuming standard cosmology). This would suggest the host to be a blue compact star forming galaxy.
In summary, we have demonstrated that observations in the near-IR hold the promise to detect afterglows that escape in the optical band because of possible reddening. Despite the success of the discovery of the afterglow of GRB 030528 coverage was insufficient to establish a well sampled light curve and to derive an accurate redshift. However, our detection of the host galaxy provides indirect evidence for a low redshift. Despite a significant allocation of observing time at large aperture telescopes, the sampling of this afterglow fell short of optimal coverage and depth. The well recognized shortage of global resources is likely to present a major hurdle to afterglow programs in the SWIFT-era when the burst detection rate is expected to increase dramatically.
7 Acknowledgements
This work is primarily based on observations collected at the European Southern Observatory, Chile, under the GRACE proposal 71.D-0355 (PI: E.v.d.Heuvel) with additional data obtained at the Cerro Tololo Inter-American Observatory and the United Kingdom Infra-Red Telescope. We are highly indebted to the ESO staff, in particular C. Cid, C. Foellmi, P. Gandhi, S. Hubrig, R. Johnson, R. Mendez, J. Pritchard, L. Vanzi & J. Willis for the prompt execution of the observing requests and all additional effort related to that. We thank the anonymous referee for insightful and helpful comments and P. Reig for his attempt to observe the host with the 1.3 m telescope at Skinakas Observatory. This publication makes use of data products from the Two Micron All Sky Survey, which is a joint project of the University of Massachusetts and the Infrared Processing and Analysis Center/California Institute of Technology, funded by the National Aeronautics and Space Administration and the National Science Foundation. This research has made use of data obtained from the HETE science team via the website http://space.mit.edu/HETE/Bursts/Data. HETE is an international mission of the NASA Explorer program, run by the Massachusetts Institute of Technology.
Appendix A - CXOU J170354.0–223654
We here summarize our results on the optical and near-IR observations of C10=CXOU J170354.0–223654. At the X-ray position a source is detected in the SofI , and as well as in the Mosaic -band and DFOSC and -band images (Fig. 8, RA(2000)=17:03:54.0, DEC(2000)=-22:36:53). C10 is outside the field of view of the ISAAC and UFTI observations. Tab. 4 lists the brightness and flux density values for all observations with C10 in the field of view. The source shows no significant variation in any band. Likewise, the two Chandra observation also indicate that C10 is constant in the X-ray band. This makes an association with GRB 030528 very unlikely.
| Filter | Brightness | log Flux | |
|---|---|---|---|
| (days) | (mag) | (erg/cm2/s/Å) | |
| 0.6684 | J | 16.040.05 | –15.910.02 |
| 1.6673 | J | 16.200.24 | –15.970.09 |
| 0.6809 | H | 15.780.05 | –16.240.02 |
| 1.6826 | H | 15.860.08 | –16.270.03 |
| 0.6920 | Ks | 15.690.06 | –16.670.02 |
| 1.6993 | Ks | 15.760.10 | –16.690.04 |
| 3.6486 | Ks | 15.620.06 | –16.640.02 |
| 6.5694 | I | 16.420.05 | –15.800.02 |
| 32.5951 | I | 16.360.05 | –15.770.02 |
| 382.5 | R | 16.810.05 | –15.470.02 |
| 384.5 | V | 17.070.05 | –15.260.02 |
The counterpart of C10 appears point like in the optical/near-IR images (Fig. 8). This allows both, a stellar and a Galactic nature of the object. In case of a star, the distance of the source in the Galaxy and thus the degree of extinction is unknown. Exploring the range from a nearby location (quasi unextinguished) to the opposite side of the Milky Way (foreground extinction assumed as given above) we derive ranges for the near-IR colors of -=0.2–0.6 mag and -=0.6-1.6 mag. Due to the unknown extinction, the optical colours span an even wider range. The colors constrain the spectral type to G–K for a main sequence star or supergiant (Johnson 1966). Fig. 9 shows an example fit of the spectrum of a G0 star to our photometric data (lower panel; dotted line). However, the ratio of X-ray to bolometric flux can be used to test the stellar origin of C10. From the observed Chandra counts in the energy range of 0.5–8 keV (a total of 17.5 counts in 45 ksec) we derive the X-ray flux as Fx(3.3–4.2)10-15 erg cm-2 s-1 (assuming a power law shape with =1.9). The lower value gives the flux corrected for the hydrogen column in the Galaxy (NH=1.61021 cm-2) while the upper limit results for an object with NH=0. Using the colors and bolometric corrections for G–K main sequence stars given by Johnson (1966) together with the observed -band magnitudes and filter width, we estimate the bolometric flux to be Fbol=(0.8–4)10-13 erg cm-2 s-1. The resulting ratio of log(Fx/Fbol)=-1.80.5 exceeds significantly the value typically observed for G–K stars (-4.5 to -6.5; Pallavicini et al. 1981). Therefore, although the photometric data allow an association of C10 with a single star, the X-ray properties make this very unlikely. Nevertheless, we can not exclude an X-ray binary system in the Galactic Plane with the X-ray radiation coming from an accretion disk around a black hole or from a neutron star surface and the optical/near-IR emission being produced by the accretion disk, outflow and secondary star.
C10 can also be associated with a galaxy behind the Milky Way. Similarly to the analysis of C1, we applied the photometric redshift technique of Bender et al. (2001). Fig. 9 shows the redshift probability density function and the best fitting galaxy spectrum. A fit of a late type galaxy template to the data shows no sufficient match (reduced 2.3). Early type galaxies are excluded by the fit with a reduced 26. The redshift for the best fitting galaxy template is 0.2. Given the point-like appearance of the source, =0.1 would require a compact small galaxy. As for a star, we use the X-ray properties to test for a possible galaxy nature of C10. From the best fitting galaxy template spectrum the expected -band flux can be estimated. A late type galaxy with the observed multicolor magnitudes as shown in Fig. 9, has FB3.610-13 erg cm-2 s-1. Using the extinction corrected X-ray flux given above, we derive log(Fx/FB)=–2.6 consistent with the observations of normal galaxies (Fabbiano 1989).
The applied photometric redshift method does not allow us to estimate the redshift probability for AGNs. As shown above, templates of stars and normal galaxies have problems to fit the data. The appearance as a point source together with the X-ray properties instead make an association of C10 with an AGN the most likely solution. Spectroscopic observations are necessary to confirm this result.
Appendix B - -band afterglow light curve data
We used the following bursts for the compilation of -band afterglow light curves in Fig.7: GRB 970508 (Chary et al. 1998), GRB 971214 (Gorosabel et al. 1998; Ramaprakash et al. 1998), GRB 980329 (Larkin et al. 1998; Reichart et al. 1999), GRB 980613 (Hjorth et al. 2002), GRB 990123 (Kulkarni et al. 1999; Holland et al. 2004), GRB 991208 (Bloom et al. 1999), GRB 991216 (Vreeswijk et al. 1999; Garnavich et al. 2000; Halpern et al. 2000), GRB 000131 (Andersen et al. 2000), GRB 000301C (Kobayashi et al. 2000; Jensen et al. 2001; Rhoads & Fruchter 2001), GRB 010222 (Masetti et al. 2001), GRB 001011 (Gorosabel et al. 2002), GRB 000926 (Di Paola et al. 2000; Fynbo et al. 2001b), GRB 011121 (Price et al. 2002; Greiner et al. 2003b), GRB 011211 (Jakobsson et al. 2003), GRB 020305 (Burud et al. 2002), GRB 020322 (Mannucci et al. 2002), GRB 020405 (Masetti et al. 2003), GRB 020813 (Covino et al. 2003), GRB 021004 (Di Paola et al. 2002), GRB 021211 (Fox et al. 2003b), GRB 030115 (Kato & Nagata 2003; Dullighan et al. 2004), GRB 030227 (Castro-Tirado et al. 2003), GRB 030323 (Vreeswijk et al. 2004), GRB 030429 (Nishiyama et al. 2003; Jakobsson et al. 2004), XRF 030723 (Fox et al. 2003a; Fynbo et al. 2004), GRB 031203 (Malesani et al. 2004; Prochaska et al. 2004).
References
- (1) Andersen, M.I., Hjorth, J., Pedersen, H., et al. 2000, A&A, 364, L54
- (2) Atteia, J-L., Kawai, N., Lamb, D., et al. 2003a, GCN, 2256
- (3) Atteia, J-L. 2003b, A&A, 407, L1
- (4) Ayani, K., & Yamaoka, H. 2003, GCN, 2257
- (5) Bender, R., Appenzeller, I., Böhm, A., et al. 2001, in ESO/ECF/STScI Workshop on Deep Fields, ed. S. Christiani (Berlin:Springer), 327
- (6) Bloom, J.S., Diercks, A., Kulkarni, S.R., et al. 1999, GCN, 480
- (7) Bogosavljevic, M., Mahabal, A., & Djorgovski, S.G. 2003, GCN, 2275
- (8) Bruzual, G. & Charlot, S. 1993, ApJ, 405, 538
- (9) Burud, I., Rhoads, J., Fruchter, A., & Griep, D. 2002, GCN, 1283
- (10) Butler, N., Dullighan, A., Ford, P., et al. 2003a, GCN, 2269
- (11) Butler, N., Dullighan, A., Ford, P., et al. 2003b, GCN, 2279
- (12) Butler, N., Dullighan, A., Ford, P., et al. 2004, astro-ph/0401019
- (13) Castro-Tirado, A.J., Gorosabel, J., Guziy, S., et al. 2003, A&A, 411, L315
- (14) Chary, R., Neugebauer, G., Morris, M., et al. 1998, ApJ, 498, L9
- (15) Costa, E., Frontera, F., Heise, J., et al. 1997, Nature, 387, 783
- (16) Covino, S., Malesani, D., Tavecchio, F., et al. 2003, A&A, 404, L5
- (17) Devillard, N. 1997, The Messenger 87, 19
- (18) Di Paola, A., Boattini, A., Del Principe, M., et al. 2002, GCN, 1616
- (19) Di Paola, A., Speziali, R., Antonelli, L.A., et al. 2000, GCN, 816
- (20) Djorgovski, S.G., Frail, D.A., Kulkarni, S.R. et al. 2001, ApJ, 562, 654
- (21) Drory, N., Bender, R., Feulner, G., et al. 2003, ApJ, 595, 698
- (22) Dullighan, A., Ricker, G., Butler, N., & Vanderspek, R. 2004, astro-ph/0401062
- (23) Fabbiano, G. 1989, ARA&A, 27, 87
- (24) Fox, D.W., Kaplan, D.L., Cenko, B., Kulkarni, S.R., & Nechita, A. 2003a, GCN, 2323
- (25) Fox, D.W., Price, P.A., Soderberg, A.M., et al. 2003b, ApJ, 586, L5
- (26) Frail, D.A., & Berger, E. 2003, GCN, 2270
- (27) Fynbo, J.P.U., Jensen, B.L., Gorosabel, J., et al. 2001a, A&A, 369, 373
- (28) Fynbo, J.P.U., Gorosabel, J., Dall, T.H., et al. 2001b, A&A, 373, 796
- (29) Fynbo, J.P.U., Sollerman, J., Hjorth, J., et al. 2004, ApJ accepted, astro-ph/0402240
- (30) Galama, T.J. &, Wijers, R.A.M.J. 2001, ApJ, 549, L209
- (31) Galama, T.J., Reichart, D., Brown, T.M., et al. 2003, ApJ, 587, 135
- (32) Garnavich, P.M., Jha, S., Pahre, M.A., et al. 2000, ApJ, 543, 61
- (33) Gorosabel, J., Castro-Tirado, A.J., Willott, C.J., et al. 1998, A&A, 335, L5
- (34) Gorosabel, J., Fynbo, J.P.U., Hjorth, J., et al. 2002, A&A, 384, 11
- (35) Greiner, J., Rau, A., & Klose, S. 2003a, GCN, 2271
- (36) Greiner, J., Klose, S., Salvato, M., et al. 2003b, ApJ, 599, 1223
- (37) Groot, P.J., Galama, T.J., van Paradijs, J., et al. 1998, ApJ, 493, L27
- (38) Halpern, J.P., Uglesich, R., Mirabal, N., et al. 2000, ApJ, 543, 697
- (39) Heger, A., Fryer, C.L., Woosley, S.E., Langer, N., & Hartmann, D.H. 2003, ApJ 591, 288
- (40) Henden, A. 2003, GCN, 2267
- (41) Hjorth, J., Thomsen, B., Nielsen, S.R., et al. 2002, ApJ, 576, 113
- (42) Hjorth, J., Sollerman, J., Møller, P. et al. 2003, Nature, 423, 847
- (43) Holland, S.T., Bersier, D., Bloom, J.S., et al. 2004, AJ submitted, astro-ph/0405062
- (44) Jakobsson, P., Hjorth, J., Fynbo, J.P.U., et al. 2003, A&A, 408, 941
- (45) Jakobsson, P., Hjorth, J., Fynbo, J.P.U., et al. 2004, ApJ submitted, astro-ph/0407439
- (46) Jensen, B.L., Fynbo, J.U., Gorosabel, J., et al. 2001, A&A, 370, 909
- (47) Johnson, H.L. 1966, ARA&A, 4, 193
- (48) Kato, D. & Nagata T., 2003, GCN, 1830
- (49) Kinney, A.L., Calzetti, D., Bohlin, R.C., et al. 1996, ApJ 467, 38
- (50) Klebesadel, R., Strong, I., & Olsen, R. 1973, ApJ, 182, L85
- (51) Klose, S., Henden, A.A., Greiner, J., et al. 2003, ApJ, 592, 1025
- (52) Kobayashi, N., Goto, M., Terada, H., & Tokunaga, A.T. 2000, GCN, 577
- (53) Kulkarni, S.R., Djorgovski, S.G., Odewahn, S.C., et al. 1999, Nature, 398, 389
- (54) Lamb, D.Q., & Reichart, D.E. 2000, ApJ, 536, 1
- (55) Lamb, D.Q., Ricker, G.R., Atteia, J.-L., et al. 2004, NewAstRev, Vol.48, Issue 5-6, 423
- (56) Landolt, A.U. 1992, AJ, 104, 340
- (57) Larkin, J., Ghez, A., Kulkarni, S.R., et al. 1998, GCN, 51
- (58) Lazzati, D., Covino, S., & Ghisellini, G. 2002, MNRAS, 330, 583
- (59) le Floc’h, E., Duc ,P-A., Mirabel, I.F., et al. 2003, A&A, 400, 499
- (60) Malesani, D., Tagliaferri, G., Chincarini, G., et al. 2004, ApJL accepted, astro-ph/0405449
- (61) Mannucci, F., Basile, F., Poggianti, B.M., et al. 2001, MNRAS, 326, 745
- (62) Mannucci, F., Masetti, N., Pian, E., et al. 2002, GCN, 1309
- (63) Maraston C., 1998, MNRAS, 300, 872
- (64) Masetti, N., Palazzi, E., Pian, E., et al. 2001, A&A, 374, 382
- (65) Masetti, N., Palazzi, E., Pian, E., et al. 2003, A&A, 404, L465.
- (66) Metzger, M.R., Djorgovski, S.G., Kulkarni, et al. 1997, Nature, 387, 879
- (67) Mirabal, N., & Halpern, J.P. 2003, GCN, 2273
- (68) Nishiyama, S., Baba, D., Nagata, T., 2003, GCN, 2195
- (69) Pallavicini, R., Golub, L., Rosner, R., et al. 1981, ApJ, 248, 279
- (70) Pickles, A.J. 1998, PASP, 110, 863
- (71) Piro, L., Frail, D.A., Gorosabel, J., et al. 2002, ApJ, 577, 680
- (72) Price, P.A., Berger, E., Reichart, D.E., et al. 2002, ApJ, 572, L51
- (73) Prochaska, J.X., Bloom J.S., Chen, H-W., et al. 2004, ApJ accepted, astro-ph/0402085
- (74) Ramaprakash, A. N., Kulkarni, S.R., Frail, D.A., et al. 1998, Nature, 393, 43
- (75) Reichart, D.E., Lamb, D.Q., Metzger, M.R., et al. 1999, ApJ 517, 692
- (76) Rhoads, J.E. & Fruchter, A.S. 2001, ApJ, 546, 117
- (77) Schlegel, D.J., Finkbeiner D.P., & Davis, M. 1998, ApJ, 500, 525
- (78) Stanek, K. Z., Matheson, T., Garnavich, P. M. et al. 2003, ApJ, 591, L17
- (79) Taylor, G.B., Bloom, J.S., Frail, D.A., et al. 2000, ApJ, 537, L17
- (80) Torii, K. 2003, GCN ,2253
- (81) Uemura ,M., Ishioka, R., Kato, T. & Yamaoka, H. 2003, GCN, 2252
- (82) Valentini, G., Alleva, G., Brocato, E., & Palazzi, E. 2003, GCN, 2258
- (83) van Paradijs, J., Groot, P.J., Galama, T., et al. 1997, Nature, 386, 686
- (84) van Paradijs, J., Kouveliotou, C., & Wijers, R.A.M.J. 2000, ARA&A, 38, 379
- (85) Villasenor, J., Butler, N., Crew, G., et al. 2003, GCN, 2261
- (86) Vreeswijk, P.M., Ellison, S.L., Ledoux, C., et al. 2004, A&A accepted, astro-ph/0403080
- (87) Vreeswijk, P.M., Rol, E., Kouveliotou, C., et al. 1999, GCN, 492
- (88) Zeh, A., Klose, S., & Hartmann, D.H. 2004, ApJ, 609, 952