TeV -radiation from Dark Matter annihilation in the Galactic center
Abstract
Recent observations of the Galactic center with ground based gamma-ray instruments (CANGAROO-II, VERITAS, H.E.S.S.) have revealed a TeV (1012 eV) gamma-ray signal consistent with the position of Sgr A*. The derived luminosity of the signal above 1 TeV is a few which is slightly more than e.g. the gamma-ray luminosity of the Crab nebula and a plausible identification could be a conventional albeit strong gamma-ray source. The observations with the H.E.S.S. system of Cherenkov telescopes have decreased the solid angle subtended by the error box by more than a factor of hundred with respect to the previous observations of the VERITAS and CANGAROO groups. After studying the observed energy spectrum and angular distribution of the excess as seen by the H.E.S.S. experiment, a massive Dark Matter candidate with a minimum mass of 12 TeV(90 % c.l.) and an upper limit on the WIMP density for pc of is required to explain the observed flux by an annihilation signal. The angular distribution of the excess events is consistent with a cuspy profile with with at a confidence level of 90 %. Even though the mass and the cross section of the Dark Matter constituents are unexpectedly high in the framework of most models of nonbaryonic Dark Matter, it can not be ruled out.
keywords:
PACS:
95.35.+d , 98.35.Jk , 98.35.Gi , 95.85.Pw , 96.40.Pq1 Introduction
The presence of a Dark Matter halo of the Galaxy is observationally established from stellar dynamics [1]. At present, the nature of Dark Matter is unfortunately unknown but a number of viable candidates have been advocated within different theoretical frameworks mainly motivated by particle physics (for recent reviews see e.g. [2, 3]) including the widely studied models of Supersymmetric (SuSy) Dark Matter [4]. On the cosmological scale, the presence of non-baryonic and predominantly cold Dark Matter as it had been suggested in [5] is well established by many observations most notably of the WMAP experiment [6].
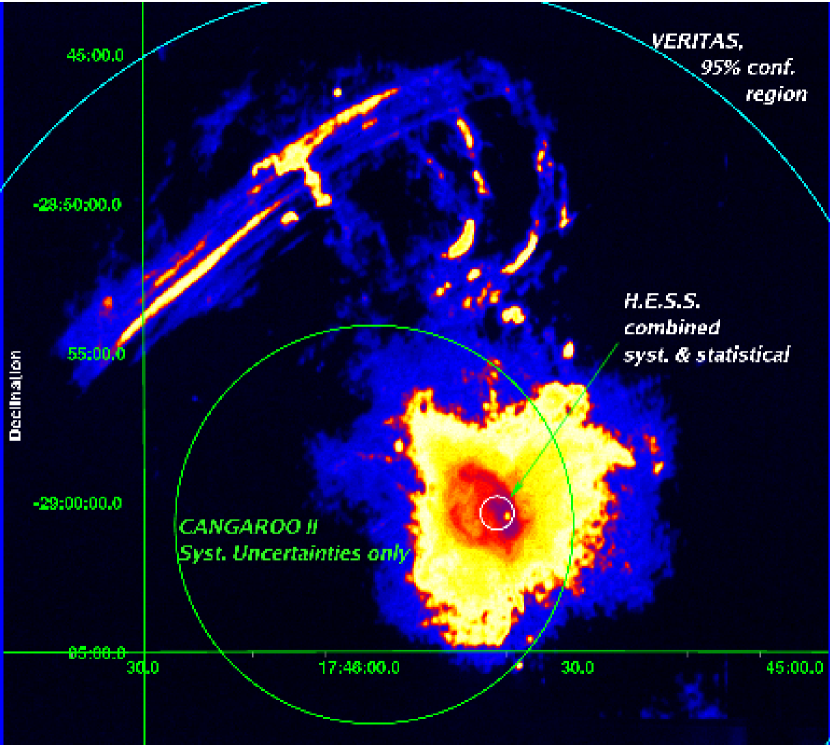
The implications of the possible presence of SuSy Dark Matter in the Galactic center has been studied in numerous publications including predictions for the -ray flux expected from annihilation of weakly interacting massive particles - WIMPs (see e.g. [7, 8, 9, 10, 11]). With the advent of the next generation of Cherenkov telescopes a gamma-ray signal from the direction of the Galactic center has been established: The recent claims for gamma-rays from the Galactic center by the CANGAROO collaboration with a signal [12] and a possible excess claimed by the VERITAS collaboration on the level of 3.7 [13] have already stimulated first speculations on the interpretation of the signal as annihilation radiation from Dark Matter [14]. Finally, the recently commissioned H.E.S.S. system of Cherenkov telescopes has detected a signal from the vicinity of Sgr A*[15]. The different confidence regions of the detections by the different instruments in comparison with a 21 cm radio map [16] are indicated in Fig. 1 and the flux measurements are given in Fig. 2. Note, the EGRET measurements taken from [17, 18] give the range of possible flux values for non-resolved objects in the gamma-ray background dominated region and should be interpreted as upper limits for a contribution of Sgr A*. The upper limit indicated in Fig. 2 at 1 GeV is from a dedicated analysis of the high energy EGRET data [19] assuming a photon index of 1.5.
At first glance, the differences in the reported TeV flux by the CANGAROO and H.E.S.S. groups might suggest variability at the lower end of the energy spectrum thus ruling out an exclusive annihilation origin and hinting at a more conventional compact gamma-ray source related to Sgr A*. However, given the positional uncertainty of the CANGAROO II and VERITAS results evident in Fig. 1, it remains possible that in fact more than one (possibly even variable) source may exist in the direction of the Galactic center. Interestingly, the observations of H.E.S.S. indicate the presence of even further sources in the field of view (see Fig. 1 of [15]).
Further observations with H.E.S.S. and CANGAROO III in the coming years will help to clarify the situation which might be consistent with multiple sources which are not resolvable by single telescope observations. Instrumentally, the CANGAROO and H.E.S.S. observations have shown discrepancies in the flux values for other steady sources: SN1006, PSR B1706-44, Vela, and RXJ1713-304 [20, 21, 22] - a similar situation might be present in this case.
The VERITAS energy flux given in Fig. 2 is converted from the 40 % Crab flux as measured with the Whipple telescope, assuming a photon index of 2.2, and using the Crab flux as determined by H.E.S.S. to compare the two instruments’ observations. The error bars are given as the sum of statistical and systematic uncertainties. The two measurements are in reasonable agreement and given the possible positive bias in the flux estimate for a source detected at the level of less than 4 standard deviations should be considered to be consistent within the uncertainties.
The discussion here is focussing on the results obtained with the H.E.S.S. system of telescopes which achieves a superior angular resolution in comparison to the previously published results as is evident from Fig. 1 111These data were taken during the build-up phase and will eventually be superseded by the performance of the full telescope array. The reconstructed source location is, within the errors, consistent with the position of Sgr A*(space angle ”) and appears to be consistent with a pointsource for the given angular resolution of ’ (50 % containment radius [15]).
The H.E.S.S. observations (spectrum and angular distribution) are interpreted in the framework of a Dark Matter annihilation scenario to investigate the consequences for the WIMP mass, density, and spatial structure and to understand whether such an interpretation is feasible.
2 WIMP mass
In order to quantify the minimum mass required to explain the observed energy spectrum in terms of an annihilation signal, an assumption on the shape of the annihilation continuum spectrum is required. In the very generic case of a self-annihilating massive WIMP, it is assumed that the branching ratio for , , and is quite large.
Subsequent hadronization leads to the production of charged and neutral mesons which decay finally into electrons, neutrinos, and gammas. The gamma signal is described by a fairly hard differential energy spectrum with an exponential cut-off with [7]. However, the exact shape of the spectrum depends on details of the branching ratio of other processes. Namely, for , direct radiative losses produce a second hard component.
For the purpose of calculating a lower limit on it is assumed that the branching ratio for or is close to one. The minimum mass requirement is somewhat relaxed if is of importance.
Fitting a generic decay spectrum to the data results in a 90 % c.l. lower limit on the mass to be larger than 12 TeV.
In most models that attempt to explain non-baryonic Dark Matter in the Universe, the relic particles are WIMPs produced thermally during the early phase of cosmological expansion. A very reasonable candidate for this particle is provided by SuSy models which naturally predict the existence of a stable (if R-parity is conserved) Majorana particle that can self-annihilate. Generically, this SuSy particle is referred to as the lightest stable particle (LSP).
The detection of gamma-rays with energies up to 10 TeV as seen with the H.E.S.S. telescopes implies that the WIMP mass has to be sufficienly large to explain the observed spectrum. The surprisingly large mass inferred from the observations appears at first glance to be inconsistent with cosmology and the general conception that the mass of LSP in SuSy models should be close to the electro-weak unification scale [23]. However, it has been argued that a multi-TeV WIMP is in fact natural in Minimal Supergravity models [24]. The upper bound on the possible mass of a WIMP that decoupled thermally during the early phase of expansion is around 40 TeV [25] for a cosmological non-baryonic Dark Matter density of .
The average annihilation cross section for SuSy WIMPs is in the right range to explain today’s Dark Matter density as determined by the WMAP mission: [6]. However, given that for the thermal decoupling and that , rather tight constraints on the mass of the WIMP GeV can be derived [26]. However, as already pointed out in [26] there are specific manifestations of SuSy models (even in the constrained, universal models) that allow for larger WIMP masses which still produce the right relic density:
-
1.
For specific SuSy models in which the LSP is almost degenerate in mass with other SuSy particle (e.g. ) coannihilation depletes the relic density even for a small annihilation cross section.
-
2.
For a non-thermal decoupling process, the relic density as it is today is not depending on the cross section.
-
3.
Relaxing the universality of the Higgs multiplett masses at the GUT scale: In this (and in the general SuSy) case, it is conceivable that a massive (multi-TeV) WIMP with the right relic density may exist. Thess WIMPs are generally almost pure Higgsino type Neutralinos with a large cross section.
In the first case, the cross section for annihilation remains small and therefore requires high relic density values in the Galactic center to explain the observed -ray flux. In the special case of a degeneracy between the LSP and other SuSy particles, careful tuning is required to achieve the right relic density. For a massive LSP beyond a few TeV, even co-annihilation does not suffice to reduce the relic density. A non-thermal scenario invoking Q-balls [27] which replenish the Dark Matter content via evaporation at some time after the decoupling has been studied in the literature [28, 29]. In this and other non-thermal scenarios the cross section for WIMPs could be rather high.
The last case is more attractive but again requires tuning of the Gaugino masses at the unification scale which might appear less attractive from the point of view of a natural theory.
Generally, a massive WIMP as suggested by the observations with a sufficiently high cross section is not the obvious candidate in the framework of MSUGRA but could be the LSP in slightly less general theories. In this way, thermal decoupling would produce the right relic density and the observed flux could be consistent with a Dark Matter density which is not violating other astrophysical bounds.
Ultimately, a neutralino mass exceeding 40 TeV is excluded by the unitarity bound in the framework of thermal decoupling [25].
3 WIMP density
Given the measured flux, it is possible (without assuming a specific halo
shape) to derive an upper limit on the product This is truly an upper limit, as can be seen
from the following argument:
Assuming that the true density distribution is
spherically symmetric and follows a general form [7]
| (1) |
The halo density profiles predicted from N-body simulations of hierarchical structure formation follow a power law roughly between [30] and [31]. The annihilation flux observed from within the Galaxy is proportional to the line of sight integral
| (2) |
averaged over the solid angle observed:
| (3) |
with the commonly used normalization for the Galactic Center:
| (4) |
For reasons of simplification and in order to calculate an upper limit, it is convenient to use a truncated version of Eq. 1 which drops to zero outside a spherical volume with radius . Obviously, the derived density to match an observed flux would be higher than in the case of a continuous halo distribution. For a truncated density function with much smaller than the distance of the observer to the sun, the line of sight integral can be safely replaced by a volume integral and the observed differential gamma-ray flux is given by:
| (5) | |||||
Considering a truncated density function which follows a single power law up to a radius dropping to zero for larger radii: with .
| (6) | |||||
and for :
| (7) | |||||
which gives for the ratio :
| (8) |
This ratio is for . For the trivial case of a constant density and is recovered. For which implies for a given flux (, see Eq. 5) a lower average density than in the case of a constant WIMP density222For the sake of brevity, this is only shown for , but it holds true for any .. Therefore, calculating an average density with from the observed flux sets an upper limit on the actual average density for a realistic radial density distribution.
For convenience, Eq. 5 can be rewritten with appropriate units:
| (9) |
In the more general case of a radial density profile extending beyond , the line-of-sight integral of Eq. 3 will naturally give larger observed fluxes () than for a truncated density therefore relaxing the requirement of the average central density even more. In this sense, the approach of calculating an average, truncated density is truly an upper limit on the average density as expected for a realistic, smooth Dark Matter halo distribution.
The parameterization for the decay spectrum is of course depending on the nature of the WIMP and cannot be given in general. For the case of a very massive WIMP considered here, the dominant annihilation channel is into a , , and pairs. A parameterization of the form
| (10) |
is a reasonable description of the decay spectrum (with and in TeV, ).
In order to calculate the upper limit on it is assumed that the entire observed flux is produced by annihilation of WIMPs. The H.E.S.S. data-points are taken from [15] with the assumed emission region being covered by the point-spread function of ’. The actual limit on the source size is only 3’. However, this assumes a Gaussian surface emission profile, whereas a volume source with constant emissivity is expected. The upper limit on such an emission profile will be somewhat bigger than 3’ but smaller than the point spread function. The upper limit depends on the assumed emission region as .
The H.E.S.S. data points (open triangles) are indicated in Fig. 2 together with the CANGAROO (open boxes), VERITAS (open diamond), and different EGRET flux values (open symbols from [17], filled symbols from [18], and upper limit from [19]). A best fit model of the H.E.S.S. data requires
with .
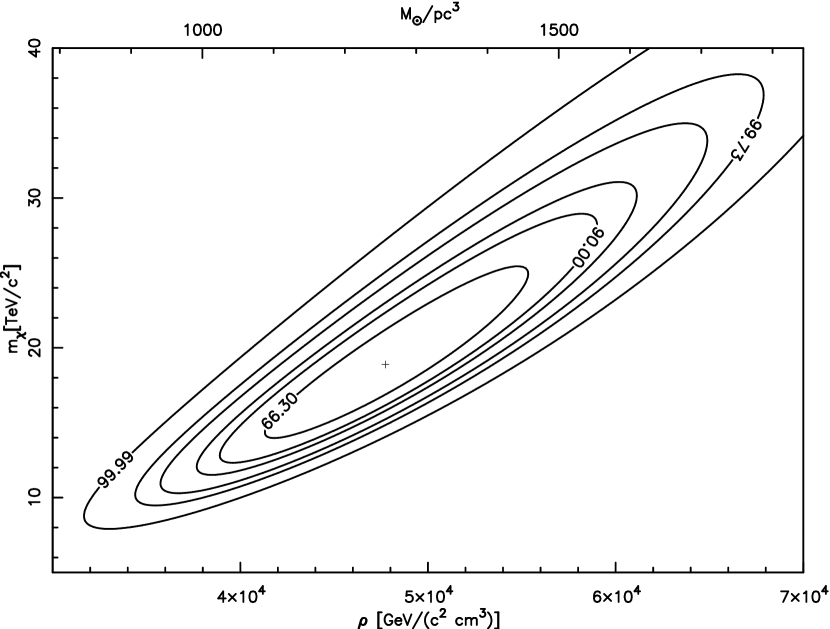
The confidence regions given by the minimization for the two parameters and is given in Fig. 3. The best fit position is indicated by a small cross.
For the sake of completeness, a similar procedure can be applied to the CANGAROO data giving the following values:
with . The value given for the density is higher than calculated in [12] because of the factor of in Eqn. 5 that has been neglected in the past [32]. As pointed out in the Introduction, the CANGAROO-II result is not consistent with the H.E.S.S. observations hinting at either a mismatch in the cross-calibration of the two instruments or a variable object which might coincide with one of the more conventional gamma-ray sources close to the Galactic center.
The required average density depends on the cuspiness of the halo profile and scales according to Eqn. 9 with (for ) and is reduced by a factor of 2 with respect to a constant density halo distribution when .

4 Spatial WIMP distribution
Given the excellent angular resolution of the H.E.S.S. telescope arrays of 5.8’ for individual events [15], spatial extension of the source down to this level can be probed. The signal appears to be point-like (i.e. of spatial extension smaller than the point spread function) with an upper limit of 3’ for a source with a Gaussian surface brightness profile.
The expected source extension from Dark Matter annihilation depends crucially on the shape of the radial density profile. For a quantitative study, a simplification of the radial density profile given in Eqn. 1 is applied:
| (11) | |||||
| (12) |
Since the observations cover only the inner 0.5∘ of the Galactic center (equivalent to 75 pc), the actual value of is not crucial.
The observed surface brightness is calculated by folding (Eqn. 2) with the average point spread function of H.E.S.S. for the observations approximated by a double Gaussian
| (13) |
with , (J. Hinton, priv. communication), and as an arbitrary normalization:
| (14) |
with chosen such that . The resulting angular distribution is shown in Fig. 4 for different values of . Using the values for various , a 90 % c.l. (one sided) for is calculated which is suggestive of a halo with a halo steeper than predicted by Navarro, Frenk, and White [30].

5 Discussion
TeV gamma-ray emission from the Galactic center has been observed by different different ground-based instruments. The CANGAROO group claims a signal at a significance close to 10 and the VERITAS group sees a indications for a signal observed in archival data. Finally, the H.E.S.S. system reported an overall excess of 11.8 from the Galactic center region from observations during the build-up phase.
However, taking the H.E.S.S. data alone, no indication for variability is seen and moreover, the source location is consistent with the position of Sgr A*(” with a systematic error of ”) and an upper limit for a Gaussian surface density source of ’.
Taking these results, a hypothetical Dark Matter annihilation scenario is discussed. The observed energy spectrum is reasonably well described by the continuum emission from SuSy WIMPS (neutralinos) with a mass of 18 TeV (lower limit of 12 TeV) putting it far out of reach for future accelerator experiments.
The required average Dark Matter density is (for and ) for the inner 10 pc of the Galaxy with a cuspy profile with in order to fit the observed angular distribution. The upper limit on nonbaryonic Dark Matter density is close to the stellar (baryonic) mass density which is [33]. The total inferred mass is well below the stellar mass of in the inner 10 pc. The rather high central values of the density is consistent with the formation of a mini-cusp as a consequence of interaction with the central dense stellar environment [34, 35] and baryonic compression [36].
The synchrotron emission emitted by the electrons/positrons injected through the annihilation process constrains the maximum slope of the radial density distribution [37, 38] which rules out a spike close to the black hole [39]. The constraint is further relaxed if fast diffusion or convection removes the electrons/positrons from the vicinity of the black hole.
The angular resolution in gamma-rays achieved with H.E.S.S. allows to probe the actual shape of the Dark Matter profile for the Galactic center. With more data taken with the full telescope array operational, a further improvement on the constraint on the cuspiness is expected and test the different possibilities for the origin of the signal.
At this point, the considered annihilation scenario of WIMPS as the origin of the observed flux of gamma-rays is not ruled out. The other detectable channels of annihilation i.e. excess of positrons and anti-protons in Cosmic-rays are not affected by a mini-cusp scenario as outlined above. The large mass of the WIMP may also produce a signal for neutrino-telescopes but the sensitivity of the current instruments is not sufficient to detect neutrinos from the Galactic center [40]. In principle, bounds from big-bang nucleosynthesis could be of importance but as outlined in [41], a very massive WIMP would not have a strong impact on abundances of light elements. Future observations of variability in the gamma-ray flux or a possible extension would be of great importance for the interpretation of the signal.
The author is grateful for discussions with F. Aharonian, J. Buckley, A. Jacholkowska, J. Primack, P. Ullio, H.J. Völk, and members of the H.E.S.S. working group on Dark Matter.
References
- [1] A. Klypin, H. Zhao, R. S. Somerville, Astrophys. J. 573 (2002) 597
- [2] L. Bergström, Reports of Progress in Physics 63 (2000) 793
- [3] G. Bertone, D. Hooper, J. Silk, hep-ph/0404175
- [4] J. Ellis, J. S. Hagelin, D. V. Nanopoulos, K. Olive, M. Srednicki, Nuclear Physics B 238 (1984) 453
- [5] G. R. Blumenthal, S. M. Faber, J. R. Primack, M. J. Rees, Nature 311 (1984) 517
- [6] D. N. Spergel et al., Astrophys. J 148 (2003) 175
- [7] L. Bergström, P. Ullio, J. H. Buckley Astroparticle Physics 9 (1998) 137
- [8] F. Stoehr, S. D. M. White, V. Springel, G. Tormen, N. Yoshida, Mon. Not. R. Astron. Soc. 345 (2003) 1313
- [9] D. Hooper, L. Wang, Phys. Rev. D 69 (2004) 035001
- [10] S. M. Koushiappas, A. R. Zentner, T. P. Walker, Phys. Rev. D 69 (2004) 043501
- [11] N. W. Evans, F. Ferrer,S. Sarkar, Phys. Rev. D 69 (2004) 123501
- [12] K. Tsuchiya et al. Astrophys. J. 606 (2004) L115
- [13] K. Kosack et al. Astrophys. J. 608 (2004) L97
- [14] D. Hooper, I. d. C. Perez, J. Silk, F. Ferrer, S. Sarkar, astro-ph/0404205
- [15] F.A. Aharonian et al. astro-ph/0408145
- [16] F. Yusef-Zadeh, IAU Symp. 136: The Center of the Galaxy, 136 (1989) 243
- [17] H. A. Mayer-Hasselwander et al., A&A 335 (1998) 161
- [18] R. C. Hartman et al., Astrophys. J. Suppl. Ser. 123 (1999) 79
- [19] D. Hooper, B.L. Dingus astro-ph/0210617
- [20] M. Mori in Procs. of 28th ICRC (2003), Vol. 5, ed. T. Kajita, Y. Asaka, A. Kawachi, Y. Matsubara, and M. Sasaki (Tokyo: Universal Academy Press)
- [21] N. Komin et al. (2004) in F.A. Aharonian & H.J. Völk (eds.) AIP Conference Series in press
- [22] D. Berge et al. (2004) in F.A. Aharonian & H.J. Völk (eds.) AIP Conference Series in press
- [23] E. Witten, Nuclear Physics B 188 (1981) 513
- [24] J. L. Feng, K. T. Matchev, T. Moroi, Phys. Rev. Lett. 84 (2000) 2322
- [25] K. Griest, M. Kamionkowski, Phys. Rev. Lett. 64 (1990) 615
- [26] J. Ellis, K. A. Olive, Y. Santoso, V. C. Spanos, Phys. Lett. B 565 (2003) 176
- [27] S. Coleman, Nucl. Phys. B 262 (1985) 263
- [28] K. Enqvist, J. McDonald, Nucl. Phys. B 538 (1999) 321
- [29] M. Fujii, K. Hamaguchi, Phys. Rev. D 66 (2002) 083501
- [30] J. F. Navarro, C. S. Frenk, S. D. M. White, Astrophys. J. 490 (1997) 493
- [31] B. Moore, S. Ghigna, F. Governato, G. Lake, T. Quinn, J. Stadel, P. Tozzi, Astrophys. J. 524 (1999) L19
- [32] P. Gondolo, J. Edsjo, P. Ullio, L. Bergström, M. Schelke, E. A. Baltz, JCAP 07 (2004) 008 [arXiv:astro-ph/0406204].
- [33] R. Genzel et al., Astrophys. J. 595 2003 812
- [34] O.Y. Gnedin, J.R. Primack, astro-ph/0308385
- [35] D. Merritt, Phys. Rev. Lett. 92 (2004) 201304
- [36] F. Prada et al., astro-ph/0401512
- [37] P. Gondolo, Phys. Lett. B 494 (2000) 181
- [38] R. Aloisio, P. Blasi, & A.V. Olinto, JCAP 05 (2004) 007
- [39] P. Gondolo, J. Silk, Phys. Rev. Lett. 83 (1999) 1719
- [40] G. Bertone,E. Nezri,J. Orloff, J. Silk, astro-ph/0403322
- [41] K. Jedamzik, astro-ph/0405583