Hard X-ray view of the past activity of Sgr A⋆ in a natural Compton mirror
We report the association of the recently discovered hard X-ray source IGR J174752822 with the giant molecular cloud Sgr B2 in the Galactic Center region. The broad band (3–200 keV) spectrum of the source constructed from data of different observatories strongly supports the idea that the X-ray emission of Sgr B2 is Compton scattered and reprocessed radiation emitted in the past by the Sgr A⋆ source. We conclude that 300–400 years ago Sgr A⋆ was a low luminosity ( erg s-1 at 2–200 keV) AGN with a characteristic hard X-ray spectrum (photon index ). We estimate the mass and iron abundance of the Sgr B2 scattering gas at and 1.9 solar, respectively (where is the radius of the cloud).
Key Words.:
Galaxy: center – ISM: clouds: individual: Sgr B2 – X-rays: ISM1 Introduction
Our Galactic Center (GC) harbors a black hole (BH) with a mass of (e.g. Schödel et al. 2003). It has remained puzzling why the source Sgr A⋆ associated with the BH is faint despite the presence of significant amounts of ambient gas capable of fuelling it (Melia & Falcke 2001; Baganoff et al. 2003).
Among many complex structures near the GC, X-ray telescopes have detected 8–20 keV continuum (Sunyaev, Markevitch & Pavlinsky 1993; Markevitch, Sunyaev & Pavlinsky 1993) and 6.4 keV line diffuse emission (Koyama et al. 1996; Murakami et al. 2000; Sidoli et al. 2001; Murakami, Koyama & Maeda 2001) associated with giant molecular clouds, in particular Sgr B2 located at a projected distance of 100 pc from Sgr A⋆. That was suggested to be radiation emitted in the past by Sgr A⋆, Compton scattered and reprocessed by the cloud neutral gas and delayed by the light travel time (Sunyaev, Markevitch & Pavlinsky 1993; Koyama et al. 1996).
The scattered emission is strongly photoabsorbed within the Sgr B2 cloud at energies below 5–10 keV. However, since the efficiency of photoabsorption rapidly declines with energy, one could expect Sgr B2 to be a strong X-ray source at energies above 15 keV. We show below that such a hard X-ray source has now been observed with the INTEGRAL observatory.
2 Observations and results
The INTEGRAL satellite (Winkler et al. 2003) expands the frontiers of X-ray and gamma-ray imaging. The several-fold increased effective area of the telescope IBIS (Ubertini et al. 2003) compared to the previous space-borne hard X-ray imager GRANAT/SIGMA, opens up a possibility to study hard X-ray sources located in crowded regions of the sky, at flux levels (above 20 keV) down to 1 mCrab (Revnivtsev et al. 2004a).
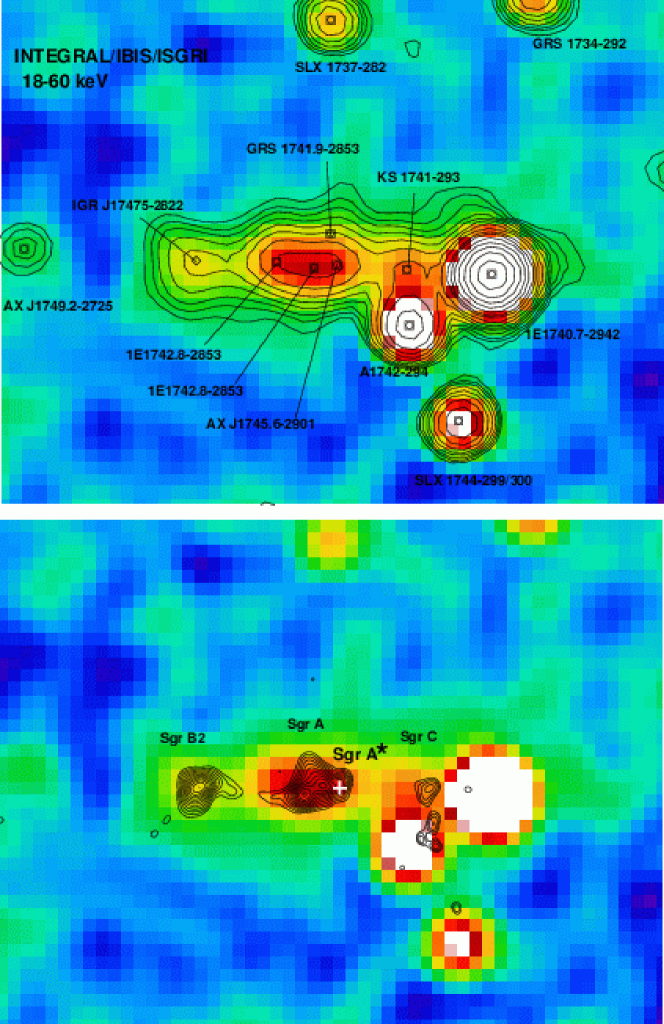
During the period 2003–2004 INTEGRAL extensively observed the central area of the Galaxy (Revnivtsev et al. 2004a). Figure 1 shows a hard X-ray image of the innermost region obtained from observations with a total effective exposure of 2.3 Ms. Thanks to the good angular resolution () of IBIS, practically all bright sources in this area are resolved, most of them being known low-mass X-ray binaries. The newly discovered source IGR J174752822 (Revnivtsev et al. 2004a) is coincident with the Sgr B2 molecular cloud. Since the X-ray flux below 10 keV collected from the IBIS PSF centered on IGR J174752822 is completely dominated by diffuse emission of Sgr B2 (Sidoli et al. 2001; Murakami, Koyama & Maeda 2001), we can safely associate IGR J174752822 with this diffuse component. The observed flux in the 20–200 keV band is mCrab, or erg s-1, which corresponds to a luminosity of erg s-1 at a distance of 8.5 kpc. To our knowledge, this is the first ever detection of X-ray emission above 20 keV from any molecular cloud.
We constructed a broad band spectrum of the source (Fig. 2) by combining data of GRANAT, ASCA and INTEGRAL. The ASCA/GIS spectrum was collected from a -radius region centered on IGR J174752822 using data of observations carried out in 1993–1994. The GRANAT/ART-P spectral point was obtained from observations in 1991–1993 (Pavlinsky, Grebenev & Sunyaev 1994). Note that the different effective beam sizes of the instruments (5′ for GRANAT/ART-P and 12′ for INTEGRAL/IBIS) can affect the obtained spectrum. This effect should however be small given the limited size (3–5′) of the Sgr B2 cloud in X-rays.
3 Discussion
3.1 X-ray reflection nebula model
The 2–10 keV flux from Sgr B2 is dominated by diffuse emission in a line at 6.4 keV superposed on strongly absorbed continuum emission (Koyama et al. 1996). A number of smaller molecular clouds in the GC region also exhibit powerful 6.4 keV line emission, although with low absolute fluxes compared to Sgr B2 (Bamba et al. 2002; Predehl et al. 2003; Park et al. 2004). Common for all of these sources is the huge (1–2 keV) equivalent width of the 6.4 keV line.
According to an early prediction (Sunyaev, Markevitch & Pavlinsky 1993), X-ray activity of Sgr A⋆ in the recent past should lead just to such observational consequences, i.e. to the appearance of scattered X-ray radiation, strongly photoabsorbed at low energies, and of a powerful fluorescent iron Kα line. The X-ray echo from Sgr B2 should be delayed by 300–400 years relative to the direct signal from Sgr A⋆ due to the light travel time from Sgr A⋆ to Sgr B2. The equivalent width of the Kα line is so large because we do not see the primary source itself. The fact that INTEGRAL sees X-ray emission above 20 keV from the zone of 6.4 keV emission in Sgr B2 (see Figure 1) provides strong support to this scenario. Unfortunately, the angular resolution of IBIS is not sufficient to study the diffuse emission of the other GC molecular clouds due to the presence of a large number of strong point sources.

Our spectral analysis further supports the Sgr A⋆ scenario. As shown in Fig. 2, the spectral energy distribution of Sgr B2 measured with INTEGRAL at 20–200 keV matches the 3–20 keV spectrum measured with ASCA and GRANAT/ART-P. The combined spectrum at 3–200 keV can be well fit by a model in which X-rays from Sgr A⋆ are scattered and reprocessed in a homogeneous spherical cloud of cold gas. Scattering of the hard X-rays occurs on the neutral molecular hydrogen and helium (Sunyaev & Churazov 1996) while the abundance of iron determines the intensity of the fluorescent Kα line.
The spectrum emerging from Sgr B2 depends on several parameters: the slope () of the incident spectrum (assumed to be a power law), the cloud radial optical depth to Thomson scattering [, where is the number density of hydrogen molecules and is the cloud radius], the iron abundance relative to solar (), the scattering angle () for photons travelling from Sgr A⋆ to Sgr B2 and then to us, and the ISM column density toward Sgr B2 (). Using Monte Carlo simulations of the radiative transfer in the gas cloud, we find the following best-fit values: , , , , and cm-2 (given are 1 statistical errors). The uncertainties associated with the gas density distribution in Sgr B2 and with the cross-calibration of the instruments can lead to additional 30% systematic uncertainties on the values of and , while our estimates of the iron abundance and spectral slope are more robust. The best-fit model is shown in Fig. 2.
Based on the measured optical depth we can estimate the mass of the scattering gas in Sgr B2 as .
In the above model the high-energy rollover tentatively seen in the INTEGRAL spectrum is explained by the Compton recoil of hard X-ray photons in the cloud and is very sensitive to . Allowing for the possibility of an intrinsic cutoff in the illuminating spectrum, we are able to place an upper limit of on the mutual position of Sgr A⋆ and the Sgr B2 cloud.
Using the measured X-ray flux from Sgr B2 and best-fit spectral parameters, we find that the luminosity of Sgr A⋆ in the 2–10 keV and 2–200 keV band was 0.5 and 1.5 erg s, respectively, where is the distance between Sgr A⋆ and Sgr B2.
3.2 Alternative scenarios
Alternative explainations of the X-ray emission of Sgr B2 meet severe difficulties. Instead of attributing the primary emission to Sgr A⋆ one could hypothesize that a transient source inside the Sgr B2 cloud was irradiating the molecular gas. The large equivalent width of the 6.4 keV line implies that we are seeing pure reprocessed emission but not the primary source. The source therefore should have faded away before the ASCA observations of 1993, i.e. more than 10 years ago. Since the light crossing time of the Sgr B2 cloud is years, one would expect to see a decline of the 6.4 keV line flux by a factor of 2 from 1993 till now (Sunyaev & Churazov 1998).
Using archival data of ASCA, BeppoSAX, Chandra and XMM observatories we find no significant variability of the line flux during the period 1993–2001 (see Figure 3) in contradiction with the internal source hypothesis. For each X-ray telescope, we extracted the 6.4 keV line flux from the same radius circular region centered at the peak (R.A.=266.830126, Dec.=28.386593) of the Chandra image in the 6.4 keV line. The background emission (instrumental plus diffuse sky background unrelated to Sgr B2) was similarly estimated for all the instruments in a -radius region around R.A=266.874812, Dec.=28.501369. The data were reduced using standard utilities recommended by the Guest Observer Facilities.
INTEGRAL observations similarly indicate that the continuum 18–60 keV flux was constant within 25% during 2003–2004. For the Sgr A⋆ model, the constancy of the line flux merely means that the luminosity of Sgr A⋆ remained approximately constant for more than 10 years a few hundred years ago, while the fact that other molecular clouds in the GC region also shine in the 6.4 keV line indicates that the entire period of activity lasted much longer than 10 years. The possibility that the GC molecular clouds have been irradiated by external transient sources such as X-ray binaries has been ruled out before (Sunyaev & Churazov 1998; Murakami, Koyama & Maeda 2001).

The diffuse emission from the Sgr B2 cloud being a superposition of a large number of weak point sources inside the cloud is very unlikely. First of all, the cumulative emission of X-ray sources (mostly young, low mass stars) in nearby, well-studied molecular clouds such as Orion and Oph is substantially softer (Revnivtsev et al. 2004b) than that of Sgr B2 and does not exhibit a strong intrinsic 6.4 keV emission line (Feigelson et al. 2002; Imanishi, Koyama & Tsuboi 2001). The observed huge equivalent width of the 6.4 keV line cannot then be explained by reprocessing of the point sources’ emission by the molecular gas. An even stronger constraint comes from the fact that several GC molecular clouds with hydrogen column densities ranging between and cm-2 (Bamba et al. 2002; Park et al. 2004) all exhibit a similar equivalent width of the 6.4 keV line. We briefly note that for reflecting clouds with a small optical depth, the absorption edge above 7.1 keV (Predehl et al. 2003) need not be strong even if the 6.4 keV line equivalent width is large.
The bombardment of molecular gas by low energy cosmic ray electrons was put forward (Valinia et al. 2000; Yusef-Zadeh, Law & Wardle 2002) to explain the 6.4 keV emission. The electrons produce inner-shell ionizations of iron atoms, leading to 6.4 keV line emission, and simultaneously generate bremsstrahlung radiation. In this model, the lack of a strong cutoff below 200 keV in the spectrum of Sgr B2 implies that electrons with energies higher than a few hundred keV should be present, while the slope of the observed spectrum () constrains the distribution of electrons in energy. Given these observational constraints, we can estimate in the thick target approximation that only (1–3) of the cosmic ray electrons’ energy can go into hard X-ray radiation around 50 keV. Thus, to produce the observed luminosity at 50 keV of erg s-1 at least (1–3) erg s-1 of energy in cosmic ray electrons ought to be dumped into the cloud. This power is comparable to the bolometric (mostly infrared) luminosity of Sgr B2 (Gordon et al. 1993) which is thought to be mostly due to hot stars. Since Sgr B2 with its dust is an almost perfect calorimeter, no room is left for additional energy in nonthermal, low energy cosmic ray protons. Furthemore, the equivalent width of the 6.4 keV line (with respect to the bremsstrahlung continuum) is predicted to be 250–350 eV for solar abundance of iron. Therefore, the observed 2 keV equivalent width requires a factor of 5–6 overabundance of iron in Sgr B2.
Production of a 6.4 keV line by cosmic ray ions rather than electrons (Dogiel et al. 1998; Tatischeff, Ramaty & Kozlovsky 1998) requires similar high energetics and strong overabundance of iron. In addition, heavy ions (e.g. oxygen) should produce multiple ionizations of iron atoms leading to a blue shift of the 6.4 keV line, which is not observed. Charge exchange reactions of nonthermal iron ions with the ambient H2 and He should produce a broad hump at 6.7 keV, which is not observed in Sgr B2 either. The cosmic rays model thus encounters very serious problems.
4 Conclusion
We thus come to the conclusion that the Sgr B2 cloud is sending us an X-ray echo of violent activity of the GC supermassive BH some 300 years ago, which lasted at least 10 years. The luminosity of Sgr A⋆ at that time was 5 erg s-1 in the 2–10 keV band, i.e. a few times higher than it is now (Baganoff et al. 2003). The 2–200 keV luminosity was 1.5 erg s-1. Sgr A⋆ was therefore similar to low luminosity active galactic nuclei (LLAGN) rather than to more powerful Seyfert galaxies. LLAGN emit most of their energy in the near infrared (Ho 1999) and we can estimate that the bolometric luminosity of Sgr A⋆ was erg s-1. This is still only of the critical Eddington luminosity of the central BH. Thanks to INTEGRAL, we now know that Sgr A⋆ had a power-law spectrum with a photon index of 1.8, without a significant cutoff up to 100 keV. This spectrum is remarkably similar to the few directly measured hard X-ary spectra of LLAGN (Pellegrini et al. 2000a, b).
It is actually not surprising that our GC was so active in the recent past, as AGN with luminosities higher than erg s-1 (2–10 keV) are found in 50% of galaxies morphologically similar (of type Sb) to the Milky Way (Ho, Filippenko & Sargent 1997; Ho et al. 2001). There is a significant probability that Sgr A⋆ will become bright again in the foreseeable future. That would provide the much needed information about the duty cycle of activity in galactic nuclei.
Future instruments will be able to further test the Sgr A⋆ irradiation model. In particular ASTRO-E2 will probe the Compton shoulder with a peculiar spectrum on the low-energy side of the 6.4 keV line, caused by down-scattering of the line photons on the molecular hydrogen and helium atoms (Sunyaev & Churazov 1996; Vainshtein, Sunyaev & Churazov 1998; Sunyaev, Uskov & Churazov 1999). The relative strength of the shoulder should be proportional to the optical depth of individual molecular clouds. In addition, the Compton scattered X-ray continuum should be more than 50% polarized in contrast to the fluorescent line (Churazov, Sunyaev & Sazonov 2002), and future X-ray polarimeters will be able to determine the scattering angle and hence the location of Sgr B2 on the line of sight. Polarization mapping of the GC molecular clouds would yield a full 3D geometry of the region.
Acknowledgements.
This work is based on observations belonging to the Russian share (proposal IDs 120213 and 0220133) in the observing time of INTEGRAL, an ESA project with instruments and science data center funded by ESA member states (especially the PI countries: Denmark, France, Germany, Italy, Switzerland, Spain), Czech Republic and Poland, and with the participation of Russia and the USA. We thank Kevin Hurley for sharing with us his INTEGRAL TOO observations. This research has made use of data obtained through the High Energy Astrophysics Science Archive Research Center Online Service, provided by the NASA/Goddard Space Flight Center.References
- Baganoff et al. (2003) Baganoff, F.K., Maeda, Y., Morris, M., et al. 2003, ApJ, 591, 891
- Bamba et al. (2002) Bamba, A., Murakami, H., Senda, A., et al. 2002, in New Visions of the X-ray Universe in the XMM-Newton and Chandra Era (ed. F. Jensen), Noordwijk: ESTEC
- Churazov, Sunyaev & Sazonov (2002) Churazov, E., Sunyaev, R., & Sazonov, S. 2002, MNRAS, 330, 817
- Dogiel et al. (1998) Dogiel, V.A., Ichimura, A., Inoue, H., & Masai, K. 1998, PASJ, 50, 567
- Gordon et al. (1993) Gordon, M.A., Berkermann, U., Mezger, P.G., et al. 1993, A&A, 280, 208
- Feigelson et al. (2002) Feigelson, E.D., Broos, P., Gaffney, J.A., et al. 2002, ApJ, 574, 258
- Ho, Filippenko & Sargent (1997) Ho, L.C., Filippenko, A.V., & Sargent, W.L.W. 1997, ApJ, 487, 568
- Ho (1999) Ho, L.C. 1999, ApJ, 516, 672
- Ho et al. (2001) Ho, L.C., Feigelson, E.D., Townsley, L.K., et al. 2001, ApJ, 549, 51L
- Imanishi, Koyama & Tsuboi (2001) Imanishi, K., Koyama, K., & Tsuboi, Y. 2001, ApJ, 557, 747
- Koyama et al. (1996) Koyama, K., Maeda, Y., Sonobe, T., et al. 1996, PASJ, 48, 249
- Markevitch, Sunyaev & Pavlinsky (1993) Markevitch M., Sunyaev, R.A., & Pavlinsky, M. 1993, Nature, 364, 40
- Melia & Falcke (2001) Melia F. & Falcke H. 2001, ARA&A, 39, 309
- Murakami et al. (2000) Murakami, H., Koyama, K., Sakano, M., et al. 2000, ApJ, 534, 283
- Murakami, Koyama & Maeda (2001) Murakami, H., Koyama, K., & Maeda, Y. 2001, ApJ, 558, 687
- Park et al. (2004) Park, S., Muno, M.P., Baganoff, F.K., et al. 2004, ApJ, 603, 548
- Pavlinsky, Grebenev & Sunyaev (1994) Pavlinsky, M., Grebenev, S., & Sunyaev, R. 1994, ApJ, 425, 110
- Pellegrini et al. (2000a) Pellegrini, S., Cappi M., Bassani, L., et al. 2000, A&A, 353, 447
- Pellegrini et al. (2000b) Pellegrini, S., Cappi, M., Bassani, L., della Ceca, R., & Palumbo, G.G.C. 2000, A&A, 360, 878
- Predehl et al. (2003) Predehl, P., Costantini, E., Hasinger, G., & Tanaka, Y. 2003, Astronomische Nachrichten, 324, 73
- Revnivtsev et al. (2004a) Revnivtsev, M.G., Sunyaev, R.A., Varshalovich, D.A., et al. 2004a, Astr.Lett., 30, 382
- Revnivtsev et al. (2004b) Revnivtsev, M., Sazonov, S., Jahoda, K., & Gilfanov, M. 2004b, A&A, 418, 927
- Schödel et al. (2003) Schödel, R., Ott, T., Genzel, R., et al. 2003, ApJ, 596, 1015
- Sidoli et al. (2001) Sidoli, L., Mereghetti, S., Treves, A., et al. 2001, A&A, 372, 651
- Sunyaev & Churazov (1996) Sunyaev, R.A., & Churazov, E.M. 1996, Astron.Lett., 22, 648
- Sunyaev & Churazov (1998) Sunyaev, R., & Churazov, E. 1998, MNRAS, 297, 1279
- Sunyaev, Markevitch & Pavlinsky (1993) Sunyaev, R.A., Markevitch, M., & Pavlinsky, M. 1993, ApJ, 407, 606
- Sunyaev, Uskov & Churazov (1999) Sunyaev, R.A., Uskov, D.B., & Churazov, E.M. 1999, Astron. Lett., 25, 199
- Tatischeff, Ramaty & Kozlovsky (1998) Tatischeff, V., Ramaty, R., & Kozlovsky, B. 1998, ApJ, 504, 874
- Ubertini et al. (2003) Ubertini, P., Lebrun, F., Di Cocco, G., et al. 2003, A&A, 411, 131L
- Vainshtein, Sunyaev & Churazov (1998) Vainshtein, L.A., Syunyaev, R.A., & Churazov, E.M. 1998, Astron. Lett., 24, 271
- Valinia et al. (2000) Valinia, A., Tatischeff, V., Arnaud, K., Ebisawa, K., & Ramaty, R. 2000, ApJ, 543, 733
- Winkler et al. (2003) Winkler, C., Courvoisier, T.J.-L., Di Cocco, G., et al. 2003, A&A, 411, 1L
- Yusef-Zadeh, Law & Wardle (2002) Yusef-Zadeh, F., Law, C., & Wardle, M. 2002, ApJ, 568, 121L