The VLA-COSMOS Survey:
I. Radio Identifications from the Pilot Project
Abstract
We present a catalog of 246 radio sources found in the central 1 degree of the COSMOS field at 1.4 GHz. The VLA pilot project data have a resolution of 1.9′′1.6′′ and an rms noise limit of 25-100 Jy/beam covering 0.837 deg2. About 20 radio sources are clearly extended and most of them appear to be double-lobed radio galaxies. We find evidence for a cluster of 7 radio sources with an extent of 10′ southeast of the COSMOS field center. This VLA pilot project was undertaken to demonstrate the feasibility of wide-field mosaicking at 2” resolution at 1.4 GHz using the VLA in its A array configuration. The 7-point mosaic data was used to develop the techniques necessary for reduction and analysis. These data will provide the initial astrometric frame for the optical (ground- and space-based) data of the COSMOS 2 deg2 survey. In addition, it demonstrates the feasibility of obtaining deep (rms few Jy) radio imaging of this field at 1.4 GHz, since the brightest radio emission peak detected within the area covered has a flux density of 13 mJy/beam and no strong side-lobes from sources surrounding the COSMOS field were detected. Comparison of the number counts to other deep radio surveys shows that the COSMOS field is a representative deep field in the radio domain.
1 Introduction
The relations between the cosmic mass distribution, environment and galaxy properties are poorly constrained beyond a redshift of 0.5. Dressler et al. (1997) first demonstrated that such a relation exists at 0.5. The rate of galaxy evolution and the morphological mix are thought to be strongly dependent on the local density in the large-scale structure (LSS) but this is well established only for the local universe (2dF and Sloan surveys; e.g. Lewis et al. 2002, Balogh et al. 2004, Gómez et al. 2003, Hogg et al. 2003). Substantial LSS occurs on scales up to Mpc (co-moving) (e.g. Ramella, Geller & Huchra 1992, Gott et al. 2003), including voids, filaments, groups and clusters which requires wide areas and accurate spectroscopic redshifts to properly sample it.
The COSMOS 2 deg2 survey (Scoville et al. 2005; http://www.astro.caltech.edu/cosmos) is a pan-chromatic imaging and spectroscopic survey of a field designed to probe galaxy and SMBH (super-massive black hole) evolution as a function of cosmic environment. The two major aspects of the COSMOS survey are the HST Treasury project (P.I. Scoville), entailing the largest ever allocation of HST telescope time – 590 orbits for ACS band imaging of the full field, and the extensive optical spectroscopic survey with the VIMOS multi-object spectrograph at the VLT with the aim of obtaining 105 spectroscopic redshifts. The equatorial field of the COSMOS project offers the critical advantage of allowing major observatories from both hemispheres to join forces in this endeavor. Numerous state-of-the-art imaging campaigns at all wavelengths (X-ray to millimeter) are currently underway for the COSMOS field.
To study LSS it is essential to obtain high spatial resolution data over the entire electromagnetic spectrum covering the full 2 deg2. Also, surveys of active galactic nuclei benefit from the combination of areal coverage and depth that characterizes the COSMOS project. To match the typical resolution for optical-NIR ground-based data of 1′′, observations with the VLA must be conducted in the A-array which provides a resolution of about 2′′ at 1.4 GHz. In order to cover an area as large as the COSMOS field mosaicking is necessary. We undertook the VLA-COSMOS pilot project to test this approach, since no mosaicking observations in the wide-field imaging mode with the VLA A-array at 1.4 GHz had been attempted yet.
The observations and data reduction are described in Section 2. In section 3 we compare and test the source detection algorithms used, followed by the description of the provided catalog and the resulting source counts in section 4. Individual sources are presented and discussed in section 5, and a summary is given in section 6.
2 Observations and Data Reduction
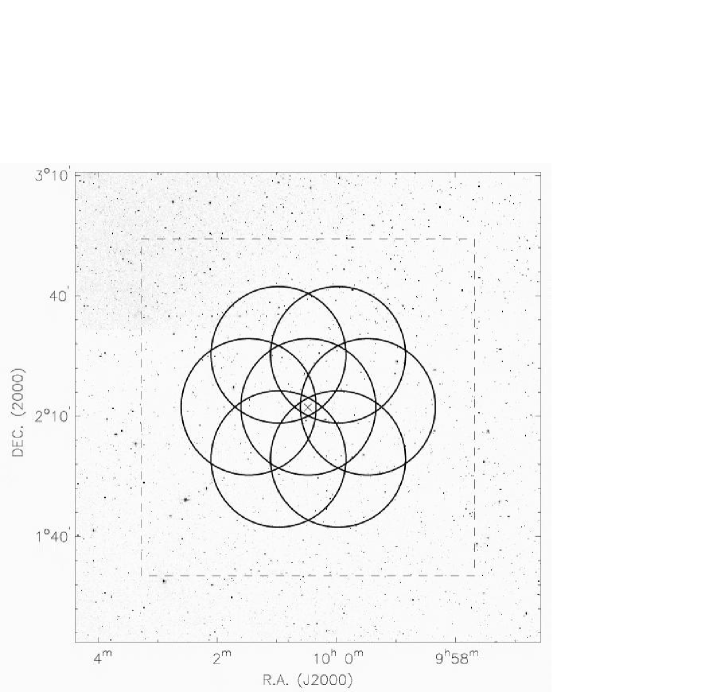
The pilot VLA observations were designed to cover roughly the central 1∘ of the 1.4 1.4∘ COSMOS HST field. As described in Condon et al. (1998) a hexagonal pattern for the pointing centers gives both an almost uniform sensitivity distribution and a high mapping efficiency for large areas. To cover the central degree of the COSMOS field we used 7 individual pointings separated by 15′ (the radius of the HPBW; see Tab. 1). Our pointing separation is smaller than the 26′ separation used for the 1.4 GHz NRAO VLA Sky Survey (NVSS; Condon et al. 1998) conducted with the VLA D-array in order to minimize the effect of bandwidth smearing which is about 2′′ at 15′ distance from the pointing center. The final pointing pattern is shown in Fig. 1.
The COSMOS field was observed at 1.4 GHz for 10hr in total on August 1st, 2003 with the NRAO Very Large Array (VLA) in its A configuration. The standard L-Band continuum frequencies of 1.3649 GHz and 1.4351 GHz were used. In order to minimize the effect of bandwidth smearing, the observations were conducted in the multi-channel continuum mode giving two intermediate frequencies (IFs) with 2 polarizations each. For each IF 6 channels with 3.125 MHz were usable for our observations resulting in a total bandwidth of 75 MHz. The standard VLA flux calibrator 1331+305 (3C286) was observed at the beginning and end of the observing run and served as a flux and passband calibrator. To monitor the phase and amplitude fluctuation we observed 1024-008 for 1.5 min every 40 min. 1024-008 is at a distance of about 6 ∘ from the COSMOS field center with a derived flux density of 0.95 Jy at 1.4 GHz during the time of the observations. A typical 40min source cycle contained several 8 min long observations per pointing. The final on-source integration time was about 1 hr per field.
The data reduction was done using the NRAO AIPS package, following the standard path for wide-field imaging and mosaicking (e.g. Condon et al. 1998, Richards 2000). After a first atmospheric calibration using 1024-008, amplitude and phase self-calibration was employed using the 25 - 30 strongest (few mJy/beam) continuum sources present within the field. In order to improve the rms noise level, all obvious radio frequency interference (RFI) was flagged in each channel. In addition, we clipped all data points above a threshold of 550 mJy/beam. A robust=1 weighting provided the optimum between rms sensitivity and Gaussian beam shape with a resolution of 1.9′′1.6′′ (PA = -23). Despite the equatorial field the side-lobes of the resulting dirty beam are below the 10% level. The final rms noise in each field ranged from 46 Jy/beam (pointing 1) to 36 Jy/beam (pointing 7) due to the very low elevation at the beginning of the observations. For the final mosaic each pointing was deconvolved separately using the 3-dimensional CLEAN algorithm of the AIPS task ’IMAGR’. We CLEANed down to a residual flux level of 2.5.
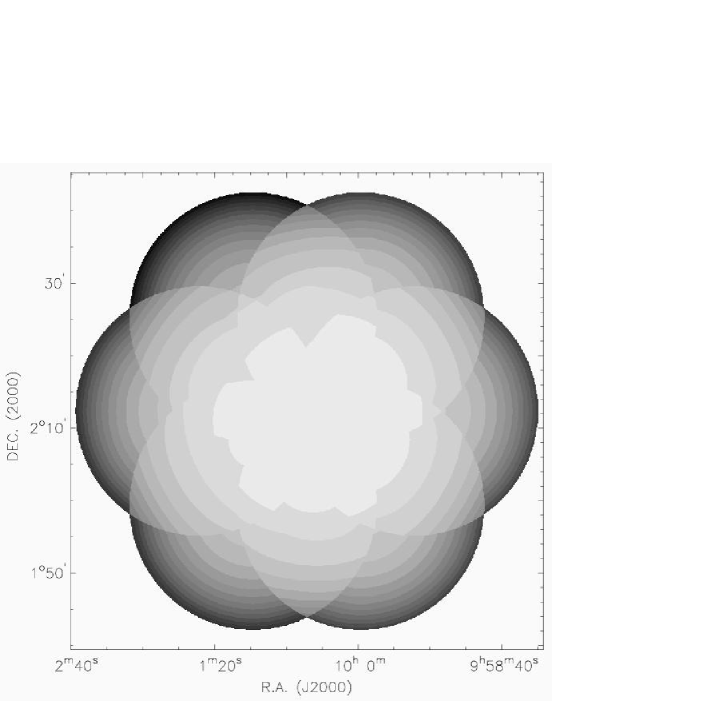
The individual pointing images were combined using the AIPS task ’FLATN’ which also takes the primary beam correction into account. When combining images, we blanked data outside the 40% power radius of the primary beam. This is not quite optimal for the S/N ratio (see Condon et al. 1998 for a discussion), however it reduces the effect of the bandwidth smearing. (The beam broadening due to bandwidth smearing is about 1.45 at the 40% power radius and 2.0 at the 10% radius.) The variations of the rms noise in the central 30’ which have highest sensitivity (see fig. 2) are about 10% close to the standard noise variations found for single pointings of about 7%. The rms noise in the final mosaic is 25 Jy/beam for the central part and uniform out to a radius of about 7′, it increases to 100 Jy/beam at a radius of about 29′. The flux calibration was checked on sources common to the NVSS (Condon et al. 1998) and individual pointings. For each pointing we checked about 5 sources which all showed good agreement in the flux values when taking into account the different resolution of the NVSS and COSMOS data. The strongest radio emission peak detected has a flux density of 13 mJy/beam. The VLA dynamic range due to confusing sidelobes resulting from calibration errors is typically a few 1000. Thus this 13 mJy source will not limit the rms noise down to a level of a few Jy) in the COSMOS field.
The unique aspect of the VLA-COSMOS pilot project is its high angular resolution of about 2′′ compared to, for example, 612′′ of the Phoenix Deep Survey (PDS; Hopkins et al. 2003) and 6′′ of the Virmos Deep Field (VDF; Bondi et al. 2003). Both of these surveys cover a comparable (VDF) or significantly larger area (PDS). The rms noise of the most sensitive area is better by about a factor of 1.5 (VDS) to 2 (PDS). For comparison, the full VLA-COSMOS survey is designed to cover 2 deg2 with an rms of 10 Jy in the central 1 deg2 at a resolution of about 2′′.
3 Source Finding and Measurements
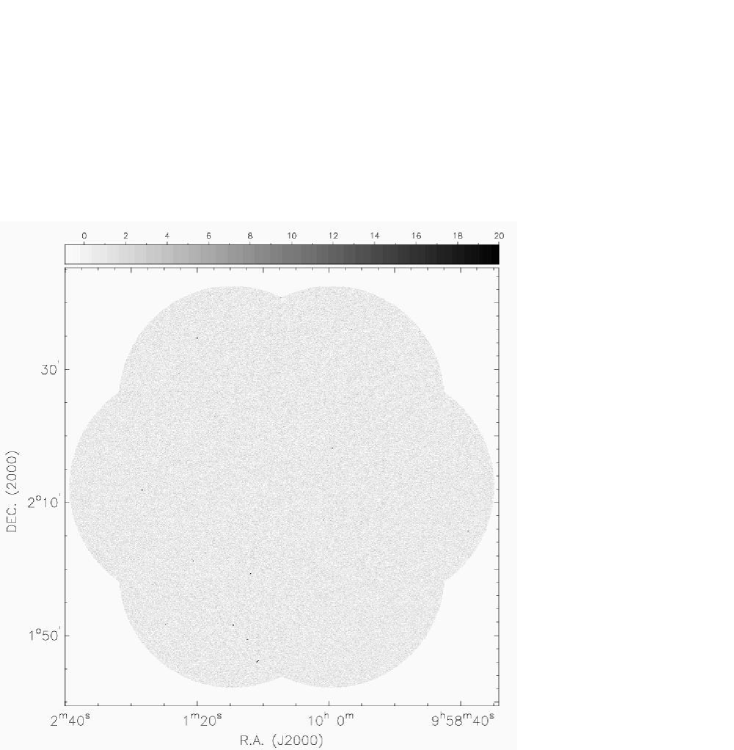
Two different source detection algorithms were thoroughly tested and compared: ’SAD’ (Search And Destroy) in the software package AIPS and ’SFIND’ in the software package MIRIAD (Hopkins et al. 2002, 2003). Both tasks give parametrized results for the detected components/sources from Gaussian fits to the data. The SAD task is based on source detection in a simple -clipped image assuming a constant rms noise over the entire field. (Corrections for primary beam effects can be included for single pointings only.) Thus, in order to be able to use SAD we computed a sensitivity map (Fig. 2) from the individual pointings using the AIPS task ’STESS’ and derived a S/N map for the entire mosaic. Then SAD was run on the S/N map (Fig. 3) using a 5 detection limit.
The task SFIND is based on the ’False Detection Rate’ (FDR) algorithm (Hopkins et al. 2002, Miller et al. 2001). The pixels for the component/source detection are selected from a distribution of pixels with a robustly known chance (provided by the user) of being falsely drawn from the background. We followed the approach for using SFIND outlined by Hopkins et al. (2003). To run SFIND the mosaic was divided into four quadrants. A box size of 100 pixels (= 47′′) was used to determine the local rms noise. This size provided the best compromise between closely following the varying sensitivity and still avoiding higher rms noise values close to extended radio galaxies which are mainly present south-east of the COSMOS field center. We selected the parameter to be 5%, meaning that only 5% of all pixels selected should be false detections. Hopkins et al. (2002) showed that this number is about the same for the number of false source detections. An of 5% translates into a detection threshold of 4.5 over the entire COSMOS field corresponding to 100 Jy/beam in the field center which has the best sensitivity. In addition, we did not require that for source measurements all pixels belonging to that source lie above the detection threshold, i.e. they had to be be contiguous and monotonically decreasing from the peak pixel, but not necessarily to lie above the detection threshold.
To test the effect of bandwidth smearing on the derived source size, we made use of sources present in several individual pointings. We compared the derived source sizes in the final mosaic to the source sizes derived in the individual pointings. No large effect (fitted point source size 2′′) of source size broadening due to bandwidth smearing was found, as the sources which were at large radii in one pointing were generally close to the center of another pointing. Due to the much higher weight of the central position, the effect of bandwidth smearing was negligible compared to our clean beam size. Thus we conclude that bandwidth smearing is not a dominant factor in broadening the intrinsic source sizes.
In a second test we evaluated the effects of the bandwidth smearing and the imaging/deconvolution process on the properties (peak flux, integrated flux, source size) of point sources in the VLA mosaic determined by the SAD and SFIND routines. For this purpose 10 point source models with peak values ranging from 6 to 95 and sizes from unresolved to 3′′ were inserted in the dataset. This dataset was then processed in the same way as the science data to find the inserted sources. SFIND recovered all of the inserted sources whereas SAD did not find the 6 source. The fluxes were recovered by both tasks within their uncertainties. However, both tasks gave larger fitted source sizes for the weaker sources than the model inputs, in particular point sources appeared resolved with deconvolved sizes from 0.6′′ to 1.2′′. Thus we speculate that systematic effects in the data (clean beam shape versus dirty beam shape, noise distribution, etc.) have a stronger influence on the source size than bandwidth smearing for the given observing set-up.
No systematic differences were found by determining the source sizes using the SAD and SFIND routines or by performing the fitting ’by hand’ using the fitting tasks available in MIRIAD and AIPS. We also compared the source positions derived by SAD and SFIND. The average disagreement between positions in SFIND and SAD is about 0.05′′. No systematic effect is seen. Therefore, we conclude that our absolute astrometric uncertainty is of the order of 0.05′′. We decided to use the SFIND algorithm for constructing the final source catalog, since it calculates the actual rms noise at the position of the source and it seemed more sensitive to the weakest sources.
4 Catalog and Counts
The final catalog (see section 4 and Tab. 2) was constructed from an initial list of 305 components found by the routine SFIND for a False Detection Rate of 5% (see section 3). (Note that about 5% of these components should be false detections, as already mentioned in section 3.) We identified by eye 20 sources (or groups) which were fitted by multiple (sometimes even overlapping) Gaussian components. These 20 groups are displayed in Fig. 9 - 13), Tab. 4 lists the number of Gaussian components found for each of these sources. For these groups, the position and flux density of the emission peak of the entire group of components replaced the entries of the individual components in the final source catalog. The integrated flux of a group was derived using the AIPS task TVSTAT which allowed us to integrate over the irregular area of these sources giving a non-parametric result. One obvious misidentification on a side-lobe was rejected as well. The final catalog contains a total of 246 sources. The distribution of sources with respect to the integrated flux density shows that the completeness of the catalog at the faintest flux levels ( 250Jy) is fairly low (Fig. 4).
4.1 Uncertainty Estimate
The uncertainties on the integrated and peak flux densities determined by a Gaussian fit are in general smaller than the true uncertainties. The error propagation equations by Condon (1997) which assume that Gaussian random noise is dominating the uncertainties in the data (Condon 1997) can be used to estimate the true uncertainties. We followed the approach given by Hopkins et al. (2003) based on the assumption that the relative uncertainty in the integrated flux density is due to uncertainties in the data and uncertainties in the Gaussian fit (their equation 1):
| (1) |
The relative uncertainty in the data is given by Windhorst, van Heerde & Katgert (1984):
| (2) |
where and rms are peak flux density and noise at the position of the source. The constant term represents the relative uncertainties in the absolute flux calibration and due to pointing errors of the individual telescopes which are together of the order of 1%.
Equation (42) of Condon (1997) gives a relation between the relative uncertainty from the fitting and the rms noise in the image which is correlated over the synthesized beam area. Following Hopkins et al. (2003; see their equation 3), we use the product of the major and minor axis of the full width half maximum of the beam () and the measured source size (). The fitting of the peak flux , major axis and minor axis has the relative uncertainties , and , respectively. These can be approximated by (equation 21 by Condon 1997) with or . Thus equation (42) of Condon (1997) can be written as:
| (3) |
The signal-to-noise ratios (S/N) of the fit, , and , are parameter dependent (see equation 41 of Condon 1997). Following Hopkins et al. (2003) and Condon (1997), they can be calculated as follows
| (4) |
with for , and for , and and for .
4.2 Derived Source Sizes
The deconvolved source sizes were derived from the fitted sizes given by SFIND and the size of the clean beam. Since we did not check the PSF during the size fit with SFIND, some fitted source sizes are smaller than the clean beam. These sizes were excluded from the size deconvolution. However, the effect on the integrated flux is minimal compared to enforcing a minimal source size of the clean beam.
A significant fraction of our sources appear resolved (see Fig. 5), however, as discussed in section 3 the derived values for the faint and small sources might not be correct. From Fig. 5, we estimate that fitted source sizes of 2.5′′ are not reliable. This is in agreement with our modeling. Note that Richards (2000) concluded after thorough testing and modeling that only these sources close to the detection limit with sizes of 2.7′′ could be reliably resolved in the 2′′ VLA A-array data of the HDF-N field. Therefore the size distribution for weak radio sources (with fitted sizes smaller than about 2.5′′) in our VLA data remains largely unknown.
4.3 Description of the Catalog
The final catalog is presented in Tab. 2. Sources which
were fitted by multiple Gaussian components are presented in detail in
Section 5, in Tab. 2 we list the position of
the emission peak as well as the derived integrated flux for these
sources. (Note that the absolute astrometric uncertainty is of the
order of 0.05′′; see section 3.) All 246
radio sources are listed in right ascension order in
Tab. 2 with the following columns:
Column(1): Right ascension (J2000.0) and its rms uncertainty
Column(2): Declination (J2000.0) and its rms uncertainty
Column(3): Peak flux density and its rms uncertainty
Column(4): Integrated flux density and its rms uncertainty
Column(5): rms measured by SFIND at the position of the radio
source
Column(6): Fitted source size – major axis
Column(7): Fitted source size – minor axis
Column(8): Fitted source size –
Column(9): Deconvolved source size – major axis
Column(10): Deconvolved source size – minor axis
Column(11): Deconvolved source size –
Column(12): Flag for sources with multiple components which are presented in
Section 5.
4.4 Number Counts
To derive the number counts, we divided our source catalog into six bins with about 40 sources each to provide reasonable statistics. This is intended to test whether the radio source counts in the COSMOS field are similar to the ones obtained in other deep radio fields.
In order to derive the correct source counts at a given flux density, we need to correct for the fact that the rms noise across the field is varying (weighting correction) and that weaker extended source will be missed as their peak flux density is below our detection threshold while their integrated flux density might still be above (resolution effect). The relation between the measured source counts and the corrected source counts is:
| (5) |
The weighting correction simply depends on the effective area for source detection with respect to the total area covered by the survey (see Fig. 6):
| (6) |
Windhorst et al. (1990) gives the following relation for the distribution of the source sizes at a given flux density (see also Hopkins et al. 1998):
| (7) |
where is the medium source size at a given flux density at 1.4 GHz. Using for the maximal detectable structure at a given flux density allows us to derive the correction factor for large sources missed in the data:
| (8) |
Windhorst et al. (1993) derived an average source size of about 2.0′′ for sub-mJy sources. Richards (2000) and Bondi et al. (2003) find similar values, however Bondi et al. (2003) found that the Windhorst et al. (1990) relation over-predicts the number of sources with large angular sizes through comparison to their data on the VDF field. To allow for easy comparison, we use the Windhorst et al. (1990) relation with an average source size of 2.0′′ (see Tab. 3).
We present the Euclidean normalized differential source counts for the COSMOS field in Fig. 7. The comparison with results of similar deep field surveys (HDF-N: Richards et al. 2000; VDF: Bondi et al. 2003, PDS: Hopkins et al. 2003, ELAIS: Ciliegi et al. 1999) shows that the COSMOS field is representative.
5 The central 9′9′ HST ACS Field and Individual Radio Sources
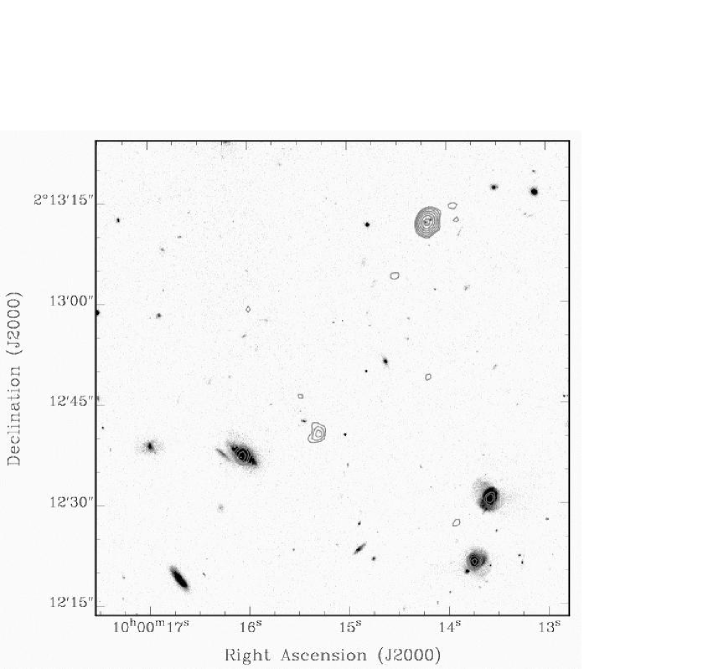
We have detected 12 radio sources within the area covered by the initial central 9′9′ of the HST ACS and band data. (Note that the magnitude limit for the HST ACS band survey is mag for a 5 point source.) We find 9 optical counterparts suggesting that about 75% of all our radio sources will have optical counterparts in the HST images. The resolved optical sources range from knotty spiral galaxies, one apparently interacting galaxy pair to early type galaxies (Fig. 8). This clearly demonstrates that the combination of the HST ACS data and the VLA radio data (together with ground-based optical imaging and spectroscopic data as well as XMM X-ray data) will allow classification of the origin of the radio emission (star formation vs. AGN) based on host galaxy properties.
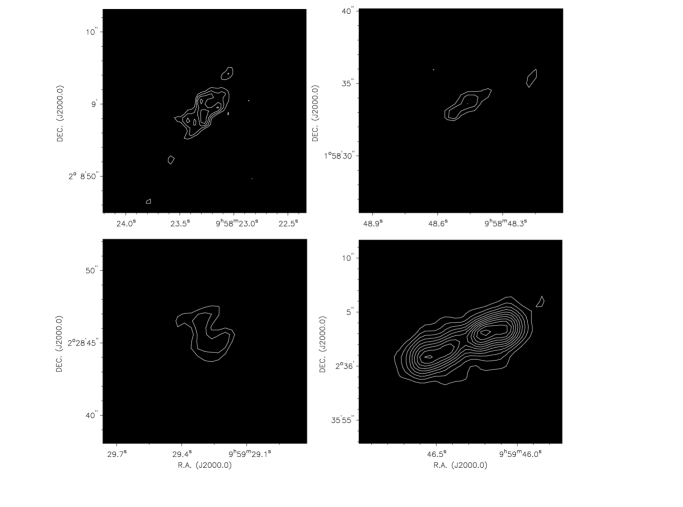
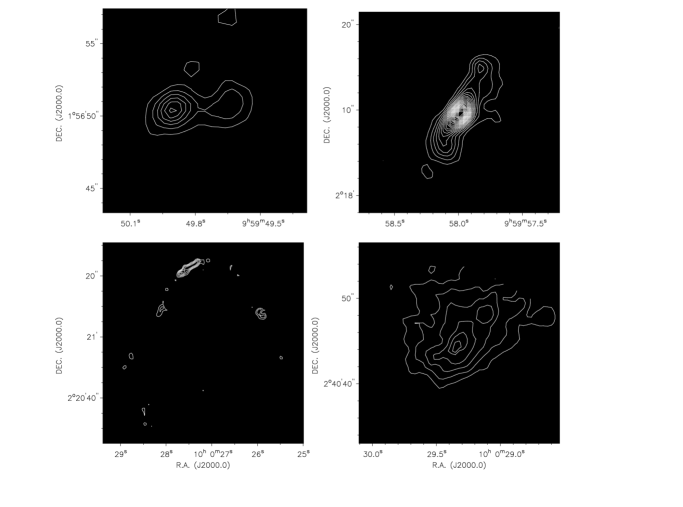
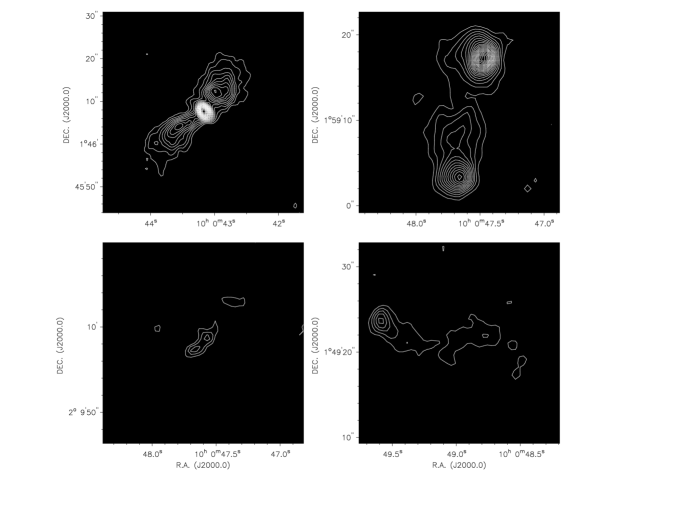
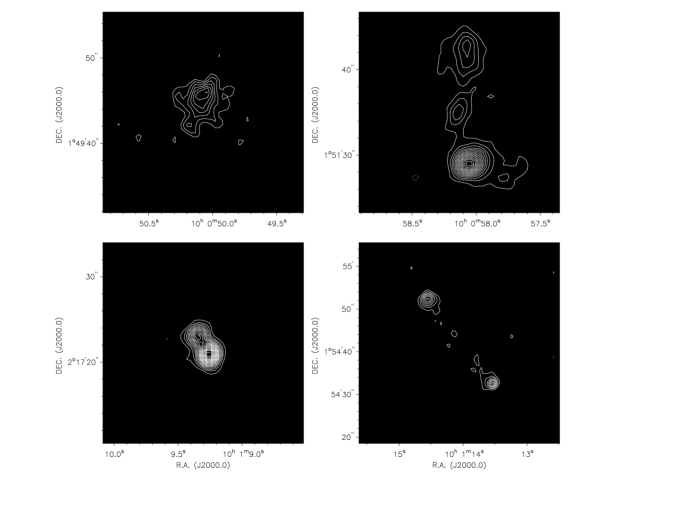
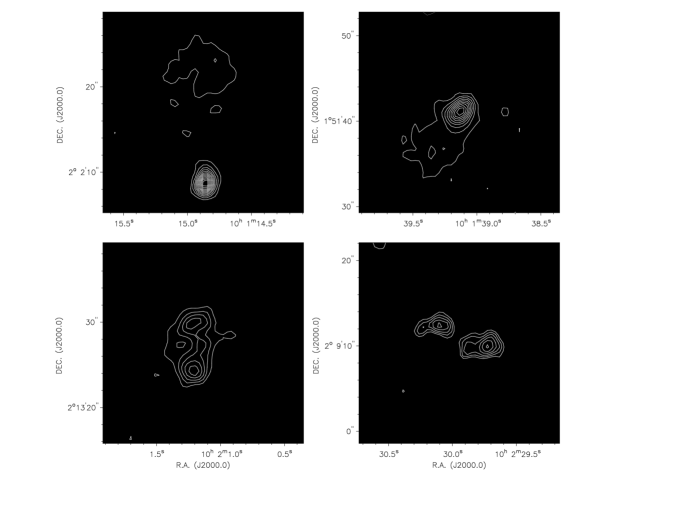
We identified 20 radio sources which were fit by more than one Gaussian component present in the pilot data-set (Fig. 9 to 13). These radio groups are listed in Tab. 4. Most of them are very likely FRII radio galaxies exhibiting the typical double-lobe structure. Not randomly distributed, an apparent cluster of 6 radio galaxies is seen to the south-east of the COSMOS field center with an extent of 10′. The five double-lobed radio galaxies (ID# 134, 138, 159, 181 and 182 in Tab. 4) and the 1 single-lobed radio galaxy (ID# 141 in Tab. 4) of this apparent cluster are shown in Fig. 9 to 13.
6 Summary and Conclusions
We have presented the first wide-field imaging mosaic obtained with the VLA in A configuration at 1.4 GHz. These data cover the inner 1 degree of the COSMOS field down to an rms noise level of 25 Jy/beam in the inner region. We present a radio source catalog containing 246 entries above the 4.5 limit. About 20 sources are well-resolved into multiple components likely being double-lobed radio galaxies. An apparent cluster of 6 radio galaxies is found to the southeast of the COSMOS field containing 5 double-lobed radio galaxies. No strong radio emission peak was found in the field which could prevent further deep (down to the few Jy level) radio imaging of the COSMOS field. The radio number counts are consistent with those derived for other fields such as the Phoenix deep field and the VIRMOS deep field showing that the COSMOS field is a representative field in the radio domain.
Comparison between the source finding algorithms SAD in AIPS and SFIND in MIRIAD shows similar results for the fitting of the source properties, however, SFIND was more sensitive to sources close to our detection limits. We found that only fitted source sizes 2.5′′ are reliable in our data. The full VLA-COSMOS source catalog as well as the image are available in electronic form from the COSMOS archive at IPAC/IRSA (http://www.irsa.ipac.caltech.edu/data/COSMOS starting mid-Aug 2004).
In the future, the COSMOS archive will also contain (photometric and spectroscopic) redshifts, optical morphologies, and flux densities from the X-ray to millimeter wavelengths.
References
- (1) Balogh, M., et al. 2004, MNRAS, 348, 1355
- (2) Bondi, M., et al. 2003, A&A, 403, 857
- (3) Ciliegi, P., et al. 1999, MNRAS, 302, 222
- (4) Condon, J. J. 1997, PASP, 109, 166
- (5) Condon, J. J., Cotton, W. D., Greisen, E. W., Yin, Q. F., Perley, R. A., Taylor, G. B.,Broderick, J. J. 1998, AJ, 115, 1693
- (6) Dressler, A., et al. 1997, ApJ, 490, 577
- (7) Gómez, P.L., et al. 2003, ApJ, 584, 210
- (8) Gott, J.R., Jurić, M., Schlegel, D., Hoyle, F., Vogeley, M., Tegmark, M., Bahcall, N., Brinkmann, J. 2003, astro-ph/0310571
- (9) Hogg, D.W., et al. 2003, ApJ, 585, L5
- (10) Hopkins, A. M., Afonso, J., Chan, B., Cram, L. E., Georgakakis, A., Mobasher, B. 2003, AJ, 125, 465
- (11) Hopkins, A. M., Miller, C. J., Connolly, A. J., Genovese, C., Nichol, R. C., Wasserman, L. 2002, AJ, 123, 1086
- (12) Hopkins, A. M., Mobasher, B., Cram, L., Rowan-Robinson, M. 1998, MNRAS, 296, 839
- (13) Lewis, I., et al. 2002, MNRAS, 334, 673
- (14) Miller, C. J., et al. 2001, AJ, 122, 3492
- (15) Ramella, M., Geller, M.J., Huchra, J.P. 1992, ApJ, 384, 396
- (16) Richards, E. A. 2000, ApJ, 533, 611
- (17) Scoville, N.Z., et al. 2005, in prep.
- (18) Windhorst, R. A., Fomalont, E. B., Partridge, R. B., Lowenthal, J. D. 1993, ApJ, 405, 498
- (19) Windhorst, R. A., van Heerde, G. M., Katgert, P. 1984, A&AS, 58, 1
- (20) Windhorst, R. A., Mathis, D., Neuschaefer, L. 1990, in ASP Conf. Ser. 10, Evolution of the Universe of Galaxies (San Francisco: ASP), 389


| Pointing # | R.A. (J2000) | DEC (J2000) |
|---|---|---|
| 1 | 10:00:58.62 | +02:25:20.42 |
| 2 | 09:59:58.58 | +02:25:20.42 |
| 3 | 10:01:28.64 | +02:12:21.00 |
| 4aaCOSMOS field center | 10:00:28.60 | +02:12:21.00 |
| 5 | 09:59:28.56 | +02:12:21.00 |
| 6 | 10:00:58.62 | +01:59:21.58 |
| 7 | 09:59:58.58 | +01:59:21.58 |
Note. — Pointing centers for the VLA pilot project at 1.4 GHz.
| R.A. | Dec. | S | I | rms | Flag | ||||||
|---|---|---|---|---|---|---|---|---|---|---|---|
| (J2000.0) | (J2000.0) | [mJy/beam] | [mJy] | [mJy/beam] | [′′] | [′′] | [o] | [′′] | [′′] | [o] | |
| 09:58:23.271 | 2:08:57.63 | 0.564 | 5.765 | 0.083 | 0.0 | 0.0 | 0.0 | 0.0 | 0.0 | 0.0 | y |
| 09:58:28.708 0.010 | 2:11:00.19 0.00 | 0.530 0.117 | 0.825 0.227 | 0.072 | 2.9 | 1.7 | 88.4 | 2.4 | 0.0 | 85.2 | |
| 09:58:29.067 0.006 | 2:05:31.20 0.01 | 0.683 0.147 | 1.779 0.441 | 0.089 | 3.2 | 2.5 | 45.3 | 2.8 | 1.7 | 49.6 | |
| 09:58:34.874 0.012 | 2:03:12.49 0.01 | 0.561 0.141 | 1.228 0.367 | 0.088 | 3.2 | 2.1 | 62.1 | 2.8 | 0.9 | 62.8 | |
| 09:58:35.454 0.001 | 2:05:43.65 0.00 | 6.477 0.657 | 10.701 1.095 | 0.074 | 2.6 | 2.0 | 64.1 | 2.0 | 0.6 | 64.9 | |
| 09:58:35.760 0.014 | 2:05:46.07 0.01 | 0.385 0.097 | 0.318 0.115 | 0.066 | 2.3 | 1.1 | -46.3 | 1.4 | 0.0 | 127.3 | |
| 09:58:35.916 0.003 | 2:12:33.13 0.00 | 0.350 0.089 | 0.285 0.103 | 0.060 | 1.6 | 1.5 | -13.9 | 0.0 | 0.0 | 0.0 | |
| 09:58:42.056 0.006 | 2:15:10.94 0.00 | 0.391 0.090 | 0.618 0.177 | 0.055 | 2.5 | 1.9 | -66.8 | 1.8 | 0.7 | 102.2 | |
| 09:58:44.728 0.004 | 2:02:49.57 0.01 | 0.553 0.120 | 1.086 0.283 | 0.072 | 2.8 | 2.1 | 3.4 | 2.1 | 1.3 | 11.7 | |
| 09:58:45.264 0.005 | 2:15:40.90 0.01 | 0.453 0.090 | 0.815 0.195 | 0.053 | 3.0 | 1.8 | -44.5 | 2.4 | 0.7 | 131.4 | |
| 09:58:46.374 0.010 | 2:16:02.36 0.00 | 1.380 0.156 | 4.522 0.530 | 0.051 | 4.0 | 2.5 | -86.1 | 3.6 | 1.7 | 91.6 | |
| 09:58:48.461 | 1:58:33.59 | 0.350 | 0.523 | 0.070 | 0.0 | 0.0 | 0.0 | 0.0 | 0.0 | 0.0 | y |
| 09:58:51.596 0.006 | 2:08:58.11 0.01 | 0.252 0.071 | 0.271 0.104 | 0.047 | 2.3 | 1.4 | -45.2 | 1.4 | 0.0 | 126.9 | |
| 09:58:55.618 0.003 | 2:00:56.19 0.00 | 0.257 0.075 | 0.297 0.115 | 0.049 | 2.3 | 1.6 | 26.6 | 1.5 | 0.0 | 36.4 | |
| 09:58:58.285 0.003 | 2:10:46.37 0.00 | 0.675 0.092 | 0.870 0.139 | 0.043 | 2.1 | 1.9 | -44.9 | 1.1 | 0.7 | 91.8 | |
| 09:58:58.353 0.005 | 2:12:49.76 0.00 | 0.230 0.061 | 0.169 0.065 | 0.042 | 1.8 | 1.2 | -64.6 | 0.5 | 0.0 | 99.5 | |
| 09:58:58.539 0.001 | 2:14:59.09 0.00 | 1.034 0.121 | 1.105 0.145 | 0.044 | 1.9 | 1.7 | -57.7 | 0.8 | 0.0 | 87.1 | |
| 09:58:58.996 0.005 | 1:56:46.03 0.01 | 0.295 0.084 | 0.294 0.115 | 0.056 | 2.0 | 1.5 | -18.5 | 0.6 | 0.0 | 168.0 | |
| 09:58:59.344 0.004 | 2:20:44.45 0.00 | 0.366 0.072 | 0.397 0.101 | 0.043 | 2.1 | 1.6 | -65.5 | 1.2 | 0.0 | 99.1 | |
| 09:58:59.354 0.005 | 2:01:27.92 0.01 | 0.222 0.064 | 0.205 0.082 | 0.043 | 1.7 | 1.7 | -51.6 | 0.6 | 0.0 | 157.0 | |
| 09:59:01.843 0.003 | 2:14:49.90 0.00 | 0.228 0.062 | 0.205 0.077 | 0.041 | 2.0 | 1.4 | -19.0 | 0.6 | 0.0 | 165.2 | |
| 09:59:06.274 0.001 | 1:59:47.72 0.00 | 0.224 0.065 | 0.191 0.078 | 0.044 | 1.7 | 1.5 | 4.3 | 0.0 | 0.0 | 0.0 | |
| 09:59:07.211 0.005 | 2:16:30.14 0.01 | 0.198 0.056 | 0.191 0.074 | 0.037 | 2.0 | 1.5 | -14.5 | 0.7 | 0.0 | 176.7 | |
| 09:59:07.475 0.003 | 1:55:55.73 0.00 | 0.589 0.090 | 0.907 0.163 | 0.046 | 2.3 | 2.1 | 37.9 | 1.6 | 1.0 | 53.9 | |
| 09:59:09.194 0.005 | 1:47:42.96 0.01 | 0.422 0.120 | 0.323 0.131 | 0.082 | 1.9 | 1.3 | -26.7 | 0.1 | 0.0 | 148.9 | |
| 09:59:10.305 0.024 | 2:07:32.37 0.01 | 0.220 0.056 | 0.470 0.143 | 0.035 | 3.2 | 2.0 | -63.2 | 2.7 | 1.0 | 112.0 | |
| 09:59:10.819 0.004 | 2:19:09.93 0.00 | 0.224 0.057 | 0.284 0.094 | 0.036 | 2.1 | 1.8 | -15.7 | 0.9 | 0.8 | 14.2 | |
| 09:59:11.161 0.016 | 2:28:31.73 0.01 | 0.400 0.081 | 0.616 0.155 | 0.048 | 2.4 | 1.9 | -61.9 | 1.6 | 0.7 | 104.1 | |
| 09:59:13.295 0.003 | 1:52:28.25 0.00 | 0.651 0.110 | 0.862 0.180 | 0.061 | 2.2 | 1.8 | 53.4 | 1.5 | 0.0 | 58.8 | |
| 09:59:13.882 0.008 | 2:08:37.00 0.00 | 0.222 0.056 | 0.313 0.100 | 0.035 | 2.6 | 1.7 | -80.2 | 2.0 | 0.0 | 93.5 | |
| 09:59:14.736 0.003 | 2:12:19.54 0.00 | 0.700 0.084 | 0.859 0.115 | 0.032 | 2.1 | 1.8 | -28.0 | 0.9 | 0.8 | 125.4 | |
| 09:59:14.795 0.003 | 2:12:44.33 0.00 | 0.214 0.051 | 0.221 0.072 | 0.033 | 1.9 | 1.6 | -27.8 | 0.3 | 0.0 | 109.6 | |
| 09:59:15.282 0.043 | 2:01:23.99 0.05 | 0.184 0.056 | 0.422 0.154 | 0.036 | 2.9 | 2.4 | 30.0 | 2.4 | 1.6 | 39.5 | |
| 09:59:15.464 0.013 | 2:09:05.43 0.01 | 0.176 0.054 | 0.225 0.090 | 0.035 | 2.3 | 1.7 | -78.0 | 1.6 | 0.0 | 92.2 | |
| 09:59:16.516 0.003 | 2:09:44.35 0.00 | 0.263 0.055 | 0.284 0.078 | 0.034 | 2.2 | 1.5 | -33.0 | 1.1 | 0.0 | 140.7 | |
| 09:59:17.751 0.002 | 2:09:27.92 0.00 | 0.367 0.062 | 0.477 0.099 | 0.034 | 2.1 | 1.9 | -5.5 | 1.1 | 0.8 | 42.3 | |
| 09:59:18.713 0.000 | 2:09:51.45 0.00 | 1.228 0.132 | 1.323 0.151 | 0.034 | 2.0 | 1.6 | -28.2 | 0.6 | 0.0 | 139.3 | |
| 09:59:19.456 0.002 | 2:34:12.98 0.00 | 0.387 0.105 | 0.886 0.284 | 0.066 | 2.8 | 2.5 | -23.7 | 2.1 | 1.9 | 154.9 | |
| 09:59:29.230 | 2:28:45.11 | 0.198 | 0.613 | 0.040 | 0.0 | 0.0 | 0.0 | 0.0 | 0.0 | 0.0 | y |
| 09:59:27.204 0.009 | 2:37:38.04 0.01 | 0.602 0.119 | 3.002 0.635 | 0.074 | 4.1 | 3.7 | 2.7 | 3.7 | 3.3 | 11.9 | |
| 09:59:24.028 0.004 | 2:27:07.97 0.00 | 0.750 0.093 | 0.970 0.137 | 0.038 | 2.2 | 1.8 | -36.6 | 1.2 | 0.7 | 125.5 | |
| 09:59:30.009 0.011 | 2:03:45.45 0.01 | 0.149 0.048 | 0.212 0.088 | 0.031 | 2.2 | 1.9 | 76.9 | 1.5 | 0.1 | 72.3 | |
| 09:59:30.903 0.004 | 2:32:09.48 0.00 | 0.254 0.070 | 0.225 0.087 | 0.047 | 1.9 | 1.4 | -45.1 | 0.5 | 0.0 | 115.3 | |
| 09:59:32.504 0.003 | 2:10:37.75 0.00 | 0.315 0.052 | 0.443 0.088 | 0.028 | 2.3 | 1.9 | -21.9 | 1.3 | 1.0 | 159.9 | |
| 09:59:33.387 0.002 | 2:14:22.51 0.00 | 0.140 0.040 | 0.129 0.052 | 0.027 | 1.9 | 1.4 | 24.9 | 0.8 | 0.0 | 40.3 | |
| 09:59:34.709 0.004 | 2:12:29.05 0.01 | 0.265 0.049 | 0.535 0.117 | 0.028 | 2.9 | 2.1 | -1.3 | 2.2 | 1.3 | 5.0 | |
| 09:59:34.760 0.004 | 2:06:33.67 0.01 | 0.172 0.042 | 0.152 0.052 | 0.028 | 2.0 | 1.3 | -31.6 | 0.7 | 0.0 | 141.7 | |
| 09:59:34.815 0.001 | 2:37:45.26 0.00 | 1.803 0.205 | 2.539 0.312 | 0.067 | 2.7 | 1.6 | -22.9 | 1.9 | 0.0 | 157.1 | |
| 09:59:35.736 0.005 | 1:58:05.37 0.00 | 0.263 0.055 | 0.341 0.090 | 0.033 | 2.1 | 1.9 | -57.6 | 1.2 | 0.6 | 89.2 | |
| 09:59:36.222 0.012 | 2:08:08.01 0.01 | 0.209 0.046 | 0.329 0.090 | 0.028 | 2.5 | 1.9 | -53.3 | 1.7 | 0.8 | 115.1 | |
| 09:59:37.419 0.000 | 2:23:47.14 0.00 | 0.955 0.107 | 1.189 0.145 | 0.034 | 2.2 | 1.7 | -26.7 | 1.1 | 0.6 | 149.1 | |
| 09:59:40.748 0.003 | 2:19:38.75 0.00 | 0.304 0.051 | 0.348 0.074 | 0.029 | 2.0 | 1.7 | 15.7 | 1.0 | 0.0 | 40.4 | |
| 09:59:43.922 0.002 | 2:33:32.37 0.00 | 0.312 0.074 | 0.318 0.103 | 0.048 | 2.2 | 1.4 | -7.5 | 1.2 | 0.0 | 0.1 | |
| 09:59:45.191 0.002 | 2:34:39.22 0.00 | 0.306 0.078 | 0.322 0.112 | 0.051 | 2.1 | 1.5 | -23.4 | 0.9 | 0.0 | 156.2 | |
| 09:59:45.686 0.007 | 2:16:09.93 0.01 | 0.154 0.041 | 0.187 0.065 | 0.026 | 2.1 | 1.8 | 15.3 | 1.2 | 0.2 | 39.2 | |
| 09:59:46.194 | 2:36:03.19 | 1.925 | 14.367 | 0.056 | 0.0 | 0.0 | 0.0 | 0.0 | 0.0 | 0.0 | y |
| 09:59:47.869 0.002 | 2:10:25.39 0.00 | 0.163 0.040 | 0.205 0.065 | 0.025 | 2.2 | 1.7 | 14.5 | 1.3 | 0.0 | 30.1 | |
| 09:59:48.685 0.002 | 2:23:10.74 0.00 | 0.703 0.083 | 0.817 0.107 | 0.030 | 2.1 | 1.7 | -24.3 | 0.9 | 0.6 | 152.8 | |
| 09:59:48.838 0.003 | 2:12:44.78 0.00 | 0.397 0.054 | 0.495 0.079 | 0.025 | 2.3 | 1.7 | -33.1 | 1.3 | 0.5 | 139.7 | |
| 09:59:49.597 0.001 | 1:59:44.17 0.00 | 0.207 0.047 | 0.284 0.082 | 0.029 | 2.2 | 1.9 | -38.5 | 1.2 | 0.9 | 112.2 | |
| 09:59:49.912 | 1:56:50.37 | 0.605 | 1.492 | 0.032 | 0.0 | 0.0 | 0.0 | 0.0 | 0.0 | 0.0 | y |
| 09:59:50.265 0.001 | 1:48:05.12 0.00 | 0.732 0.103 | 1.026 0.170 | 0.050 | 2.5 | 1.7 | 3.4 | 1.7 | 0.2 | 11.9 | |
| 09:59:50.908 0.006 | 2:09:34.36 0.01 | 0.132 0.038 | 0.149 0.058 | 0.025 | 2.0 | 1.8 | 34.3 | 1.1 | 0.0 | 53.6 | |
| 09:59:51.932 0.000 | 2:05:42.55 0.00 | 1.012 0.108 | 1.112 0.125 | 0.026 | 2.0 | 1.7 | -23.1 | 0.6 | 0.6 | 155.2 | |
| 09:59:52.220 0.005 | 2:09:56.11 0.01 | 0.126 0.039 | 0.208 0.080 | 0.025 | 2.7 | 1.9 | -17.5 | 1.9 | 1.0 | 164.7 | |
| 09:59:52.501 0.015 | 2:07:51.03 0.01 | 0.136 0.041 | 0.243 0.090 | 0.026 | 2.9 | 1.9 | -41.1 | 2.2 | 1.0 | 134.4 | |
| 09:59:54.247 0.001 | 2:24:38.01 0.00 | 0.379 0.057 | 0.450 0.083 | 0.030 | 2.0 | 1.8 | -74.1 | 1.1 | 0.0 | 82.8 | |
| 09:59:54.691 0.000 | 2:30:15.31 0.00 | 1.290 0.140 | 1.380 0.160 | 0.038 | 1.9 | 1.7 | -35.2 | 0.6 | 0.0 | 175.5 | |
| 09:59:55.975 0.009 | 2:19:01.35 0.01 | 0.136 0.040 | 0.188 0.072 | 0.026 | 2.2 | 1.9 | -1.7 | 1.3 | 0.8 | 26.9 | |
| 09:59:57.994 | 2:18:09.72 | 1.923 | 6.596 | 0.028 | 0.0 | 0.0 | 0.0 | 0.0 | 0.0 | 0.0 | y |
| 09:59:58.527 0.002 | 1:52:54.85 0.00 | 0.262 0.056 | 0.312 0.086 | 0.034 | 2.0 | 1.8 | -13.7 | 0.9 | 0.6 | 48.8 | |
| 09:59:58.783 0.023 | 2:07:14.99 0.01 | 0.284 0.047 | 1.061 0.189 | 0.026 | 4.1 | 2.8 | -76.4 | 3.7 | 2.1 | 100.5 | |
| 09:59:58.941 0.007 | 2:18:03.67 0.01 | 0.141 0.042 | 0.142 0.058 | 0.028 | 1.9 | 1.6 | -63.8 | 0.8 | 0.0 | 91.6 | |
| 09:59:59.079 0.001 | 1:48:36.61 0.00 | 2.089 0.222 | 4.557 0.496 | 0.050 | 2.8 | 2.4 | 83.5 | 2.3 | 1.5 | 78.0 | |
| 09:59:59.247 0.001 | 2:09:16.44 0.00 | 0.171 0.041 | 0.214 0.067 | 0.026 | 2.1 | 1.8 | -25.1 | 0.9 | 0.8 | 138.9 | |
| 09:59:59.327 0.005 | 1:48:40.23 0.01 | 1.068 0.130 | 2.522 0.328 | 0.050 | 3.0 | 2.4 | 42.4 | 2.5 | 1.5 | 48.1 | |
| 10:00:00.616 0.000 | 2:15:31.07 0.00 | 3.717 0.373 | 4.156 0.419 | 0.025 | 2.0 | 1.7 | -22.0 | 0.6 | 0.6 | 173.6 | |
| 10:00:01.712 0.003 | 2:27:12.58 0.00 | 0.408 0.062 | 0.483 0.089 | 0.032 | 2.0 | 1.8 | -31.9 | 0.9 | 0.6 | 84.7 | |
| 10:00:02.217 0.004 | 2:16:22.01 0.00 | 0.338 0.052 | 0.464 0.086 | 0.027 | 2.1 | 2.0 | 61.3 | 1.4 | 0.6 | 65.4 | |
| 10:00:02.803 0.001 | 1:46:36.04 0.00 | 0.326 0.086 | 0.353 0.126 | 0.056 | 2.0 | 1.6 | 3.3 | 0.9 | 0.0 | 26.4 | |
| 10:00:02.866 0.008 | 2:29:11.80 0.01 | 0.228 0.059 | 0.337 0.110 | 0.037 | 2.3 | 2.0 | -2.3 | 1.4 | 1.1 | 24.8 | |
| 10:00:03.400 0.004 | 2:07:23.18 0.01 | 0.628 0.074 | 1.380 0.172 | 0.026 | 3.0 | 2.2 | -27.7 | 2.3 | 1.5 | 150.7 | |
| 10:00:04.080 0.003 | 2:34:25.65 0.00 | 0.217 0.067 | 0.233 0.097 | 0.044 | 2.1 | 1.6 | -57.8 | 1.1 | 0.0 | 105.4 | |
| 10:00:05.359 0.004 | 2:30:59.27 0.00 | 0.251 0.062 | 0.262 0.087 | 0.040 | 2.2 | 1.5 | -46.9 | 1.2 | 0.0 | 121.9 | |
| 10:00:05.434 0.000 | 2:30:29.06 0.00 | 2.699 0.276 | 3.671 0.382 | 0.040 | 2.2 | 1.9 | -42.0 | 1.2 | 0.9 | 109.0 | |
| 10:00:06.175 0.001 | 2:40:00.34 0.00 | 1.330 0.171 | 2.164 0.311 | 0.073 | 2.8 | 1.8 | -6.7 | 2.1 | 0.8 | 177.6 | |
| 10:00:06.961 0.001 | 2:17:33.80 0.00 | 0.275 0.047 | 0.366 0.077 | 0.026 | 2.2 | 1.8 | -0.4 | 1.2 | 0.6 | 20.0 | |
| 10:00:07.226 0.002 | 2:40:49.02 0.00 | 1.356 0.184 | 3.135 0.468 | 0.084 | 3.0 | 2.3 | 1.6 | 2.4 | 1.6 | 9.0 | |
| 10:00:07.430 0.010 | 2:40:51.24 0.01 | 0.682 0.141 | 1.825 0.432 | 0.084 | 3.1 | 2.6 | -10.1 | 2.5 | 2.0 | 176.6 | |
| 10:00:08.921 0.003 | 2:14:40.56 0.00 | 0.175 0.040 | 0.190 0.057 | 0.025 | 2.0 | 1.6 | -1.3 | 0.8 | 0.0 | 22.1 | |
| 10:00:09.495 0.005 | 2:22:19.48 0.01 | 0.203 0.044 | 0.258 0.072 | 0.027 | 2.0 | 1.9 | -12.5 | 1.0 | 0.6 | 61.2 | |
| 10:00:10.156 0.005 | 2:41:41.40 0.02 | 0.906 0.164 | 1.899 0.403 | 0.094 | 3.3 | 1.9 | -0.5 | 2.7 | 0.9 | 2.7 | |
| 10:00:10.345 0.006 | 1:50:38.54 0.01 | 0.335 0.066 | 0.408 0.102 | 0.039 | 2.0 | 1.9 | 76.6 | 1.2 | 0.1 | 69.6 | |
| 10:00:10.992 0.023 | 2:07:23.76 0.04 | 0.128 0.039 | 0.245 0.092 | 0.025 | 3.0 | 1.9 | -15.9 | 2.3 | 1.0 | 165.8 | |
| 10:00:12.092 0.002 | 2:08:20.27 0.00 | 0.324 0.049 | 0.438 0.079 | 0.025 | 2.2 | 1.8 | -35.9 | 1.2 | 0.7 | 126.6 | |
| 10:00:13.487 0.001 | 2:18:15.55 0.00 | 0.160 0.039 | 0.144 0.049 | 0.026 | 2.1 | 1.3 | -59.0 | 1.1 | 0.0 | 109.7 | |
| 10:00:13.583 0.005 | 2:12:30.69 0.01 | 0.160 0.042 | 0.166 0.058 | 0.027 | 2.0 | 1.6 | -16.9 | 0.7 | 0.0 | 177.2 | |
| 10:00:13.744 0.001 | 2:12:21.35 0.00 | 0.265 0.047 | 0.292 0.066 | 0.027 | 2.0 | 1.7 | -2.9 | 0.9 | 0.0 | 29.9 | |
| 10:00:14.191 0.001 | 2:13:11.99 0.00 | 0.738 0.083 | 1.267 0.152 | 0.026 | 2.5 | 2.0 | -22.6 | 1.6 | 1.2 | 157.8 | |
| 10:00:15.303 0.007 | 2:12:40.62 0.01 | 0.184 0.044 | 0.332 0.096 | 0.027 | 2.7 | 2.1 | -12.0 | 1.9 | 1.3 | 173.8 | |
| 10:00:16.064 0.003 | 2:12:37.35 0.00 | 0.199 0.045 | 0.355 0.097 | 0.027 | 2.6 | 2.1 | -7.2 | 1.8 | 1.3 | 3.2 | |
| 10:00:16.575 0.000 | 2:26:38.37 0.00 | 4.177 0.420 | 4.743 0.479 | 0.031 | 2.0 | 1.7 | -28.6 | 0.7 | 0.5 | 117.1 | |
| 10:00:16.840 0.001 | 1:51:32.86 0.00 | 0.663 0.085 | 0.915 0.135 | 0.037 | 2.1 | 2.0 | -25.6 | 1.2 | 0.9 | 68.7 | |
| 10:00:17.167 0.014 | 2:09:29.32 0.02 | 0.152 0.039 | 0.204 0.068 | 0.025 | 2.5 | 1.6 | -32.9 | 1.6 | 0.0 | 143.4 | |
| 10:00:17.797 0.006 | 1:51:21.03 0.00 | 0.185 0.055 | 0.181 0.075 | 0.037 | 1.8 | 1.6 | -56.3 | 0.6 | 0.0 | 86.3 | |
| 10:00:18.510 0.002 | 2:32:56.54 0.00 | 0.410 0.074 | 0.950 0.198 | 0.042 | 3.1 | 2.3 | 21.6 | 2.6 | 1.5 | 28.5 | |
| 10:00:18.757 0.006 | 1:53:54.64 0.00 | 0.770 0.092 | 1.071 0.141 | 0.034 | 2.1 | 2.0 | 26.7 | 1.3 | 0.7 | 57.0 | |
| 10:00:19.207 0.008 | 2:13:36.72 0.01 | 0.152 0.041 | 0.197 0.069 | 0.026 | 2.2 | 1.8 | -22.0 | 1.1 | 0.8 | 159.9 | |
| 10:00:21.771 0.001 | 2:12:20.12 0.00 | 0.304 0.047 | 0.315 0.060 | 0.025 | 2.0 | 1.6 | -18.6 | 0.6 | 0.0 | 172.3 | |
| 10:00:21.778 0.001 | 2:00:00.22 0.00 | 0.675 0.079 | 1.085 0.138 | 0.028 | 2.6 | 1.9 | -5.9 | 1.8 | 1.0 | 1.4 | |
| 10:00:21.794 0.002 | 2:23:28.81 0.00 | 0.193 0.047 | 0.240 0.077 | 0.030 | 2.0 | 1.9 | -50.5 | 1.1 | 0.5 | 77.6 | |
| 10:00:22.906 0.008 | 2:23:04.64 0.01 | 0.148 0.046 | 0.202 0.082 | 0.030 | 2.2 | 1.9 | -65.6 | 1.4 | 0.6 | 93.2 | |
| 10:00:22.971 0.007 | 2:13:12.70 0.01 | 0.128 0.037 | 0.359 0.121 | 0.024 | 3.5 | 2.4 | -30.1 | 2.9 | 1.8 | 148.6 | |
| 10:00:23.440 0.001 | 2:06:39.09 0.00 | 0.131 0.038 | 0.146 0.057 | 0.025 | 1.9 | 1.8 | -49.5 | 0.9 | 0.0 | 166.8 | |
| 10:00:23.836 0.002 | 2:01:05.54 0.01 | 0.188 0.042 | 0.184 0.056 | 0.027 | 2.2 | 1.4 | -5.1 | 1.2 | 0.0 | 3.3 | |
| 10:00:24.075 0.086 | 2:31:02.70 0.06 | 0.154 0.060 | 0.370 0.171 | 0.039 | 2.9 | 2.5 | -80.4 | 2.4 | 1.7 | 89.5 | |
| 10:00:25.477 0.001 | 2:00:51.80 0.00 | 0.726 0.082 | 0.896 0.111 | 0.027 | 2.2 | 1.7 | -22.3 | 1.1 | 0.6 | 158.5 | |
| 10:00:25.607 0.001 | 2:03:16.17 0.00 | 0.308 0.049 | 0.380 0.074 | 0.026 | 2.2 | 1.7 | -23.0 | 1.1 | 0.6 | 157.0 | |
| 10:00:25.800 0.015 | 1:43:59.37 0.03 | 0.361 0.110 | 0.487 0.192 | 0.071 | 2.3 | 1.8 | -8.6 | 1.3 | 0.7 | 3.5 | |
| 10:00:27.659 | 2:21:21.03 | 0.251 | 6.672 | 0.034 | 0.0 | 0.0 | 0.0 | 0.0 | 0.0 | 0.0 | y |
| 10:00:27.642 0.003 | 2:01:03.19 0.00 | 0.141 0.042 | 0.185 0.072 | 0.027 | 2.2 | 1.8 | -19.7 | 1.1 | 0.8 | 166.4 | |
| 10:00:28.549 0.002 | 2:27:25.86 0.00 | 0.418 0.072 | 0.605 0.127 | 0.040 | 2.2 | 2.0 | -11.6 | 1.2 | 1.1 | 42.1 | |
| 10:00:29.416 | 2:40:38.66 | 1.976 | 35.197 | 0.100 | 0.0 | 0.0 | 0.0 | 0.0 | 0.0 | 0.0 | y |
| 10:00:28.951 0.003 | 2:30:56.14 0.00 | 0.195 0.056 | 0.160 0.065 | 0.038 | 1.9 | 1.3 | -30.3 | 0.2 | 0.0 | 141.5 | |
| 10:00:31.820 0.004 | 2:12:43.42 0.00 | 0.125 0.036 | 0.122 0.048 | 0.024 | 1.9 | 1.6 | -45.5 | 0.6 | 0.0 | 100.8 | |
| 10:00:34.057 0.015 | 2:38:23.86 0.02 | 0.287 0.091 | 0.564 0.220 | 0.059 | 3.1 | 1.9 | -36.5 | 2.5 | 1.0 | 140.8 | |
| 10:00:34.374 0.004 | 2:21:21.78 0.00 | 0.366 0.057 | 0.451 0.086 | 0.030 | 2.2 | 1.7 | -39.4 | 1.2 | 0.4 | 126.6 | |
| 10:00:35.700 0.009 | 2:29:13.05 0.02 | 0.175 0.055 | 0.242 0.100 | 0.036 | 2.3 | 1.8 | 19.3 | 1.5 | 0.3 | 33.4 | |
| 10:00:36.020 0.010 | 2:39:37.77 0.02 | 0.441 0.106 | 0.826 0.242 | 0.066 | 3.1 | 1.8 | -32.5 | 2.5 | 0.8 | 145.7 | |
| 10:00:36.051 0.005 | 2:28:30.60 0.01 | 0.316 0.059 | 0.598 0.133 | 0.034 | 2.7 | 2.2 | -39.0 | 2.0 | 1.5 | 131.2 | |
| 10:00:38.022 0.008 | 2:08:22.85 0.02 | 0.171 0.042 | 0.272 0.083 | 0.026 | 2.5 | 1.9 | 1.9 | 1.7 | 0.9 | 13.0 | |
| 10:00:41.419 0.003 | 2:31:24.11 0.00 | 0.465 0.074 | 0.605 0.118 | 0.040 | 2.1 | 1.9 | -28.5 | 1.0 | 0.9 | 82.0 | |
| 10:00:42.318 0.011 | 2:00:50.30 0.02 | 0.154 0.043 | 0.346 0.114 | 0.027 | 3.1 | 2.2 | -32.0 | 2.5 | 1.5 | 145.5 | |
| 10:00:43.177 | 1:46:07.89 | 4.633 | 65.099 | 0.070 | 0.0 | 0.0 | 0.0 | 0.0 | 0.0 | 0.0 | y |
| 10:00:43.528 0.004 | 2:25:24.36 0.00 | 0.405 0.062 | 0.591 0.108 | 0.032 | 2.3 | 1.9 | -21.4 | 1.3 | 1.0 | 161.3 | |
| 10:00:45.802 0.009 | 2:01:18.94 0.01 | 0.242 0.048 | 0.471 0.110 | 0.028 | 3.0 | 2.0 | -29.3 | 2.3 | 1.2 | 149.1 | |
| 10:00:46.916 0.000 | 2:07:26.50 0.00 | 1.498 0.155 | 1.737 0.184 | 0.027 | 2.0 | 1.8 | -21.1 | 0.8 | 0.6 | 62.1 | |
| 10:00:47.599 | 1:59:00.58 | 2.065 | 13.946 | 0.033 | 0.0 | 0.0 | 0.0 | 0.0 | 0.0 | 0.0 | y |
| 10:00:47.533 0.005 | 2:09:41.05 0.01 | 0.196 0.041 | 0.213 0.058 | 0.025 | 2.0 | 1.6 | 39.6 | 1.1 | 0.0 | 51.0 | |
| 10:00:47.570 | 2:09:58.58 | 0.138 | 0.417 | 0.025 | 0.0 | 0.0 | 0.0 | 0.0 | 0.0 | 0.0 | y |
| 10:00:49.604 | 1:49:23.88 | 0.711 | 4.720 | 0.046 | 0.0 | 0.0 | 0.0 | 0.0 | 0.0 | 0.0 | y |
| 10:00:48.883 0.005 | 2:31:27.25 0.00 | 0.293 0.065 | 0.315 0.093 | 0.041 | 1.8 | 1.8 | 55.1 | 0.8 | 0.0 | 67.0 | |
| 10:00:49.787 0.001 | 2:16:54.79 0.00 | 0.686 0.080 | 0.768 0.100 | 0.029 | 2.0 | 1.7 | -27.0 | 0.7 | 0.5 | 120.8 | |
| 10:00:49.912 0.004 | 2:05:00.04 0.01 | 0.167 0.043 | 0.234 0.077 | 0.027 | 2.3 | 1.8 | -28.7 | 1.3 | 0.8 | 145.6 | |
| 10:00:49.940 0.006 | 2:22:44.91 0.01 | 0.212 0.047 | 0.340 0.094 | 0.029 | 2.8 | 1.7 | -43.3 | 2.1 | 0.4 | 132.0 | |
| 10:00:50.043 | 1:49:45.97 | 0.390 | 2.601 | 0.043 | 0.0 | 0.0 | 0.0 | 0.0 | 0.0 | 0.0 | y |
| 10:00:50.445 0.002 | 2:33:56.26 0.00 | 0.494 0.084 | 0.762 0.155 | 0.046 | 2.4 | 2.0 | -74.7 | 1.7 | 0.8 | 91.8 | |
| 10:00:50.571 0.003 | 2:07:02.02 0.01 | 0.232 0.043 | 0.291 0.068 | 0.025 | 2.4 | 1.6 | -26.8 | 1.5 | 0.0 | 151.4 | |
| 10:00:53.769 0.012 | 2:16:14.85 0.01 | 0.177 0.045 | 0.273 0.087 | 0.028 | 2.6 | 1.8 | -66.5 | 1.9 | 0.3 | 105.1 | |
| 10:00:55.107 0.028 | 1:42:23.26 0.02 | 0.455 0.149 | 1.225 0.470 | 0.097 | 3.0 | 2.7 | -67.5 | 2.5 | 2.0 | 96.6 | |
| 10:00:55.643 0.001 | 1:56:45.52 0.00 | 0.163 0.045 | 0.137 0.053 | 0.030 | 1.9 | 1.4 | -16.4 | 0.2 | 0.0 | 174.1 | |
| 10:00:56.086 0.003 | 1:43:47.13 0.01 | 0.412 0.122 | 0.462 0.184 | 0.080 | 2.1 | 1.6 | 5.8 | 1.1 | 0.0 | 23.1 | |
| 10:00:56.242 0.003 | 2:01:21.32 0.00 | 0.246 0.046 | 0.299 0.071 | 0.027 | 2.2 | 1.7 | -12.0 | 1.1 | 0.5 | 179.0 | |
| 10:00:56.635 0.019 | 2:26:35.63 0.03 | 0.156 0.053 | 0.351 0.142 | 0.034 | 3.0 | 2.3 | -12.1 | 2.3 | 1.6 | 172.0 | |
| 10:00:57.062 0.036 | 2:29:42.53 0.03 | 0.200 0.063 | 0.278 0.114 | 0.041 | 2.1 | 2.0 | 68.9 | 1.4 | 0.6 | 67.5 | |
| 10:00:57.098 0.003 | 2:34:51.97 0.01 | 0.391 0.089 | 0.526 0.153 | 0.055 | 2.3 | 1.8 | -19.1 | 1.3 | 0.8 | 164.9 | |
| 10:00:57.233 0.021 | 2:03:21.54 0.03 | 0.133 0.040 | 0.182 0.070 | 0.026 | 2.9 | 1.5 | -34.3 | 2.2 | 0.0 | 143.5 | |
| 10:00:57.942 0.006 | 1:58:19.15 0.01 | 0.211 0.046 | 0.261 0.073 | 0.028 | 2.4 | 1.6 | -7.8 | 1.5 | 0.0 | 178.7 | |
| 10:00:58.069 | 1:51:28.89 | 2.135 | 10.969 | 0.045 | 0.0 | 0.0 | 0.0 | 0.0 | 0.0 | 0.0 | y |
| 10:00:59.726 0.022 | 2:06:48.26 0.05 | 0.139 0.042 | 0.402 0.139 | 0.027 | 3.5 | 2.5 | -2.1 | 3.0 | 1.9 | 1.7 | |
| 10:01:00.219 0.004 | 1:51:50.38 0.01 | 0.436 0.082 | 0.638 0.147 | 0.047 | 2.3 | 2.0 | -10.1 | 1.4 | 1.1 | 16.4 | |
| 10:01:00.332 0.013 | 1:49:02.30 0.02 | 0.262 0.077 | 0.280 0.112 | 0.051 | 2.2 | 1.5 | -28.8 | 1.1 | 0.0 | 147.3 | |
| 10:01:00.672 0.005 | 2:16:41.12 0.01 | 0.302 0.051 | 0.560 0.112 | 0.028 | 2.5 | 2.2 | -0.5 | 1.7 | 1.4 | 23.5 | |
| 10:01:01.272 0.001 | 2:01:18.01 0.00 | 0.912 0.100 | 1.188 0.140 | 0.029 | 2.2 | 1.8 | -9.9 | 1.2 | 0.7 | 7.7 | |
| 10:01:01.315 0.029 | 2:21:59.03 0.01 | 0.185 0.048 | 0.412 0.127 | 0.030 | 3.2 | 2.1 | 73.4 | 2.8 | 0.9 | 72.4 | |
| 10:01:02.384 0.010 | 2:05:28.57 0.02 | 0.515 0.067 | 1.541 0.213 | 0.029 | 3.5 | 2.6 | 6.2 | 3.0 | 2.0 | 11.3 | |
| 10:01:03.790 0.030 | 1:55:33.48 0.01 | 0.177 0.059 | 0.311 0.129 | 0.038 | 2.8 | 1.9 | -85.5 | 2.3 | 0.4 | 89.5 | |
| 10:01:04.521 0.001 | 2:02:03.58 0.00 | 1.162 0.123 | 1.386 0.153 | 0.028 | 2.0 | 1.8 | -34.0 | 0.9 | 0.6 | 86.8 | |
| 10:01:07.065 0.016 | 2:22:39.05 0.00 | 0.145 0.046 | 0.197 0.083 | 0.031 | 2.9 | 1.4 | -78.8 | 2.4 | 0.0 | 97.1 | |
| 10:01:07.169 0.003 | 2:38:05.12 0.00 | 0.429 0.103 | 0.262 0.091 | 0.071 | 1.5 | 1.3 | -42.7 | 0.0 | 0.0 | 0.0 | |
| 10:01:07.976 0.003 | 2:22:25.96 0.00 | 0.169 0.047 | 0.133 0.053 | 0.032 | 1.6 | 1.5 | 63.0 | 0.0 | 0.0 | 0.0 | |
| 10:01:08.992 0.003 | 2:28:15.88 0.00 | 0.444 0.077 | 0.628 0.133 | 0.043 | 2.4 | 1.8 | -1.4 | 1.5 | 0.7 | 9.7 | |
| 10:01:09.243 0.001 | 2:22:55.07 0.00 | 0.476 0.065 | 0.600 0.097 | 0.031 | 2.4 | 1.6 | -19.4 | 1.5 | 0.0 | 162.3 | |
| 10:01:09.272 | 2:17:20.83 | 1.888 | 3.688 | 0.030 | 0.0 | 0.0 | 0.0 | 0.0 | 0.0 | 0.0 | y |
| 10:01:10.630 0.006 | 2:24:58.37 0.01 | 0.406 0.067 | 0.636 0.125 | 0.036 | 2.2 | 2.2 | 24.9 | 1.5 | 1.1 | 67.0 | |
| 10:01:10.764 0.002 | 2:02:04.05 0.00 | 0.373 0.059 | 0.453 0.089 | 0.032 | 2.2 | 1.7 | -23.8 | 1.1 | 0.6 | 155.3 | |
| 10:01:11.710 0.001 | 2:12:50.24 0.00 | 0.143 0.043 | 0.155 0.062 | 0.028 | 2.1 | 1.6 | -25.9 | 0.9 | 0.0 | 150.3 | |
| 10:01:12.060 0.002 | 2:41:06.75 0.00 | 1.629 0.214 | 3.194 0.465 | 0.094 | 3.0 | 2.0 | 8.9 | 2.4 | 1.0 | 14.8 | |
| 10:01:12.967 0.025 | 2:24:23.09 0.04 | 0.148 0.055 | 0.537 0.225 | 0.037 | 3.7 | 3.0 | -7.8 | 3.2 | 2.5 | 176.2 | |
| 10:01:13.593 0.002 | 2:06:53.63 0.00 | 0.398 0.059 | 0.581 0.102 | 0.030 | 2.2 | 2.1 | -2.5 | 1.4 | 1.1 | 56.4 | |
| 10:01:13.526 | 1:54:32.64 | 1.034 | 5.779 | 0.045 | 0.0 | 0.0 | 0.0 | 0.0 | 0.0 | 0.0 | y |
| 10:01:14.846 | 2:02:08.54 | 1.237 | 4.046 | 0.032 | 0.0 | 0.0 | 0.0 | 0.0 | 0.0 | 0.0 | y |
| 10:01:15.510 0.024 | 2:17:19.67 0.02 | 0.188 0.049 | 0.602 0.177 | 0.031 | 3.4 | 2.8 | 49.5 | 3.0 | 2.1 | 53.2 | |
| 10:01:16.537 0.001 | 1:50:50.42 0.00 | 0.890 0.113 | 0.890 0.132 | 0.049 | 2.1 | 1.5 | -22.4 | 0.9 | 0.0 | 158.2 | |
| 10:01:17.207 0.003 | 2:15:59.81 0.00 | 0.159 0.047 | 0.216 0.082 | 0.030 | 2.2 | 1.9 | 19.3 | 1.4 | 0.6 | 40.7 | |
| 10:01:17.659 0.001 | 1:44:16.12 0.00 | 0.413 0.122 | 0.402 0.163 | 0.081 | 1.9 | 1.6 | -17.9 | 0.3 | 0.0 | 24.6 | |
| 10:01:17.967 0.006 | 2:29:02.36 0.01 | 0.335 0.074 | 0.419 0.120 | 0.046 | 2.4 | 1.6 | -33.8 | 1.5 | 0.0 | 141.3 | |
| 10:01:18.465 0.006 | 2:05:38.77 0.01 | 0.160 0.045 | 0.197 0.073 | 0.029 | 2.0 | 1.9 | 86.6 | 1.2 | 0.2 | 72.2 | |
| 10:01:19.572 0.010 | 1:55:16.25 0.01 | 0.387 0.072 | 0.935 0.198 | 0.041 | 3.0 | 2.5 | -76.8 | 2.5 | 1.7 | 94.2 | |
| 10:01:20.062 0.000 | 2:34:43.76 0.00 | 8.706 0.876 | 10.738 1.085 | 0.064 | 2.1 | 1.8 | 10.8 | 1.2 | 0.3 | 36.6 | |
| 10:01:22.455 0.003 | 2:01:12.44 0.00 | 2.776 0.283 | 9.160 0.938 | 0.037 | 4.0 | 2.5 | 42.5 | 3.6 | 1.7 | 44.7 | |
| 10:01:24.096 0.001 | 2:17:06.37 0.00 | 0.836 0.095 | 1.657 0.200 | 0.031 | 2.9 | 2.1 | -63.6 | 2.3 | 1.2 | 108.8 | |
| 10:01:24.037 0.001 | 2:20:04.84 0.00 | 0.500 0.068 | 0.551 0.089 | 0.032 | 2.1 | 1.6 | -31.2 | 0.9 | 0.0 | 139.1 | |
| 10:01:25.477 0.001 | 2:28:40.08 0.00 | 0.234 0.066 | 0.208 0.081 | 0.044 | 1.7 | 1.6 | 70.5 | 0.6 | 0.0 | 67.8 | |
| 10:01:27.991 0.004 | 2:40:29.08 0.01 | 0.816 0.167 | 1.605 0.394 | 0.099 | 2.9 | 2.0 | 32.5 | 2.4 | 0.8 | 38.3 | |
| 10:01:28.622 0.005 | 1:57:30.58 0.01 | 0.274 0.059 | 0.291 0.083 | 0.037 | 2.3 | 1.4 | -36.7 | 1.3 | 0.0 | 137.6 | |
| 10:01:28.868 0.001 | 2:01:28.52 0.00 | 0.274 0.058 | 0.304 0.085 | 0.036 | 2.0 | 1.7 | -46.2 | 0.9 | 0.0 | 102.3 | |
| 10:01:29.965 0.013 | 2:17:05.15 0.01 | 0.184 0.050 | 0.221 0.079 | 0.032 | 2.2 | 1.7 | 76.1 | 1.5 | 0.0 | 72.9 | |
| 10:01:30.744 0.004 | 2:19:05.52 0.00 | 0.542 0.073 | 0.792 0.122 | 0.033 | 2.4 | 1.8 | -61.9 | 1.6 | 0.4 | 106.1 | |
| 10:01:31.149 0.000 | 2:29:24.74 0.00 | 2.908 0.300 | 4.156 0.437 | 0.049 | 2.3 | 1.9 | -14.9 | 1.3 | 1.0 | 176.9 | |
| 10:01:31.229 0.001 | 2:26:37.68 0.00 | 3.433 0.350 | 7.480 0.769 | 0.045 | 2.8 | 2.4 | 15.6 | 2.2 | 1.6 | 30.1 | |
| 10:01:31.491 0.001 | 2:26:40.53 0.00 | 3.709 0.377 | 8.432 0.864 | 0.046 | 3.0 | 2.3 | 18.6 | 2.4 | 1.5 | 26.7 | |
| 10:01:32.137 0.003 | 2:04:28.26 0.01 | 0.331 0.060 | 0.481 0.107 | 0.034 | 2.4 | 1.8 | -17.1 | 1.5 | 0.8 | 167.0 | |
| 10:01:33.016 0.012 | 2:21:09.78 0.02 | 0.810 0.098 | 0.882 0.122 | 0.039 | 2.1 | 1.6 | -25.8 | 0.9 | 0.0 | 150.6 | |
| 10:01:33.474 0.012 | 2:15:20.92 0.02 | 0.215 0.053 | 0.242 0.080 | 0.034 | 2.0 | 1.7 | -40.9 | 0.8 | 0.2 | 105.5 | |
| 10:01:34.216 0.001 | 2:09:17.51 0.00 | 0.516 0.071 | 0.522 0.086 | 0.034 | 1.8 | 1.7 | 24.3 | 0.7 | 0.0 | 58.0 | |
| 10:01:34.332 0.018 | 2:20:36.88 0.06 | 0.226 0.058 | 0.227 0.079 | 0.038 | 2.2 | 1.4 | -27.3 | 1.1 | 0.0 | 150.3 | |
| 10:01:36.465 0.018 | 2:26:41.57 0.06 | 0.227 0.067 | 0.882 0.290 | 0.045 | 4.6 | 2.6 | -16.3 | 4.2 | 2.0 | 164.2 | |
| 10:01:36.699 0.008 | 2:23:23.56 0.00 | 0.231 0.065 | 0.302 0.111 | 0.042 | 2.3 | 1.8 | -60.2 | 1.5 | 0.4 | 104.9 | |
| 10:01:37.784 0.001 | 1:48:11.73 0.00 | 1.301 0.171 | 2.150 0.320 | 0.076 | 2.9 | 1.7 | -36.0 | 2.2 | 0.5 | 141.1 | |
| 10:01:38.373 0.002 | 2:02:58.25 0.00 | 0.237 0.058 | 0.243 0.079 | 0.037 | 2.0 | 1.6 | -12.8 | 0.7 | 0.0 | 6.6 | |
| 10:01:39.138 | 1:51:41.03 | 2.021 | 7.092 | 0.068 | 0.0 | 0.0 | 0.0 | 0.0 | 0.0 | 0.0 | y |
| 10:01:39.747 0.013 | 2:25:48.86 0.01 | 0.255 0.070 | 0.519 0.172 | 0.044 | 2.8 | 2.2 | 70.1 | 2.3 | 1.1 | 69.3 | |
| 10:01:41.042 0.018 | 1:59:03.86 0.01 | 0.314 0.069 | 0.928 0.231 | 0.042 | 3.5 | 2.5 | 77.3 | 3.1 | 1.6 | 75.8 | |
| 10:01:41.442 0.007 | 2:31:57.00 0.01 | 0.457 0.119 | 0.627 0.209 | 0.075 | 2.4 | 1.8 | 53.1 | 1.8 | 0.0 | 57.1 | |
| 10:01:42.645 0.007 | 2:07:52.87 0.00 | 0.629 0.081 | 0.766 0.114 | 0.035 | 2.0 | 1.8 | -29.0 | 0.8 | 0.6 | 80.6 | |
| 10:01:43.455 0.001 | 2:21:34.70 0.00 | 1.102 0.124 | 1.401 0.170 | 0.039 | 2.2 | 1.8 | -31.2 | 1.1 | 0.8 | 135.5 | |
| 10:01:44.486 0.023 | 2:13:46.09 0.03 | 0.231 0.060 | 0.414 0.134 | 0.039 | 3.4 | 1.6 | -40.9 | 2.8 | 0.0 | 136.9 | |
| 10:01:44.824 0.003 | 2:04:09.08 0.00 | 0.652 0.087 | 0.856 0.134 | 0.040 | 2.2 | 1.8 | -37.2 | 1.2 | 0.7 | 124.6 | |
| 10:01:47.354 0.000 | 2:03:14.13 0.00 | 4.588 0.463 | 5.998 0.609 | 0.042 | 2.1 | 1.9 | -29.1 | 1.0 | 0.9 | 83.1 | |
| 10:01:47.307 0.008 | 1:52:58.07 0.00 | 0.508 0.109 | 0.741 0.200 | 0.066 | 2.4 | 1.8 | -78.4 | 1.7 | 0.0 | 92.2 | |
| 10:01:49.604 0.005 | 2:33:34.97 0.01 | 1.340 0.184 | 2.964 0.449 | 0.085 | 3.0 | 2.3 | 51.3 | 2.5 | 1.3 | 54.7 | |
| 10:01:51.620 0.013 | 2:25:31.88 0.02 | 0.293 0.080 | 0.791 0.252 | 0.051 | 3.0 | 2.7 | -40.1 | 2.4 | 2.1 | 122.4 | |
| 10:01:52.578 0.009 | 2:19:54.33 0.01 | 0.345 0.069 | 0.506 0.127 | 0.041 | 2.3 | 1.9 | 71.4 | 1.7 | 0.1 | 69.7 | |
| 10:01:53.456 0.000 | 2:11:52.58 0.00 | 2.231 0.233 | 2.389 0.258 | 0.046 | 2.0 | 1.6 | -22.5 | 0.6 | 0.0 | 158.8 | |
| 10:01:53.930 0.009 | 2:05:38.60 0.00 | 0.242 0.065 | 0.324 0.111 | 0.041 | 2.2 | 1.9 | 70.8 | 1.5 | 0.0 | 69.1 | |
| 10:01:54.092 0.002 | 2:06:07.34 0.00 | 0.327 0.067 | 0.370 0.099 | 0.041 | 2.2 | 1.6 | -29.9 | 1.1 | 0.0 | 144.5 | |
| 10:01:55.186 0.003 | 2:27:42.19 0.01 | 0.301 0.089 | 0.308 0.124 | 0.059 | 2.0 | 1.6 | -8.9 | 0.7 | 0.0 | 13.1 | |
| 10:01:55.511 0.002 | 2:03:58.44 0.00 | 0.383 0.075 | 0.556 0.135 | 0.044 | 2.5 | 1.8 | -44.8 | 1.7 | 0.7 | 126.3 | |
| 10:02:00.741 0.002 | 2:07:32.74 0.00 | 0.243 0.069 | 0.188 0.077 | 0.048 | 1.6 | 1.4 | 20.7 | 0.0 | 0.0 | 0.0 | |
| 10:02:01.198 | 2:13:24.27 | 0.830 | 4.697 | 0.049 | 0.0 | 0.0 | 0.0 | 0.0 | 0.0 | 0.0 | y |
| 10:02:02.564 0.020 | 2:01:45.00 0.03 | 0.285 0.085 | 0.487 0.179 | 0.054 | 2.7 | 2.0 | -27.7 | 1.9 | 1.2 | 150.1 | |
| 10:02:02.870 0.014 | 2:00:26.27 0.02 | 0.280 0.088 | 0.727 0.268 | 0.057 | 3.3 | 2.4 | -48.0 | 2.7 | 1.7 | 126.9 | |
| 10:02:05.467 0.002 | 1:57:41.96 0.00 | 0.420 0.098 | 0.277 0.093 | 0.067 | 1.6 | 1.2 | -5.7 | 0.0 | 0.0 | 0.0 | |
| 10:02:08.542 0.013 | 2:01:50.64 0.01 | 0.332 0.100 | 0.371 0.150 | 0.066 | 2.3 | 1.5 | 60.6 | 1.6 | 0.0 | 62.2 | |
| 10:02:09.062 0.001 | 2:16:02.50 0.00 | 3.873 0.395 | 4.977 0.516 | 0.055 | 2.1 | 1.9 | 73.7 | 1.4 | 0.1 | 69.9 | |
| 10:02:09.152 0.003 | 2:23:34.91 0.00 | 0.381 0.113 | 0.361 0.149 | 0.076 | 1.9 | 1.5 | -57.3 | 0.7 | 0.0 | 100.2 | |
| 10:02:09.299 0.005 | 2:00:55.56 0.00 | 0.383 0.119 | 0.452 0.186 | 0.078 | 2.2 | 1.7 | 60.7 | 1.5 | 0.0 | 62.9 | |
| 10:02:10.109 0.005 | 2:16:37.99 0.00 | 0.477 0.097 | 0.654 0.168 | 0.058 | 2.2 | 1.9 | -58.7 | 1.3 | 0.7 | 97.3 | |
| 10:02:10.333 0.003 | 2:03:49.77 0.01 | 0.312 0.091 | 0.282 0.116 | 0.062 | 2.1 | 1.3 | 23.7 | 1.2 | 0.0 | 34.0 | |
| 10:02:20.898 0.009 | 2:22:21.00 0.04 | 0.400 0.125 | 0.801 0.307 | 0.082 | 3.4 | 1.8 | -13.9 | 2.8 | 0.8 | 167.4 | |
| 10:02:24.144 0.001 | 2:16:21.35 0.00 | 6.249 0.633 | 9.730 0.994 | 0.069 | 2.5 | 1.9 | 75.9 | 1.9 | 0.1 | 73.4 | |
| 10:02:27.036 0.002 | 2:21:19.37 0.00 | 0.575 0.146 | 0.795 0.259 | 0.093 | 2.7 | 1.6 | 81.1 | 2.2 | 0.0 | 78.6 | |
| 10:02:28.775 0.002 | 2:17:21.91 0.00 | 1.804 0.216 | 3.418 0.445 | 0.081 | 2.6 | 2.2 | 81.4 | 2.0 | 1.1 | 76.4 | |
| 10:02:29.728 | 2:09:09.87 | 0.691 | 3.931 | 0.084 | 0.0 | 0.0 | 0.0 | 0.0 | 0.0 | 0.0 | y |
| 10:02:33.180 0.003 | 2:17:52.76 0.00 | 0.461 0.129 | 0.376 0.148 | 0.087 | 1.7 | 1.5 | -10.3 | 0.0 | 0.0 | 0.0 |
Note. — Radio sources with multiple Gaussian fits are flagged by an ’y’ and listed separately in Tab. 4. For these sources no uncertainties in the coordinates and flux densities were determined (indicated by ’’). The uncertainty for the absolute coordinates is of the order of 0.05′′ as derived from comparison between the results from SAD and SFIND (see also section 3).
| Slower | Supper | S | Nobs | Neff | dN/dS(/S-2.5) |
|---|---|---|---|---|---|
| [mJy] | [mJy] | [mJy] | [sr-1 Jy1.5] | ||
| 0.090 | 0.225 | 0.184 | 41 | 209.0 | 2.781.31 |
| 0.225 | 0.319 | 0.279 | 40 | 87.5 | 4.691.07 |
| 0.319 | 0.472 | 0.390 | 40 | 62.2 | 4.770.98 |
| 0.472 | 0.810 | 0.609 | 41 | 55.3 | 5.861.17 |
| 0.810 | 1.660 | 1.090 | 40 | 49.2 | 8.821.94 |
| 1.660 | 13.10 | 4.860 | 40 | 44.0 | 24.99.96 |
Note. — Radio sources counts derived for the VLA-COSMOS field using equations 5 to 8 to correct for the weighting and resolution effect. In Fig. 7, the comparison to source counts from other radio deep field survey is shown. The integrated fluxes were used to derive the Euclidean normalized source counts dN/dS(/S-2.5).
| ID# | R.A.center | Dec.center | R.A.peak | Dec.peak | # of Fits |
|---|---|---|---|---|---|
| 1 | 09:58:23.271 | 2:08:59.04 | 09:58:23.271 | 2:08:57.63 | 4 |
| 12 | 09:58:48.492 | 1:58:33.59 | 09:58:48.461 | 1:58:33.59 | 2 |
| 39 | 09:59:29.293 | 2:28:45.58 | 09:59:29.230 | 2:28:45.11 | 2 |
| 56 | 09:59:46.350 | 2:36:02.25 | 09:59:46.194 | 2:36:03.19 | 3 |
| 61 | 09:59:49.756 | 1:56:50.37 | 09:59:49.912 | 1:56:50.37 | 2 |
| 70 | 09:59:57.931 | 2:18:10.66 | 09:59:57.994 | 2:18:09.72 | 2 |
| 120 | 10:00:27.534 | 2:21:22.91 | 10:00:27.659 | 2:21:21.03 | 6 |
| 123 | 10:00:29.478 | 2:41:21.43 | 10:00:29.416 | 2:40:38.66 | 11 |
| 134 | 10:00:43.146 | 1:46:07.89 | 10:00:43.177 | 1:46:07.89 | 8 |
| 138 | 10:00:47.631 | 1:59:09.98 | 10:00:47.599 | 1:59:00.58 | 3 |
| 140 | 10:00:47.602 | 2:09:58.11 | 10:00:47.570 | 2:09:58.58 | 2 |
| 141 | 10:00:49.134 | 1:49:21.06 | 10:00:49.604 | 1:49:23.88 | 5 |
| 146 | 10:00:50.074 | 1:49:45.03 | 10:00:50.043 | 1:49:45.97 | 2 |
| 159 | 10:00:58.163 | 1:51:35.47 | 10:00:58.069 | 1:51:28.89 | 5 |
| 174 | 10:01:09.303 | 2:17:21.77 | 10:01:09.272 | 2:17:20.83 | 2 |
| 181 | 10:01:14.059 | 1:54:42.04 | 10:01:13.526 | 1:54:32.64 | 4 |
| 182 | 10:01:14.877 | 2:02:15.59 | 10:01:14.846 | 2:02:08.54 | 7 |
| 213 | 10:01:39.263 | 1:51:38.68 | 10:01:39.138 | 1:51:41.03 | 2 |
| 232 | 10:02:01.198 | 2:13:27.56 | 10:02:01.198 | 2:13:24.27 | 3 |
| 246 | 10:02:29.947 | 2:09:10.81 | 10:02:29.728 | 2:09:09.87 | 3 |
Note. — Radio sources with multiple Gaussian fits which are flagged in Tab. 2. We give their identification number (ID) in Tab. 2, the (J2000.0) coordinates of the approximate center of the radio group (R.A.center,Dec.center), the (J2000.0) coordinates of the emission peak of the radio group (R.A.peak,Dec.peak), as well as the number of Gaussian fits/components found by SFIND.