Very high energy gamma rays from the direction of Sagittarius A∗
We report the detection of a point-like source of very high energy (VHE) -rays coincident within of Sgr A∗, obtained with the H.E.S.S. array of Cherenkov telescopes. The -rays exhibit a power-law energy spectrum with a spectral index of and a flux above the 165 GeV threshold of m-2s-1. The measured flux and spectrum differ substantially from recent results reported in particular by the CANGAROO collaboration.
;
Key Words.:
gamma-rays: observations – Galaxy: centre1 Introduction
The Galactic Centre (GC) region (Melia & Falcke Melia (2001)) harbours a variety of potential sources of high-energy radiation including the supermassive black hole Sgr A∗ of M⊙ (see e.g. Schödel et al. Schoedel (2002)), which has been identified as a faint source of X-rays (Baganoff et al. Baganoff (2003)) and infrared radiation (Genzel et al. Genzel_flare (2003)). Emission from Sgr A∗ is presumably powered by the energy released in the accretion of stellar winds onto the black hole (Melia Melia92 (1992); Yusef-Zadeh et al. Yusef (2000); Yuan et al. yuan03 (2003)).
High (Mayer-Hasselwander et al. egret (1998)) and very high (Tsuchiya et al. CANGAROO (2004); Kosack et al. VERITAS (2004)) energy -ray emission have also been detected from the GC region. The -radiation could result from acceleration of electrons or protons in shocks in these winds, in the accretion flow or in nearby supernova remnants, followed by interactions of accelerated particles with ambient matter or radiation. Alternative mechanisms include the annihilation of dark matter particles accumulating at the GC (Bergström et al. DM1 (1998); Ellis et al. Ellis (2002); Gnedin & Primack Primack (2003)) or curvature radiation of protons near the black hole (Levinson Levinson (2000)).
2 Observations and Results
The observations presented here were obtained in Summer 2003 with the High Energy Stereoscopic System (H.E.S.S.), consisting of four imaging atmospheric Cherenkov telescopes (Hofmann HESS (2003); Bernlöhr et al. optics (2003); Vincent et al. camera (2003)) in Namibia, at S E. At this time, two of the four telescopes were operational, the other two being under construction. During the first phase of the measurements (June 6 to July 7, 2003), the telescopes were operated independently and images were combined offline using GPS time stamps (4.7 h on source, ‘June/July’ data set). In the second phase (July 22 to August 29, 2003), a hardware coincidence required shower images simultaneously in both telescopes (11.8 h on source, ‘July/August’ data set). The resulting background suppression allowed us to lower the telescope trigger thresholds, yielding a post-cuts energy threshold of 165 GeV (for typical Sgr A∗ zenith angles of ) as compared to 255 GeV for the ‘June/July’ data set.
Shower images are parametrised by their centres of gravity and second moments, followed by the stereoscopic reconstruction of shower geometry, providing an angular resolution of for individual -rays. -ray candidates are selected based on the shape of shower images, allowing effective suppression of cosmic-ray showers. The -ray energy is estimated from the image intensity and the reconstructed shower geometry, with a typical resolution of 15-20%.
The GC region is characterised by high night-sky brightness (NSB), varying across the field of view and potentially interfering with image reconstruction. Simulations of a range of NSB levels show, however, that the stereoscopic reconstruction is insensitive to this feature, resulting in variations of the measured flux and spectrum that are well within the systematic errors quoted here.
The performance and stability of H.E.S.S. have been confirmed by observations of the Crab Nebula (a standard candle in -ray astronomy). The absolute calibration of the instrument has been verified using muon images (Leroy et al. Muon (2003)) which provide a measurement of the absolute photon detection efficiency, and by the measured cosmic ray detection rates (Funk et al. Trigger (2004)), which are in excellent agreement with simulations.
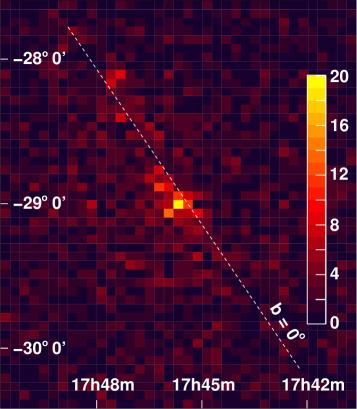
Fig. 1 shows the distribution of -ray candidates for a window around Sgr A∗. A clear excess of events in the Sgr A∗ region is observed. Here, tight -ray selection cuts are applied to minimise background at the expense of -ray efficiency. For the analysis of the flux and spectrum of the central point source, looser cuts are used which reject 96% of the cosmic-ray background and retain 50% of the -rays. Using a ring around the assumed source location to estimate background, we find – with loose cuts – a 6.1 excess in the ‘June/July’ data set and a 9.2 excess in the ‘July/August’ data set, both centred on Sgr A∗. The -ray excess is located at RA , Dec , or , , within in and in from Sgr A∗ (Fig. 2). There is no evidence in our data for an energy dependence of this position. A conservative pointing error of less than in RA and Dec has been estimated using stars (Gillessen et al. Gillessen (2003)), and verified by reconstructing the location of known VHE sources such as the Crab Nebula and the AGN PKS 2155-304.
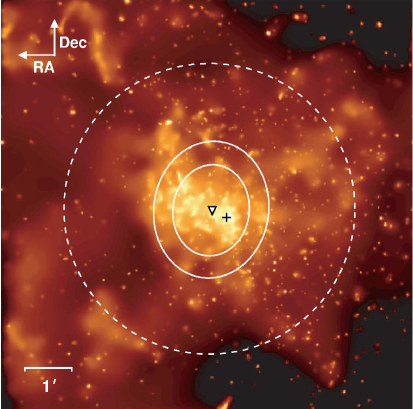
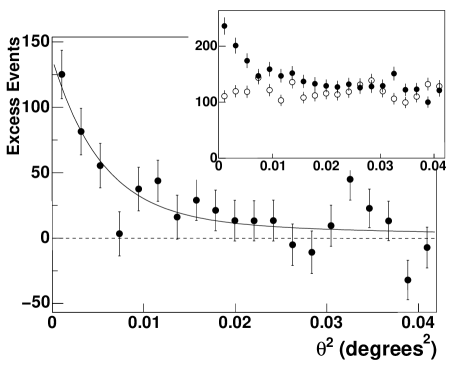
Given the high density of potential sources over the central square degree of the Galaxy, an important question is whether the VHE -ray signal shows signs of source extension. Fig. 3 shows the angular distribution of detected -rays relative to Sgr A∗. The width and shape of this distribution are consistent with point source simulations. These simulations have been verified using the strong signals from the Crab Nebula and PKS 2155-304. Assuming a Gaussian distribution of source brightness, , we find an upper limit for the source size (95% CL), corresponding to pc at the distance of the GC (dashed white line in Fig. 2). The apparent point-like nature of the central source does not exclude the possibility of non-azimuthally symmetric tails in the emission.
The measured energy spectrum is shown in Fig. 4. Data are fit by a power-law, , with a spectral index and m-2s-1TeV-1 for the ‘July/August’ data set (full circles), with a /d.o.f. of 0.6. The flux above the 165 GeV threshold is m-2s-1, equivalent to 5% of the Crab Nebula flux at this threshold. The smaller ‘June/July’ data set gives consistent results ( and m-2s-1TeV-1). We estimate systematic errors of and , with the latter mainly governed by the precision of the energy calibration of the instrument. The energy reconstruction and flux determination have been tested with the Crab Nebula; we reconstruct a power law with index and a flux above 1 TeV of m-2s-1 for the Crab, in very good agreement with previous measurements (see Aharonian et al. Aharonian (2000) and references therein). Fitting the GC -ray spectrum as a power law with an exponential cutoff, we find a lower limit for the cutoff energy of 4 TeV. Within statistics, there are no indications for time variability of the GC signal.
3 Discussion and Conclusions
The CANGAROO collaboration recently reported the detection of sub-TeV gamma rays from within of the GC based on 67 h of (on-source) data taken in July 2001 and July/August 2002 (Tsuchiya et al. CANGAROO (2004)). The reported spectrum is very steep, . The rather hard H.E.S.S. spectra are obviously not consistent with the steep spectrum obtained with CANGAROO-II (Fig. 4); the large flux at low energies implied by the CANGAROO result would have been detected with H.E.S.S. in a matter of minutes. At higher energies, above 2.8 TeV, a marginal detection with a significance of 3.7 resulting from 26 h of large-zenith-angle observations in the years 1995 through 2003 was reported by the Whipple collaboration (Kosack et al. VERITAS (2004)), consistent with Sgr A∗ within the 95% C.L. error circle. The Whipple flux is a factor 3 above that implied by our spectra. Taking all data at face value, one would conclude that the source underwent significant changes over the timescale of one year (2002 to 2003). However, this seems unlikely since none of the individual experiments detects significant variability. Implications of the CANGAROO and Whipple data are discussed in Hooper et al. (silk (2004)).
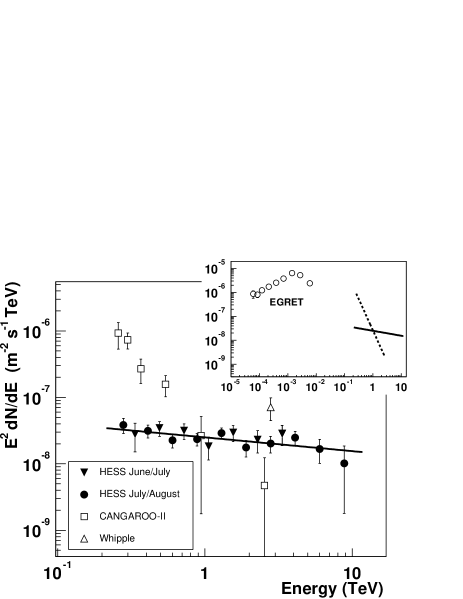
At lower energies around 100 MeV, the EGRET instrument detected a strong excess from the central part of the Galaxy (Mayer-Hasselwander et al. egret (1998)), consistent within its error circle with Sgr A∗, but with angular resolution of also covering other potential sources (and a solid angle 100 times larger than the emission region seen by H.E.S.S.). In the analysis of a high-energy sub-sample of EGRET data (Hooper & Dingus egret_reana (2002)), the source was found to be offset from the GC by , excluding Sgr A∗ at 99.9% C.L.
Models for the wide-band spectra of Sgr A∗ include Advection Dominated Accretion Flow (ADAF) models (Narayan et al. Narayan98 (1998); Yuan et al. yuan03 (2003)), possibly combined with a jet extracting energy from the accretion disk (Yuan et al. Falcke (2002)). Shocks in the accretion flow (Markoff et al. Markoff (1997)) or in the jet could accelerate particles. -rays are generated in proton interactions, but predicted spectra tend to fall off rapidly in the TeV region (Markoff et al. Markoff (1997)).
Another source of VHE -rays should be diffuse emission from the entire central region, in which case year time-scale variability should not occur. -rays may result from interactions of accelerated protons and nuclei (Fatuzzo & Melia fatuzzo03 (2003)) with the ambient matter with a density as large as (Maeda et al. Maeda (2002)). Only modest overall energy, , in TeV protons is needed to explain the observed -ray flux from this region (the 1-10 TeV luminosity is ergs/s). An obvious candidate for the proton accelerator could be the young ( yr) and unusually powerful (total explosion energy ) supernova remnant Sgr A East (Maeda et al. Maeda (2002)). The measured spectral index of TeV emission, , is close to the spectrum of shock-accelerated particles. For a yr source age, the modest source extension and the hard spectrum imply that particle diffusion in the central region proceeds much slower compared to the diffusion in the Galactic Disk. While detailed modelling remains to be done, estimates show that for magnetic fields up to 1 mG the X-ray and radio emission resulting from secondary electrons generated in interactions of such accelerated protons are below the measured diffuse luminosities integrated over Sgr A East. This consistency criterion is, however, much more challenging if one considers Sgr A* as the source, with its significantly larger magnetic fields and lower (quiescent-state) X-ray flux. In either case, the explanation of the EGRET flux (Fig. 4) requires a second source component with a cutoff close to the highest EGRET energies, located well within the H.E.S.S. field of view (and therefore excluded as a strong TeV source), but not necessarily coincident with Sgr A East or Sgr A*. We note that Tsuchiya et al. (CANGAROO (2004)) describe the EGRET and CANGAROO fluxes jointly in a model of a diffuse proton flux with a spectral cutoff of a few TeV, interacting with ambient gas. In such a model, one would, however, not expect fast variability.
Alternative mechanisms invoke the hypothetical annihilation of super-symmetric dark matter particles (Bergström et al. DM1 (1998); Ellis et al Ellis (2002); Gnedin & Primack Primack (2003)) or curvature radiation of protons in the vicinity of the central super-massive black hole (Levinson Levinson (2000)).
The spectrum of -rays from hypothetical annihilation of neutralinos of mass consists of a -ray continuum and two lines at and . The continuum spectra generated by the DarkSusy program (Gondolo et al. DarkSusy (2004)) are well approximated by with and depending on the annihilation channel 111Bergström et al. (DM1 (1998)) use and to describe spectra for , but with larger values a better fit up to is obtained.. Assuming that the observed -rays represent a continuum annihilation spectrum, the lower limit of 4 TeV on the cutoff implies TeV, a range which is presently disfavoured due to particle physics and cosmology arguments (Ellis et al. EllisWMAP (2003)). Supersymmetric dark matter annihilation as the main source of the observed -rays is therefore unlikely, but not excluded.
The spectrum of the proton curvature radiation (Levinson Levinson (2000)) depends, to a large extent, on the configuration of magnetic fields near the gravitational radius of the black hole, and detailed predictions are lacking; as a characteristic feature, one would expect time variability. Further observations of the GC region are a high priority for H.E.S.S. in the near future.
Acknowledgements.
The support of the Namibian authorities and of the University of Namibia in facilitating the construction and operation of H.E.S.S. is gratefully acknowledged, as is the support by the German Ministry for Education and Research (BMBF), the Max Planck Society, the French Ministry for Research, the CNRS-IN2P3 and the Astroparticle Interdisciplinary Programme of the CNRS, the U.K. Particle Physics and Astronomy Research Council (PPARC), the IPNP of the Charles University, the South African Department of Science and Technology and National Research Foundation, and by the University of Namibia. We appreciate the excellent work of the technical support staff in Berlin, Durham, Hamburg, Heidelberg, Palaiseau, Paris, Saclay, and in Namibia in the construction and operation of the equipment.References
- (1) Aharonian, F.A., Akhperjanian, A.G., Barrio, J.A, et al. 2000, ApJ, 539, 317
- (2) Baganoff, F.K., Maeda, Y., Morris, M., et al. 2003, ApJ, 591, 891
- (3) Bergström, L., Ullio, P., & Buckley, J.H., 1998, APh. 9, 137
- (4) Bernlöhr, K., Carrol, O., Cornils, R., et al. 2003, APh., 20, 111
- (5) Ellis, J.R., Feng, J.L., Ferstl, A., Matchev, K.T., Olive, K.A., 2002, Eur. Phys. J., C24, 311
- (6) Ellis, J., Olive, K.A., Santoso, Y., Spanos, V.C., 2003, Phys. Letters B 565, 176
- (7) Fatuzzo, M., Melia, F., 2003, ApJ, 596, 1035
- (8) Funk, S., Hermann, G., Hinton, J., et al, 2004, submitted to Astroparticle Physics
- (9) Genzel, R., Schödel, R., Ott, T., et al. 2003, Nature, 425, 934
- (10) Gillessen, S., for the H.E.S.S. collaboration, 2003 Proc. 28th ICRC, Tsukuba, Univ. Academy Press, Tokyo, p. 2899
- (11) Gnedin, O.Y., Primack, J.R., 2003, Phys. Rev. Lett., submitted (astro-ph/0308385)
- (12) Gondolo, P., Edsjö, J., Bergström, L., Ullio, P., Baltz, E.A., 2004, (http://www.physto.se/edsjo/darksusy/)
- (13) Hofmann, W., 2003, Proc. 28th ICRC, Tsukuba, Univ. Academy Press, Tokyo, p. 2811
- (14) Hooper, D., Dingus, B., 2002, (astro-ph/0212509)
- (15) Hooper, D., de la Calle Perez, I., Silk, J., Ferrer, F., Sarkar, S., 2004, (astro-ph/0404205)
- (16) Kosack, K., Badran, H.M., Bond, H.I., et al. 2004, ApJ, 608, L97
- (17) Leroy, N., Bolz, O., Guy, J., et al., 2003, Proc. 28th ICRC, Tsukuba, Univ. Academy Press, Tokyo, p. 2895
- (18) Levinson, A., 2000, Phys. Rev. Lett., 85, 912
- (19) Maeda, Y., Baganoff, F.K., Feigelson, E.D., et al. 2002, ApJ, 570, 671
- (20) Markoff, S., Melia, F., Sarcevic, I., 1997, ApJ, 489, L47
- (21) Mayer-Hasselwander, H.A., Bertsch, D.L., Dingus, B.L., et al., 1998, A&A, 335, 161
- (22) Melia, F., 1992, ApJ, 387, L25
- (23) Melia, F., Falcke, H., 2001, ARA&A, 39, 309
- (24) Muno, M.P., Baganoff, F.K., Bautz, W.M., et al., 2003, ApJ, 589, 225
- (25) Narayan, R., Mahadevan, R., Grindlay, J.E., Popham, R.G., Gammie, C., 1998, ApJ, 492, 554
- (26) Schödel, R., R., Ott, T., Genzel, R., et al. 2002, Nature, 419, 694
- (27) Tsuchiya, K., Enomoto, R., Ksenofontov, L.T., et al. 2004, ApJ, 606, L115
- (28) Vincent, P., Denance, J.-P., Huppert, J.-F., et al. 2003, Proc. 28th ICRC, Tsukuba, Univ. Academy Press, Tokyo, p. 2887
- (29) Yuan, F., Markoff, S., Falcke, H., 2002, A&A, 383, 854
- (30) Yuan, F., Quataert, E., Narayan, R., 2003, ApJ 598, 301
- (31) Yusef-Zadeh, F., Melia, F., Wardle, M., 2000, Science, 287, 85