The buried Balmer-edge signatures from quasars222Partially based on observations collected at the European Southern Observatory,Chile (ESO Programme 69.B-0566A)
Abstract
In our previous paper, we have reported the detection of a Balmer edge absorption feature in the polarized flux of one quasar (Ton 202). We have now found similar Balmer edge features in the polarized flux of four more quasars (4C09.72, 3C95, B2 1208+32, 3C323.1), and possibly a few more, out of 14 newly observed with the VLT and Keck telescopes. In addition, we also re-observed Ton 202, but we did not detect such a dramatic feature, apparently due to polarization variability (the two observations are one-year apart). The polarization measurements of some quasars are affected by an interstellar polarization in our Galaxy, but the measurements have been corrected for this effect reasonably well.
Since the broad emission lines are essentially unpolarized and the polarization is confined only to the continuum in the five quasars including Ton 202 in both epochs, the polarized flux is considered to originate interior to the broad emission line region. The Balmer edge feature seen in the polarized flux is most simply interpreted as an intrinsic spectral feature of the quasar UV/optical continuum, or the “Big Blue Bump” emission. In this case, the edge feature seen in absorption indeed indicates the thermal and optically-thick nature of the continuum emitted. However, we also discuss other possible interpretations.
keywords:
quasars - galaxies: active - accretion - polarization - radiation mechanisms: general1 Introduction
We have recently reported our first detection of a Balmer edge absorption feature in the polarized flux spectrum of one quasar (Ton 202; Kishimoto, Antonucci & Blaes Kishimoto et al.2003; hereafter Paper I). In the present paper, we report that a similar Balmer edge feature is seen in the relatively high S/N polarized flux spectrum of four more quasars, taken with the Very Large Telescope (VLT) and Keck Telescope. We also present new spectropolarimetric data for 10 more quasars of a mostly moderate S/N, also taken with the VLT and Keck.
These observations are a part of our on-going effort to find spectral features intrinsic to the UV/optical continuum of quasars, which is often called the Big Blue Bump (BBB). This emission component is crucial in the sense that it dominates the radiative output of quasars, but its nature has not been well understood (Koratkar & Blaes, 1999; Antonucci, 1988, 1999). One of the most critical problems has been the observed apparent lack of continuum edge spectral features from the emission source, which is often assumed to be an accretion disk.
At least at the Lyman edge, this problem may be mitigated by smearing from relativistic Doppler shifts and gravitational redshifts, which can severely blur the spectral features produced in the local atmospheres at different radii of the disk (e.g. Hubeny et al. 2000). While the coolest disk models still exhibit a broadened absorption feature, hotter disk models generally exhibit a change in slope in the vicinity of the Lyman limit. This arises from a combination of smeared out absorption and emission edges on top of a general rollover of the underlying continuum. Such slope changes might be consistent with the spectral breaks that are observed in the vicinity of the Lyman limit in some objects such as 3C 273 (Kriss et al. 1999) or in composite spectra (Zheng et al. 1997; Telfer et al. 2002), but quantitative fits to such spectra have so far been unsatisfactory. In particular, detailed fits to the spectral break observed in 3C 273 still produce a local emission bump that is not in agreement with the data (Blaes et al. 2001). This bump in the best fit disk model arises from Lyman emission edges formed in the atmospheres between ten and thirty gravitational radii. Relativistic smearing of this bump is minimized because 3C 273 is a superluminal source and the putative disk is therefore constrained to be nearly face-on to the line of sight. More generally, disk models that provide qualitative fits to the Lyman spectral break still do not provide enough emission in the far ultraviolet and soft X-rays to fit the composite spectra because the thermal continuum rolls over too soon (Laor et al. 1997; Blaes 2004). Some additional source of emission, e.g. Comptonization (Czerny & Elvis 1987; Lee, Kriss & Davidsen 1992), is probably required.
Compared to the Lyman edge region, accretion disk models place the main emitting source for the Balmer edge region considerably farther out in the gravitational potential well. In detail, such models predict substantial contributions to both the Lyman and Balmer edge regions from broad ranges of overlapping radii, but the Balmer edge still has contributions from considerably larger radii, and therefore will be subject to less smearing. (There are actually considerable technical problems in making concrete spectral predictions of the Balmer edge from accretion disk models because of the presence of hydrogen ionization zones at these larger radii - see Hubeny et al. 2000 for discussion. It is noteworthy, however, that the Balmer edges in these models is always in absorption.) In addition, unlike the Lyman edge, the Balmer edge is not a resonant feature, so the confusion with foreground absorption is much less of a problem. Thus, although detailed spectral predictions from disk atmosphere models of the Balmer edge are yet to come, targeting the Balmer edge may well be advantageous compared to the Lyman edge.
However, the observation of the Balmer edge intrinsic to the BBB emission has been impossible, since it is essentially buried under the Balmer continuum, high-order Balmer emission lines, and FeII emission lines (collectively referred to as the small blue bump) which are thought to be coming from the broad emission line region (BLR). The main immediate goal of our effort is to overcome this obstacle by looking at the polarized flux of the quasars with a small polarization (%). Note that these are normal quasars in terms of their spectral energy distribution, and not classified as blazars. About 1/3 of the normal quasars are known to be polarized with % (Berriman et al., 1990). Among them, at least in some cases (and possibly in many cases), the polarization is found to be confined only to the continuum, and the broad emission lines are essentially unpolarized (Antonucci 1988, showing the data of Miller and Goodrich; Schmidt & Smith 2000). In these cases, the polarized flux is considered to arise interior to the BLR, and thus it is likely to show the intrinsic Balmer edge feature of the BBB emission with all contaminating emission from outside the nucleus scraped off and removed.
Detailed investigation of the polarized flux requires a long integration with a large telescope. In our first such deep integration on one quasar with the Keck telescope, we have indeed found a Balmer edge feature in the polarized flux of the quasar. Here, we report our spectropolarimetric observations of 14 more quasars with the VLT and Keck, presenting a similar Balmer edge feature in four more quasars. We also discuss the re-observation of Ton202. Some of the preliminary results have been published in Kishimoto et al. (2004).
Finally, note that the polarization and the polarized flux are different quantities which must not be confused. It has been previously established that tends to be low in the Balmer continuum region, but our work, which has important new physical implications, is that in the same wavelength region is also well below the extrapolation from longer wavelengths in many cases.
For convenience, we summarize the symbols and acronyms used throughout this paper in Table 1.
| symbol/ acronym | definition |
|---|---|
| Stokes parameter, or the total flux . | |
| Unnormalized Stokes parameters in the sky coordinates, i.e. having the reference axis along the North-South direction. | |
| Normalized Stokes parameters, , . | |
| Rotated Stokes parameters with the reference axis taken to be along the PA of the polarization of the object. Thus, (or ) is essentially equivalent to the polarized flux . | |
| Ratio of polarization at 2891-3600Å to that at 4000-4731Å. | |
| PA | Difference between the PA of the optical polarization and that of the radio structural axis. |
| The wavelength at which an interstellar polarization is maximum for a given line of sight. | |
| The magnitude of an interstellar polarization at . | |
| PA | Position Angle. |
| BLR | Broad Line Region. |
| BBB | Big Blue Bump. |
| ISP | Interstellar Polarization. |
| name | other | exp. | date | slit | filter | |
|---|---|---|---|---|---|---|
| name | (min) | (′′) | ||||
| Q0003+158 | 4C15.01 | 0.450 | 20 1 | 13 Sep | 1.5 | GG375 |
| 20 1 | 15 Sep | 1.5 | GG375 | |||
| Q0205+024 | 0.155 | 10 1 | 13 Sep | 1.5 | none | |
| Q0349-146 | 3C95 | 0.616 | 30 3 | 13 Sep | 1.5 | GG435 |
| 16 1 | 13 Sep | 1.5 | GG435 | |||
| 30 2 | 15 Sep | 1.5 | GG435 | |||
| 30 3 | 15 Sep | 1.5 | none | |||
| 20 1 | 15 Sep | 1.5 | none | |||
| Q0350-073 | 3C94 | 0.962 | 20 1 | 13 Sep | 1.5 | GG435 |
| Q0405-123 | PKS | 0.573 | 10 1 | 13 Sep | 1.0 | GG435 |
| Q0414-060 | 3C110 | 0.775 | 10 1 | 13 Sep | 1.5 | GG435 |
| Q1912-550 | PKS | 0.402 | 20 1 | 13 Sep | 1.0 | GG375 |
| 20 5 | 15 Sep | 1.5 | GG375 | |||
| 30 1 | 15 Sep | 1.5 | GG375 | |||
| Q2115-305 | PKS | 0.979 | 10 1 | 13 Sep | 1.0 | GG435 |
| 10 3 | 15 Sep | 1.0 | GG435 | |||
| Q2251+113 | 4C11.72 | 0.326 | 10 1 | 13 Sep | 1.0 | none |
| Q2308+098 | 4C09.72 | 0.433 | 30 2 | 13 Sep | 1.0 | GG375 |
| 30 2 | 13 Sep | 1.5 | GG375 | |||
| Q2349-014 | 4C-01.61 | 0.174 | 10 1 | 13 Sep | 1.0 | none |
| name | other | exp. | slit PA | grism | |
|---|---|---|---|---|---|
| name | (min) | (°) | |||
| Q1004+130 | 4C13.41 | 0.240 | 301 | 58 | 300/5000 |
| Q1208+322 | B2 1208+32 | 0.388 | 303 | 30 | 300/5000 |
| 301 | 30 | 400/3400 | |||
| Q1425+267 | Ton 202 | 0.366 | 302 | 143 | 300/5000 |
| 301 | 97 | 400/3400 | |||
| Q1545+210 | 3C323.1 | 0.264 | 302 | 85 | 300/5000 |
| 161 | 85 | 400/3400 |
2 Observation
2.1 VLT observations
We observed 11 quasars on 13 and 15 September 2002 (UT) using Focal Reducer/Low Dispersion Spectrograph (FORS1) on the Unit Telescope 3 (Melipal) of the Very Large Telescope (VLT). These observations are summarized in Table 2. The observation of each target were done in one or more sequences with one sequence consisting of four frames with four different waveplate positions. The exposure time in Table 2 refers to the exposure time for one sequence multiplied by the number of repetitions of the same sequence. The grism 300V was used at a dispersion of 2.6Å per pixel. The seeing varied between and over the nights: the slit width was set to giving a spectral resolution of 20Å, except for some frames taken in the first half of 13 Sep (see Table 2) when the seeing was mostly and the slit width was set to (resolution 13Å). The spatial sampling was per pixel. The slit direction was fixed north-south, and the instrument was equipped with an atmospheric dispersion compensator (Avila, Rupprecht, & Beckers, 1997).
The CCD frames were bias-subtracted using an averaged bias frame, and flat-fielded using internal screen flats. Obvious cosmic-ray hits were removed and interpolated using neighboring pixels. The o-ray and e-ray spectra were extracted with windows. Then these were combined to produce normalized Stokes parameters and , and the Stokes parameter , following Miller, Robinson & Goodrich (Miller et al.1988). The zero point of the position angle (PA) of the polarization was determined using the polarized standard stars Hiltner 652, BD+25 727, and BD-12-5133, with an estimated accuracy of 0.3°. The instrumental polarization was checked with the unpolarized standard stars HD13588 and HD42078 and estimated to be less than %. The flux was calibrated using the flux standard star GD50.
In many of our observations, we have used two different order-sorting filters to avoid second-order contamination; we have chosen for each object the filter which blocks the second order spectrum at the H line position in the observed frame. We observed one of the objects (3C95) also without the filter to cover the near-UV wavelengths.
2.2 Keck observations
Four quasars listed in Table 3 were observed on 4 May 2003 (UT) with the Low Resolution Imaging Spectrograph (LRIS; Oke et al. 1995) on the Keck-I telescope, with a new blue-sensitive CCD (commissioned on 4 June 2002, after the observations in Paper I) on the blue arm of the spectrograph. Two grisms, 300/5000 and 400/3400, were used with dispersions of 1.4Å per pixel and 1.0Å per pixel, respectively. The slit width was , giving a spectral resolution of 14Å with grism 300/5000 and 10Å with 400/3400. The spatial sampling along the slit was per pixel, and the data were obtained with the slit roughly at the parallactic angle. The seeing size was estimated to be about in the first half of the night. We probably were affected by some cirrus especially in the second half of the night.
The 2D spectral images were reduced in the standard manner. The bias level was subtracted using bias frames and overscan regions. The o-ray and e-ray spectra were extracted with window. Then these spectra taken at 4 positions of the waveplate were combined following (Miller et al.1988). The zeropoint of the PA was calibrated with the polarized standard star HD183143. The instrumental polarization was checked with the unpolarized standard stars HD94851 and BD+28 4211 and also with the observations of Ton202 with two different slit PAs. The former two observations indicated possible instrumental polarization of % roughly independent of wavelengths at a certain PA in the instrumental coordinates. However, the latter observations of Ton202 at two PAs showed no systematic difference (the correction with 0.13% results in systematic difference of this level). Therefore, we did not correct for any instrumental polarization. The flux was calibrated using the standard stars Feige 34 and BD+28 4211.
For the observations with the grism 300/5000, there was no order sorting filter available, and the new blue arm CCD is very blue sensitive. Therefore, the spectra at the red side are contaminated by second-order light. To correct for the contamination in flux, we implemented short exposures on Ton202 and B2 1208+32 with dichroic D460, which cuts out the light with wavelengths longer than Å. This provided the count rate spectrum for the second order light (the spectrum Å was masked). We scaled and subtracted it from the Stokes spectra of these two objects. Therefore, the total flux spectrum is expected to contain very little contamination. However, the polarization measurement was not corrected (the observations with D460 were done only at one position angle of the waveplate), so the polarized flux spectrum could be slightly affected. For 3C323.1 and Q1004+130, the spectra were not corrected, but these have lower redshift than the other two objects, so the wavelength range up to H line is probably not affected severely.
2.3 Targets
The selected quasars were known to be polarized in a broad optical band (, Stockman et al.1984; Berriman et al., 1990; Visvanathan & Wills, 1998). We observed the ones with redshifts larger than so that the Balmer edge in the observed frame is well away from the atmospheric cut off and well within the detector sensitivity range. Most of them are at redshift less than 0.6 in order to cover the H line. In the VLT observations, we also observed a few higher redshift objects to explore the Balmer continuum under the small blue bump. Four quasars in our sample (3C95, 4C09.72, B2 1208+32, and 3C323.1) had already been observed spectropolarimetrically (Schmidt & Smith, 2000) and had been found to have unpolarized broad lines with limited S/N. We have carried out long integrations on them to scrutinize the polarization of the broad emission lines and the Balmer edge wavelengths. Ton 202 had been observed spectropolarimetrically by Schmidt & Smith (2000) and by us (Paper I), and was included in our sample for re-observation. In the VLT run, other quasars were observed with a short integration in the first night, and we tried to follow up in the second night the ones which seemed to show unpolarized broad lines and/or unpolarized small blue bump (see next section).
2.4 Interstellar polarization
Interstellar polarization (ISP) can affect our observations. For stars with mag, Serkowski, Mathewson & Ford (Serkowski et al.1975) showed that where is the maximum polarization in percent over the (optical) wavelengths. We list and as well as the Galactic coordinates in Table 4. However, the limit of are less certain for the lines of sight with mag (see Figure 9 of Serkowski et al.1975). A better constraint can be obtained from the polarization measurements of Galactic stars in each quasar field. We have checked the polarization catalog of Galactic stars by Heiles (2000), and have tried to observe a star for each quasar with a suspected ISP effect and/or for quasars observed with a long integration time. The stars were chosen to be nearby in the projected distance to each quasar but far enough in the real distance (essentially a faint early-type star or a faint giant) in order to sample the whole ISP in our Galaxy along the line of sight. We obtained the measurement for four quasars (4C09.72, 3C95, Q1912-550, 3C323.1), as summarized in Table 5.
| Name | 9 | ||
|---|---|---|---|
| Q0003+158 | 0.050 | 0.45 | (107,-45) |
| Q0205+024 | 0.029 | 0.26 | (158,-55) |
| 3C95 | 0.079 | 0.71 | (205,-46) |
| Q0350-073 | 0.079 | 0.71 | (197,-43) |
| Q0405-123 | 0.058 | 0.52 | (205,-42) |
| Q0414-060 | 0.043 | 0.39 | (199,-37) |
| Q1004+130 | 0.038 | 0.34 | (225,+49) |
| B2 1208+32 | 0.017 | 0.15 | (182,+80) |
| Ton 202 | 0.019 | 0.17 | (36, +68) |
| 3C323.1 | 0.042 | 0.38 | (34, +49) |
| Q1912-550 | 0.059 | 0.53 | (342,-25) |
| Q2115-305 | 0.120 | 1.1 | ( 16,-44) |
| Q2251+113 | 0.086 | 0.77 | ( 83,-42) |
| 4C09.72 | 0.042 | 0.38 | ( 86,-46) |
| Q2349-014 | 0.027 | 0.24 | ( 92,-60) |
is from NED (data from Schlegel et al. 1998). is a maximum expected interstellar polarization along the line of sight to each quasar, but relatively uncertain for these low cases. is Galactic coordinates.
| Galactic star | projected distance | distance (kpc) | (%) | (Å) | PA(V) (°) |
|---|---|---|---|---|---|
| HD23938 | 1.2° NW from 3C95 | - | - | ||
| AG+22 1545 | 1.3° N from 3C323.1 | ||||
| SAO245987 | 0.5° SW from Q1912-550 | ||||
| Pn23s1-15 | 0.4° NW from 4C09.72 |
| Name | z | 2891-3600Å | 4000-4731Å | |||
|---|---|---|---|---|---|---|
| P (%) | PA (°) | P (%) | PA (°) | |||
| Q0003+158 | 0.450 | |||||
| ISP 103°, 0.45% | ||||||
| Q0205+024 | 0.155 | |||||
| 3C95 | 0.616 | |||||
| ISP 140°, 0.32% | ||||||
| Q0350-073 | 0.962 | |||||
| Q0405-123 | 0.573 | |||||
| Q0414-060 | 0.775 | |||||
| Q1004+130 | 0.240 | |||||
| B2 1208+32 | 0.388 | |||||
| Ton202 | 0.366 | |||||
| Ton202 (May2002) | 0.366 | |||||
| 3C323.1 | 0.264 | |||||
| ISP 90°, 0.90% | ||||||
| Q1912-550 | 0.402 | |||||
| ISP 10°, 0.70% | ||||||
| Q2115-305 | 0.979 | |||||
| Q2251+113 | 0.326 | |||||
| 4C09.72 | 0.433 | |||||
| ISP 100°, 0.70% | ||||||
| Q2349-014 | 0.174 | |||||
∗The absolute PA for the May 2002 data of Ton 202 was not determined and only the relative PA was measured.
| Name | continuum region | H line region (4731-4934Å) | OIII5007 line region (4982-5032Å) | |||||||
|---|---|---|---|---|---|---|---|---|---|---|
| (4537-4731, 5032-5185Å) | polarization | EW (Å) | polarization | EW (Å) | ||||||
| P (%) | PA (°) | P (%) | PA (°) | P (%) | PA (°) | |||||
| Q0003+158 | 92. | 31. | ||||||||
| ISP 103°, 0.45% | ||||||||||
| Q0205+024 | 42. | 25. | ||||||||
| 3C95 | 50. | 20. | ||||||||
| ISP 140°, 0.32% | ||||||||||
| Q0405-123 | 18. | 18. | ||||||||
| Q1004+130 | 17. | 8. | ||||||||
| B2 1208+32 | 72. | 28. | ||||||||
| Ton202 | 55. | 40. | ||||||||
| Ton202 (May2002) | 73. | 45. | ||||||||
| 3C323.1 | 51. | 18. | ||||||||
| ISP 90°, 0.90% | ||||||||||
| Q1912-550 | 73. | 39. | ||||||||
| ISP 10°, 0.70% | ||||||||||
| Q2251+113 | 72. | 23. | ||||||||
| 4C09.72 | 33. | 13. | ||||||||
| ISP 100°, 0.70% | ||||||||||
| Q2349-014 | 51. | 21. | ||||||||
∗The absolute PA for the May 2002 data of Ton 202 was not determined and only the relative PA was measured.
| Name | continuum region | line region | EW (Å) | |||
|---|---|---|---|---|---|---|
| P (%) | PA (°) | P (%) | PA (°) | |||
| Q0003+158 | 37. | |||||
| ISP 103°, 0.45% | ||||||
| 3C95 | 33. | |||||
| ISP 140°, 0.32% | ||||||
| Q0350-073 | 32. | |||||
| Q0414-060 | 43. | |||||
| B2 1208+32 | 38. | |||||
| Ton202 | 60. | |||||
| Ton202 (May2002) | 78. | |||||
| 3C323.1 | 37. | |||||
| ISP 90°, 0.90% | ||||||
| Q1912-550 | 55. | |||||
| ISP 10°, 0.70% | ||||||
| Q2115-305 | 27. | |||||
| Q2251+113 | 35. | |||||
| 4C09.72 | 25. | |||||
| ISP 100°, 0.70% | ||||||
∗The absolute PA for the May 2002 data of Ton 202 was not determined and only the relative PA was measured.
3 Results
Our primary targets are the quasars with a small continuum-confined polarization, showing unpolarized broad emission lines. In these quasars, we expect in principle the small blue bump also to be unpolarized. Thus, these quasars would show a polarization which drops significantly at wavelengths shortward of 4000Å in the rest frame. This is a broad band property and relatively easy to recognize. We have measured this polarization drop as the ratio of the polarization at 2891-3600Å to that at 4000-4731Å. Those are listed in Table 6 (polarization in this table has been debiased following Simmons & Stewart 1985).
We also have measured the polarization of the emission lines by fitting a power-law in the adjcent continuum region and subtracting off the continuum both in the total flux and polarized flux. More precisely, we first measured the PA of the continuum polarization, and rotated the Stokes parameters to that PA, and fit a power-law and subtracted it off. Then we measured the PA of the residual Stokes spectra, rotate the Stokes parameters to that PA, and measured the flux. Then we calculated the equivalent width (EW) of the polarized line flux using the fitted continuum (although the PA could be different). The results are shown in Table 7 and Table 8 (quoted polarization in these two tables is the normalized, rotated Stokes with the reference axis along the quoted PA, and thus has not been debiased).
For the H line, we measured the polarization and EW of the H line at Å, i.e. the wavelength region of [OIII]4959,5007 lines were excluded to avoid the effect of these lines on the H measurements. The EW thus derived is smaller than the real EW. This is not a problem for our primary purpose here, which is to determine whether or not the line is detected in the polarized flux and to determine its polarization if the line is detected. The EW of the line in total flux was measured using the same wavelength window, to compare directly with the EW in the polarized flux. The measurements for [OIII]5007 line and MgII2798 line were done at 4982-5032Å and 2705-2891Å, respectively.
Note that the absorption features at the observed wavelenths of Å and Å seen in the total flux and polarized flux spectra are telluric. These regions were excluded from the measurements (thus, also due to this exclusion, the EWs measured here can be smaller than the true EWs).
In the following, we first describe the results for the quasars where the ratio is measured to be significantly less than unity with . The majority of the objects in our sample show this significant drop in : 4C09.72, 3C95, 3C323.1, B2 1208+32, Ton202, Q1912-550, Q0003+158, Q0405-123, Q2349-014. Then we briefly describe the results for the other six quasars: for these, we did not detect a significant decrease shortward of 4000Å, although the constraint is not tight in some of the objects. The polarizations of Galactic stars around each target other than those listed in Table 5 are based on the compilation by Heiles (2000).
All flux has been corrected for the Galactic reddening using the values of in Table 4 and the reddening curve of Cardelli, Clayton, & Mathis (1989) with .
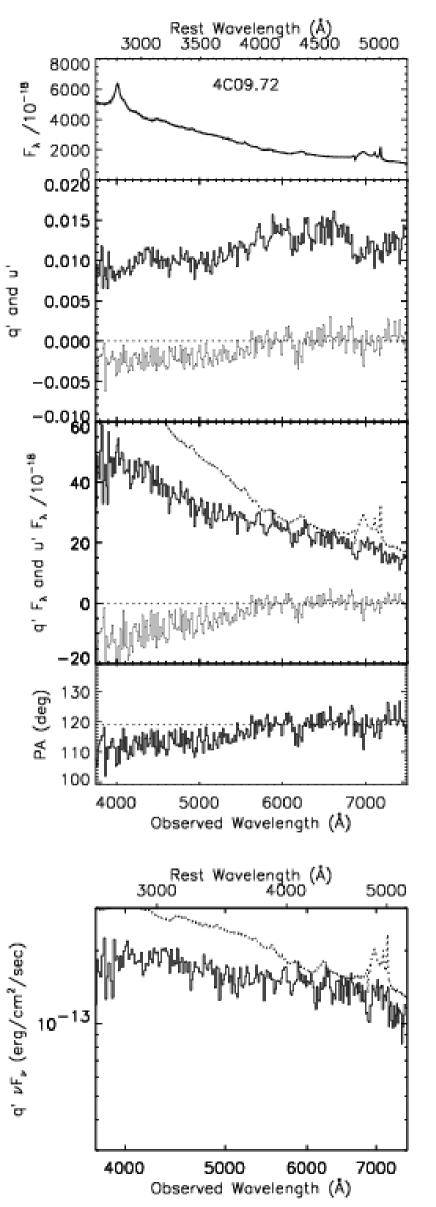


3.1 4C09.72
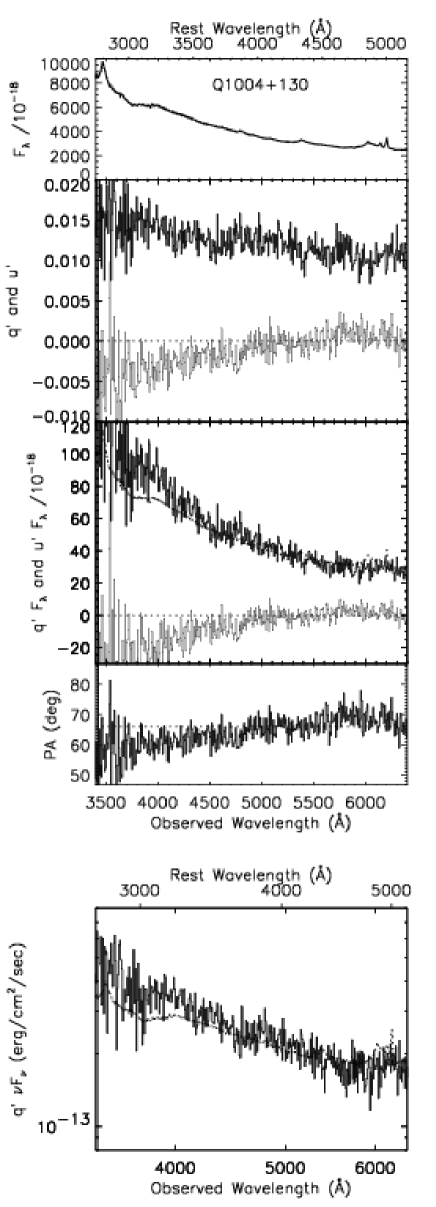
Fig.1 shows the observed polarization for 4C09.72. The upper part with four panels shows from top to bottom (1) Stokes (), (2) normalized and (thick and thin line, respectively), (3) unnormalized and ( and ) with (dotted line) scaled to match at the red side, (4) position angle (PA) spectrum. The Stokes parameters are rotated to have their reference axis along the PA of the polarization calculated at 4000-4731Å (Table 6; this PA is indicated by the dotted line in the panel for the PA spectrum in Fig.1), thus designated as , etc. rather than , etc. Therefore, is essentially the polarization , and is essentially the polarized flux . We summarize the symbols used in this paper in Table 1. The separate bottom part shows the polarized flux spectrum in form, i.e. , against with both axes in log scale (thus note that x-axes are different in these two parts). The total flux in is also shown (dotted line). The rest wavelengths are shown at the top of each part.
3.1.1 ISP correction 1
11footnotetext: The reader who wishes to skip to our best-corrected data can proceed to section 3.1.2 and Fig.2 (and skip Fig.3 and 4). Likewise, in the following sections for each object, the ISP-related discussion is essentially separated in the first subsection when substantially addressed, so that the reader who wishes to skip it can proceed directly to the second subsection.One distinct observed feature in this object is that the PA rotates shortward of 4000Å in the rest frame, probably flattens again shortward of the rest 3500Å. We argue that this is most likely due to a contamination by ISP in our Galaxy and that the data can be corrected for this contamination to the spectra shown in Fig.2.
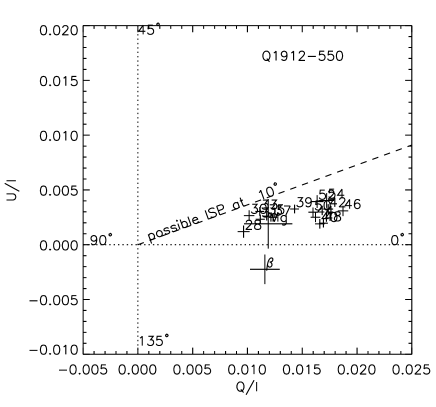
In Fig.3, we put the same data shown in Fig.1 on the - plane (normalized Stokes parameters; binned by 100 pixels or 260Å). The size of the crosses shows the error. The labels are the central rest wavelengths in each bin in units of 100Å. We see that the data points approximately align linearly, but the line of the alignment does not pass through the orgin . This is what we expect if the observed polarization consists of an ISP component and an intrinsic polarization of the object at a fixed PA. In general, if the polarization of an object changes in magnitude over the wavelengths but stays constant in PA, then the data points on the - plane align linearly with the alignment direction pointing toward the origin. On the other hand, a small contamination from an ISP, to a first order, will shift all the data points by a constant vector, since the ISP is in principle fixed at a certain position angle (PA) on the sky with its magnitude not changing significantly over the optical wavelengths (, Serkowski et al.1975). The data points will stay linearly aligned, but the extrapolation of the alignment direction will not pass through the origin in this case. This seems to be what we see in Fig.3.
If the PA of the polarization of the emission lines is the same as the continuum or if the emission lines are intrinsically unpolarized, the data point for the emission lines should also align along the other data. This is also the case, as we show in Fig.3 the polarization of the H and MgII lines from Table 7 and 8.
If this two-component interpretation is correct, the alignment direction of the data points on the - plane gives us the intrinsic PA of the polarization of the object. The ISP can roughly be inferred from the displacement of the data points: at least the displacement gives a constraint on the possible PA range of the ISP. However, the determination of an exact ISP vector requires an assumption of a PA of the ISP (or a magnitude of the ISP, where two possible solutions for the PA would exist). The polarization of Galactic stars in the same field can be used to check if it is consistent with the displacement of the data points seen on the - plane, and then to assume the PA of the ISP.
The ISP probed by Galactic stars around 4C09.72 is consistent with this interpretation. Firstly, our observation of a star which is close to 4C09.72 in projection (see Table 5) shows an ISP of 0.3% at PA 105°. This is overall a reasonable representation for the displacement of the origin of the quasar’s intrinsic polarization at least in terms of its direction (see Fig.3). Secondly, the observations of several stars around 4C09.72 in the literature compiled by Heiles (2000) show a rather clear tendency for the PA of the ISP to be at 100°- 110°with % (for the stars of estimated distance of 100-300pc). Therefore, it is likely that the observation is simply affected by an ISP and the intrinsic polarization of 4C09.72 is (at least approximately) at a fixed PA.
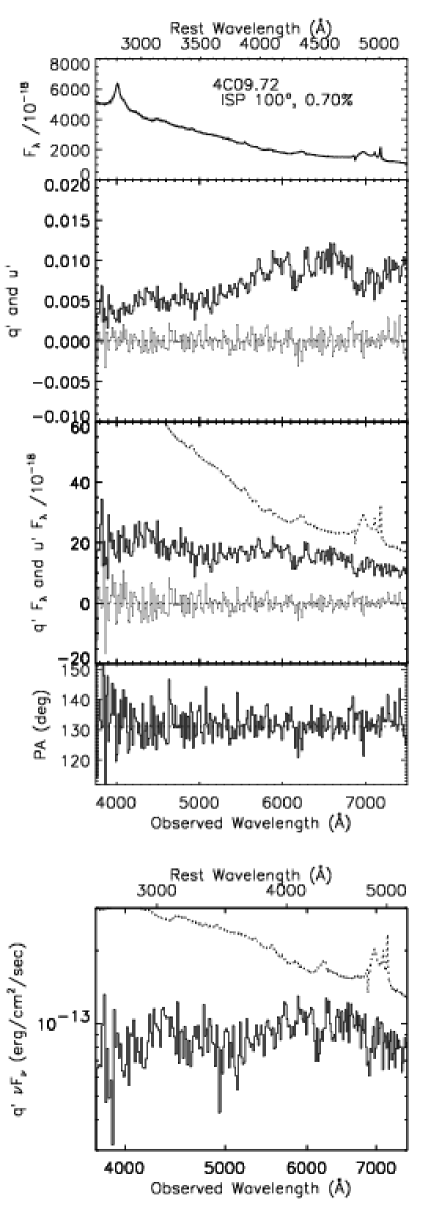
For a given assumed PA of the ISP with a Serkowski curve (we also assume the empirical relation of the constant in the Serkowski-law with ; Whittet et al. 1992), we can determine the best fit magnitude of the ISP which produces the most flat PA spectrum for the intrinsic polarization of the object. Fig.2 shows the result of this correction. If the PA of the ISP is assumed to be at 100° (see below for the case of a larger PA), the best fit for the 4C09.72 data results in having a maximum polarization of % at Å for the ISP and ° for the intrinsic polarization of 4C09.72 (this PA was already apparent from Fig.3). The Stokes parameters in Fig.2 have been rotated to have their reference axis to be at this intrinsic PA for the quasar.
We can check if the ISP component in the observed polarization really resembles a Serkowski curve, by looking at the spectrum of the Stokes parameter perpendicular in the - plane (or 45° in the sky plane) to the intrinsic polarization of the quasar, since this Stokes parameter spectrum should not contain the polarization of the quasar. This is shown in the upper panel of Fig.4: the spectrum is nicely fit by a Serkowski curve (this is of course essentially equivalent to checking whether the ISP-corrected stokes , shown in Fig.2, is flat). Similarly, we can check the shape of the ISP-corrected polarized flux of the object by looking at the Stokes parameter perpendicular in the - plane to the PA of the ISP as shown in the lower panel of Fig.4: this essentially shows the same spectrum as the spectra in Fig.2.
We note that the ISP magnitude derived above looks large compared with those for the nearby star we observed or several other stars in the literature. The estimated for the line of sight to 4C09.72 is 0.042 mag, and thus we might expect that the ISP for 4C09.72 would be less than % (see Table 4). However, the flatness of the PA spectrum after the ISP subtraction (Fig.2) makes this correction quite believable. We note again that the limit of are less certain for the lines of sight with smaller in Figure 9 of (Serkowski et al.1975).
The EW of the emission lines in the corrected polarized flux is consistent with zero and its upper limit for the H line is much less than the EW of the line in the total flux (Tables 7 and 8). This is what we expect since the assumed PA of the ISP is essentially the same as the observed PA of the line polarization, and the data points for the lines in the q-u plane are essentially aligned with other data points. Conversely, our interpretation is well supported by this line polarization.
The uncertainty in the PA of the ISP leads to an uncertainty in the corrected polarized flux spectrum. However, the PA of the ISP is not likely to be much smaller than 100° based on the ISP map around the quasar. Conversely, if we increase the PA assumed, the features seen in the corrected polarized flux which are described below become stronger in this particular case (this makes the magnitude of the inferred ISP even larger as we can see from Fig.3). Thus, the overall spectral features do not depend on the ISP correction at least qualitatively. The uncertainty in the PA of the ISP may be minimized by the future observations of a few more close-by distant stars around 4C09.72.
3.1.2 Corrected spectra
Fig.2 shows the spectra for 4C09.72 which have been corrected for the contamination from the ISP in our Galaxy. Note that the S/N of the polarization spectra has been effectively degraded due to the reduction of the magnitude from the subtraction of the ISP.
The corrected polarized flux (unnormalized Stokes , or ) shows spectral features that look similar to those seen in Ton 202 (Paper I). Firstly, there are essentially no emission lines, which are quantified in Table 7 and 8. Secondly, in the Balmer edge region, there is a slope down-turn (or local maximum) at about 4000Å, and there also seems to be a slope up-turn (or local minimum) at 3600Å. In addition, there seems to be a local peak feature at 3050Å. These are all discussed in section 4.
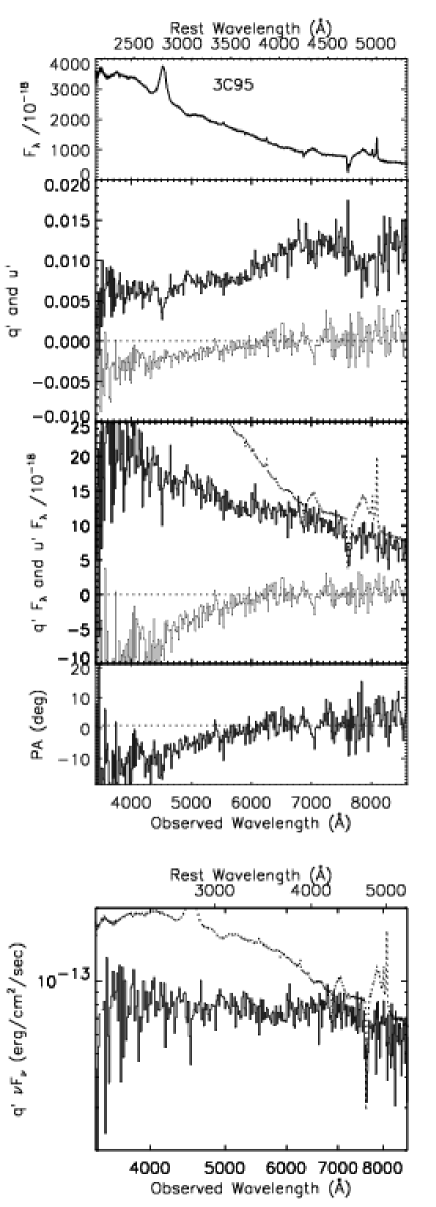

3.2 3C95
3.2.1 ISP correction 1
The observed polarization for 3C95 is shown in Fig.5. We have combined the observations with an order sorting filter GG435 (thus Å) and the ones without any filter (thus Å). There is again a PA rotation shortward of rest 4000Å. This is probably due to a small ISP contamination and we show the data corrected for the ISP contamination in Fig.6. This inference is again based on the - plane plot where the data points align at least approximately linearly as shown in Fig.7 (however see below). The polarization measurements of a few Galactic stars having estimated distance of 100-600pc (Heiles, 2000) suggests an overall tendency of the ISP at PA 130-150°with %, though our observation of a neighboring star (Table 5) shows no polarization larger than 0.1%. This direction of the PA seems to be a reasonable representation for the shift of the intrinsic polarization of 3C95 on the - plane (Fig.7).
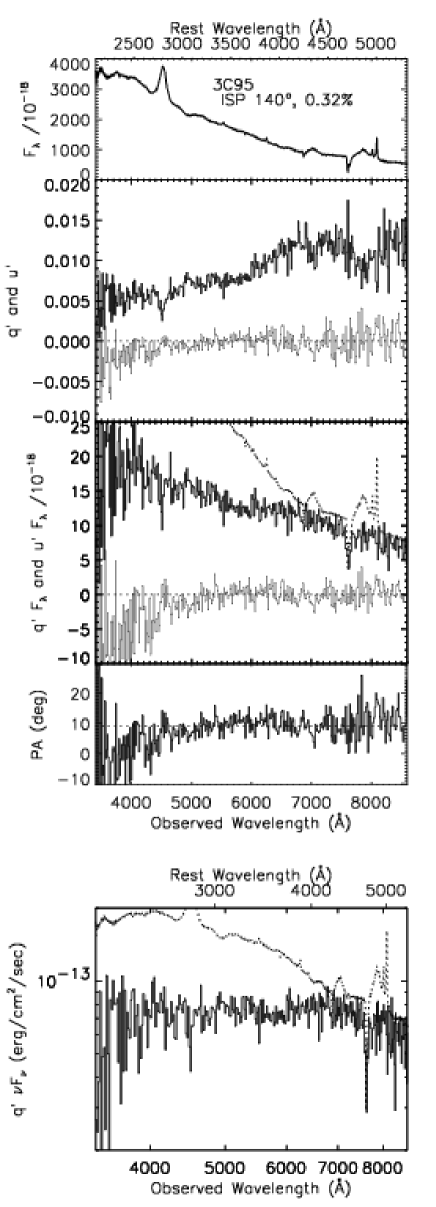
Thus the argument for ISP contamination looks reasonable. However, there also seems to be some systematic deviation from the alignment on the - plane at the blue end of the spectrum, shortward of the rest 3000Å. Therefore, we tried to correct for the ISP using the data longward of this wavelength. The same correction procedure as for 4C09.72, assuming the PA of the ISP as 140°, produced the results shown in Fig.6. The fit resulted in having % and the PA of the quasar’s intrinsic polarization at ° ( was simply assumed to be 5500Å). The correction looks overall reasonable except for the blue end (the ISP correction using the whole wavelength results in having some wave-like rotation in the PA spectrum).
There is an uncertainty in the polarized flux shape due to the uncertain ISP PA, but this is rather small since the magnitude of the ISP is small compared to the observed polarization. If the PA of the ISP is assumed to be smaller than 140°, this would give a larger ISP magnitude as can be seen in Fig.7, which is unlikely as we argued above. For an ISP correction with a larger PA, the spectral features in the polarized flux even become slightly stronger.
The H and MgII lines in the spectrum before any ISP correction are unpolarized with (see Table 7 and 8). This means that the ISP contamination is small (0.3-0.4% at most) and the lines are intrinsically unpolarized, unless the ISP is coincidentally canceling out any intrinsic polarization component. (The above ISP correction ’produces’ a little line polarization, but not significantly).
3.2.2 Corrected spectra
Fig.6 shows the data corrected for the ISP contamination. The polarized flux spectrum again shows a spectral feature at the Balmer edge region similar to that of Ton 202 in Paper I and 4C09.72 in the previous section: a slope down-turn at around rest 4000Å and an up-turn at around 3600Å. As we argued above, the emission lines probably are intrinsically unpolarized, even though the [OIII] line and MgII lines look marginally polarized in the corrected polarized flux spectrum.
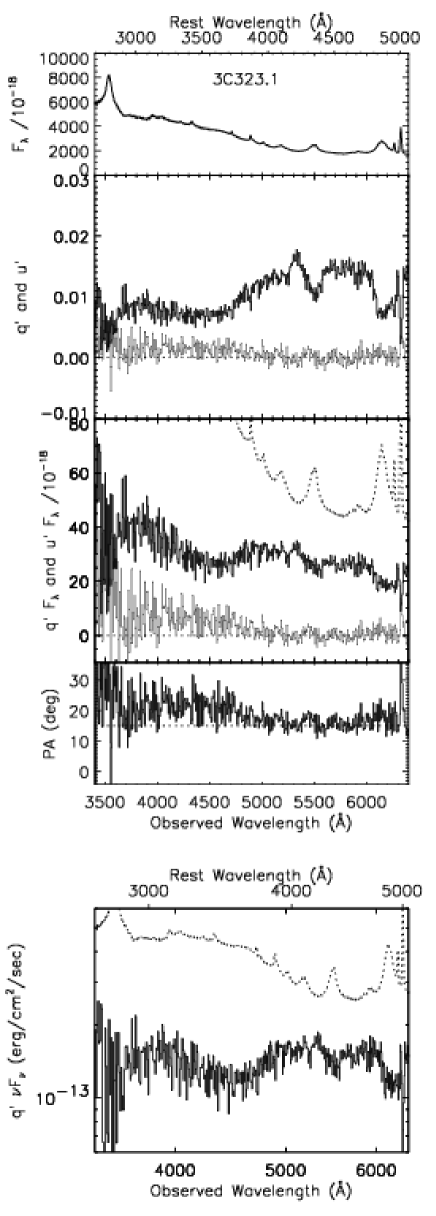
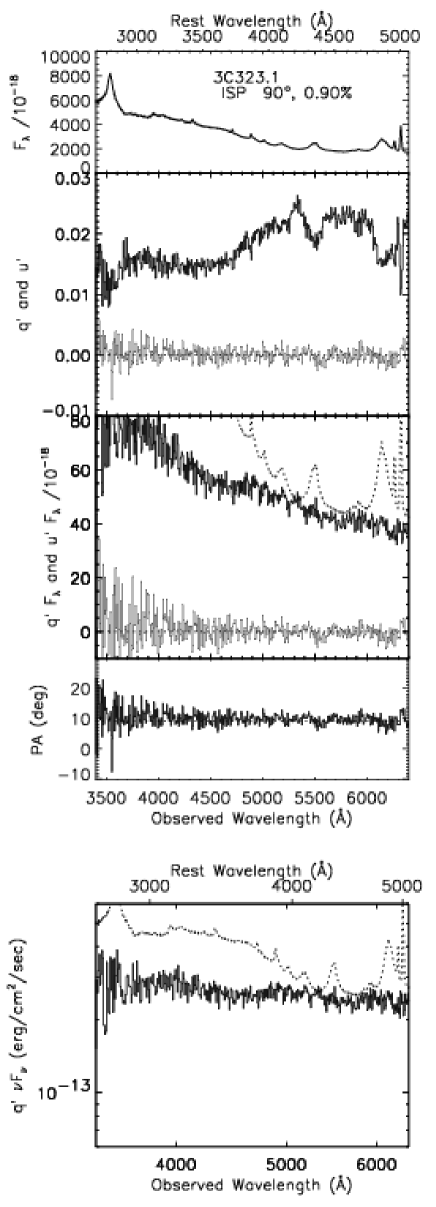

3.3 3C323.1
3.3.1 ISP correction 1
The data for this object, shown in Fig.8, are also likely to have been affected by ISP: the data corrected for the ISP are shown in Fig.9.
The original measurement in Fig.8 shows a PA rotation shortward of rest 4000Å and also at emission line wavelengths, but on the - plane, a linear alignment of the data points is seen (Fig.10). The direction of the shift of the data points is consistent with the observations of Galactic stars in the same field. Our observation of a nearby star shows % at PA 84° (see Table 5), and other observations of three Galactic stars within 3° (Heiles, 2000) having estimated distance larger than 200pc also show a similar PA (85-95°), though with a smaller P (0.2-0.3%). Therefore we have corrected the data assuming the PA of the ISP at 90°, and Fig.9 is the result of this correction. Before this ISP correction, there were some apparent features at the emission line wavelengths in the polarized flux (Fig.8), but after the correction, these are essentially gone. This is expected since the polarization measured for these lines before the correction is roughly consistent with the subtracted ISP (Fig.10; Tables 7, 8).
The uncertainty in the PA of the ISP leads to the uncertainty in the polarized flux. An ISP correction with a smaller PA results in a stronger spectral feature in the polarized flux. With a larger PA, the feature becomes weaker, but this also results in having emission lines in the polarized flux. The ISP magnitude also increases rapidly with a larger assumed PA.
3.3.2 Corrected spectra
The data which are best-corrected for the ISP are shown in Fig.9. The emission lines look unpolarized (see also Table 7 and 8) after the ISP correction. At the Balmer edge region, there remains the now-familiar intrinsic features left: the slope down-turn at Å, and an up-turn at Å, though the feature looks weaker than for the previous objects.
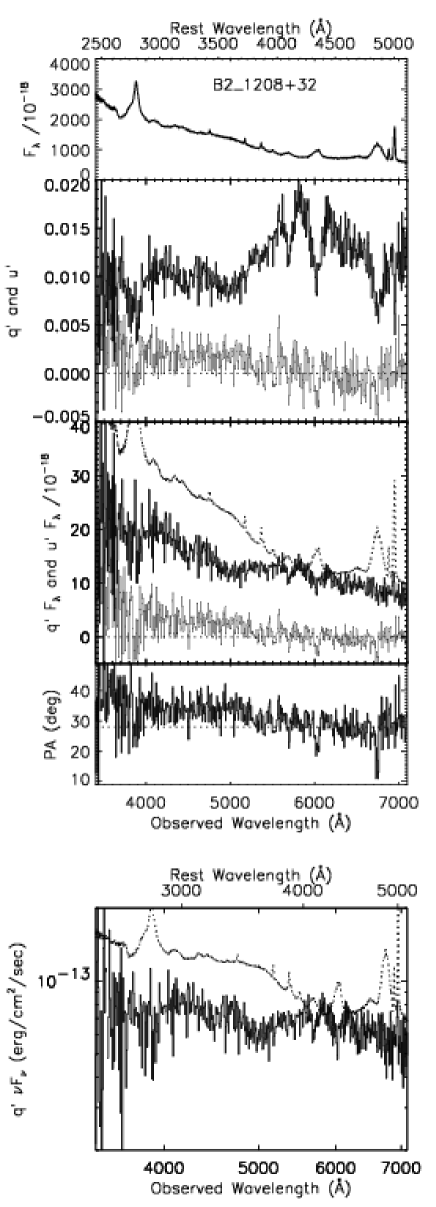

3.4 B2 1208+32
3.4.1 ISP effect 1
In this object, a small PA rotation shortward of 4000Å is again seen (Fig.11) and the data points on the - plane also roughly align linearly (Fig.12), though not too cleanly. We do not have our own observation of a Galactic star in the field, but the data in the literature indicate that stars with estimated distances of 400-500pc show a small polarization (%) at PA 0-25°.
If there is any effect of ISP around at this PA, it is expected to be small, judging from the location of the data points on the - plane. However, we note that the continuum PA rotation direction and the line polarization direction are not in the same sense, which suggests that one of them is intrinsic. In either case, the ISP magnitude is probably small, so its effect should also be small.
3.4.2 Uncorrected spectra
Fig.11 shows the measurements without any ISP correction, and the intrinsic polarization is expected to be qualitatively the same, since the ISP effect is thought to be small. The measured small line polarization (polarized at different PA from the continuum) could either be intrinsic or entirely due to an ISP. The polarized flux shows a similar, now-familiar feature in the Balmer edge region, and the up-turn at Å in this object looks more pronounced.
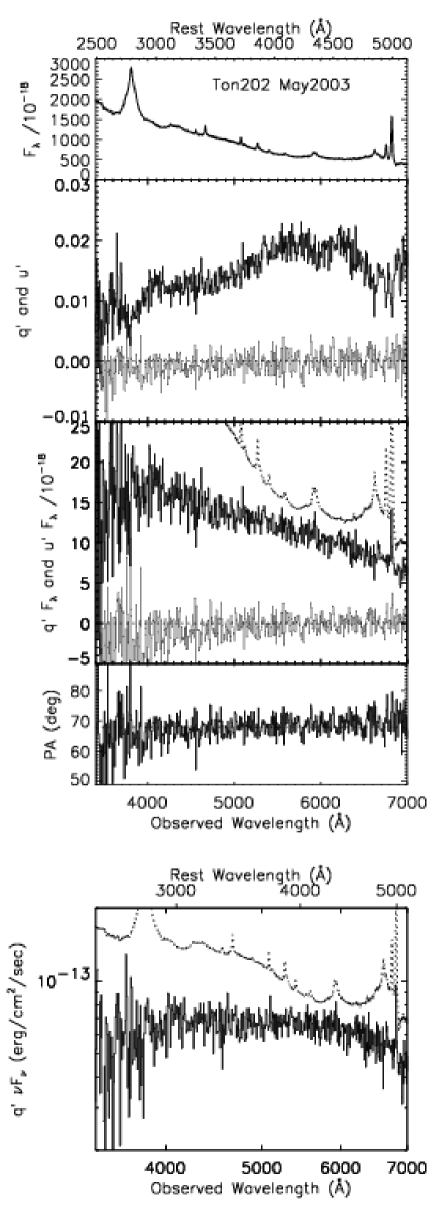

3.5 Ton202
This object was found to show a Balmer edge feature in the polarized flux, when observed in May 2002 (Paper I). However, we do not find such a dramatic feature in our data taken in May 2003, as we show in Fig.13. The polarized flux looks quite featureless at Å. (At the red end wavelengths longer than 6400Å, the polarized flux shape become convex, which could be due to second-order light.) This difference in two epochs seems to be due to a real variation in polarization.
The upper panel of Fig.14 shows the difference in polarization in these two epochs (more accurately, difference in normalized Stokes rotated to the object’s polarization PA at each epoch; note that the sky PA of the May 2002 observation could not be determined due to some calibration problem; see Paper I). Thus the polarization seems to have decreased longward of Å, while the continuum flux shape stayed roughly the same as shown in the lower panel of Fig.14 (absolute flux levels have uncertainties from slit loss and seeing size difference, which are rather hard to quantify).
Polarization variability on a timescale of one year is not unexpected, since the polarization is thought to originate from a very small spatial scale, smaller than the size scale of the broad line region, as we argue in Paper I and also in the next section. In fact, polarization variability of Ton 202 and some other quasars in our sample has been pointed out by Schmidt & Smith (2000). Some broad-line radio galaxies are also known to show polarization variability (Antonucci, 1984). Ton 202, as well as other objects, should be followed up to confirm and explore the variability.
We note that the [OIII] line might be weakly polarized. The measurements in two epochs gave consistent results for the magnitude of polarization (Table 7). Assuming that this [OIII] line polarization did not vary, we would be able to constrain that the PA of the continuum polarization has changed only less than °(1) based on the 1 uncertainty for the [OIII] line polarization PA (Table 7). There might be a very small rotation in PA across 4000Å (Fig.13), which was not seen in the data of May 2002, but no useful ISP measurement is available at this time.


3.6 Q1912-550
3.6.1 ISP correction 1
As shown in Fig.15, the polarization clearly decreases shortward of rest 4000Å, so the small blue bump is at least partially unpolarized. However, the H and [OIII] lines are polarized as seen in the spectrum. The data are probably affected by the ISP, and we show the ISP-corrected data in Fig.16. The data points in the - plane shown in Fig.17 align roughly linearly, suggesting the PA of the intrinsic polarization is roughly 0-10°. Our observation of a nearby star shows a rather strong ISP of 0.7% at PA 2° (Table 5). Therefore, the observation of the quasar is probably affected by the ISP which happens to be at a PA similar to that of the object polarization, causing very little PA rotation in the observed data.
The Galactic latitude is not high for this object, though the estimated is not much larger than other objects (see Table 4). The existing polarization measurements of the nearby Galactic stars (within 6°; Heiles 2000) show that, while two stars have low (%) at PA 70-80°(with the estimated distance of 90-250pc), three stars have a rather high of 0.4-0.6% at PA 5-15°(distance 170-440pc). This is consistent with our observation of one Galactic star.
Fig.16 is the result after the subtraction of ISP assuming PA=10°(with the same as the observed star in Table 5). In this case, the best fit ISP magnitude was of %. With this correction, the narrow lines are rather well removed from the polarized flux spectrum, but there appear to be broad components (these were seen before the correction), which is quite different from the cases of 4C09.72 and 3C95 or 3C323.1. The ISP magnitude could be slightly larger, if its PA is smaller than 10°(though the magnitude would not be constrained well when it is too close to the PA of the intrinsic quasar polarization); the broad lines still remain even with this larger ISP subtraction. In fact, this seems to be due to a qualitative difference in the original polarization spectrum, rather than due to undersubtraction of the ISP — unlike those seen in 4C09.72 (and in 3C95, 3C323.1, and B2 1208+32), the polarization does not seem to decrease at the wavelengths of broad line wings. Therefore, the broad lines seem to be slightly polarized.
Since the ISP PA seems to be very close to the PA of the quasar polarization, this leaves a corresponding rather large uncertainty in the broad-band shape of the polarized flux.
3.6.2 Corrected spectra
Fig.16 shows the ISP-corrected spectra. In this object, the broad line components seem to be slightly polarized. One would then expect the small blue bump also to be somewhat polarized. Therefore, the decline of the intrinsic polarized flux continuum shortward of 4000Å could be sharper than seen in the corrected polarized flux. However, we note that the uncertainty in the broad-band shape of the corrected polarized flux for this object is rather large.
3.7 Q0003+158
3.7.1 ISP correction 1
This object (Fig.18) also has an at least partially unpolarized small blue bump, since decreases shortward of 4000Å, but the broad lines look partially polarized. There is no clear evidence of PA rotations. Based on the polarization measurements of two Galactic stars around this object (0.06/0.41% for 140/280pc at 115/118°; Heiles 2000), there could be a small ISP at a PA very similar to that observed for Q0003+158. Therefore, at least partially, the polarized lines could be due to ISP. In Fig.19, we illustrate a possible “nominally” maximum effect of an ISP correction: namely we implemented the same fitting procedure assuming % which is equal to , instead of assuming the PA of the ISP. In these corrected data, the polarized flux spectrum shows almost no emission lines (i.e. the emission line polarization seen in the uncorrected data is consistent with the assumed ISP; see Table 7 and 8 as well as the data on the - plane shown in Fig.20).
3.7.2 Corrected Spectra
Fig.19 shows the ISP-corrected spectra, but note that we do not have a firm basis for the ISP estimate for this object. In these corrected spectra, almost no emission lines are seen in the polarized flux, and at the Balmer edge region, there seems to be again a slope down-turn at rest 4000Å. However, we need more data to confirm these, and also need more data on Galactic stars around this object.
3.8 Q0405-123
3.8.1 ISP effect 1
A PA rotation across 4000Å is seen (Fig.21) which resembles that of 4C09.72 (and 3C95 or 3C323.1). This could be due to ISP since the data points in the - plane roughly align linearly, with the alignment line displaced from the origin (Fig.22), although no good polarization measurements for Galactic stars in the quasar field are available. The alignment direction suggests the intrinsic polarization is at PA °. The line polarization is at least consistent with this interpretation, but does not provide significant limits (Fig.22; the polarization of the H + [OIII]5007 line measured at 4731-5032Å is plotted instead of H only, since excluding the telluric absorption wavelengths at around 7600Å left a very small wavelength window for H).
3.8.2 Uncorrected spectra
The data without any ISP correction are shown in Fig.21. The overall polarization is very low (Fig.21; note the small of % even at the red side), but we marginally detected a polarization decrease shortward of 4000Å (Table 6). The above consideration of a possible ISP effect might suggest that the intrinsic polarization of this object is at PA °. The lines are consistent with being unpolarized, but the constraints are not tight.
The object shows variability, as discussed by Schmidt & Smith (2000): when observed in 1990-1991 by Antonucci et al. (1996), the optical polarization was much lower than we observed (%). The measurement by Schmidt & Smith (2000) in 1995 and 1999 did not show significant optical polarization (% and %, respectively, though still consistent with our measurement. The measurements by (Stockman et al.1984) in 1978 and 1980 are roughly consistent with ours, or was slightly higher in one occasion in 1978.

3.9 Q2349-014
Although the formal polarization ratio is less than unity at 3 (Table 6), the polarization seems to behave differently from the other objects (Fig.23) in that it looks constant over 4000Å, but rather abruptly decreases shortward of Å. This interesting behavior should be confirmed and followed up with longer integrations. There could be a small effect from an ISP, since the polarization measurements of several Galactic stars show a rather clear PA alignment at 120-130° with %.

3.10 Q0414-060
We did not detect a significant decrease shortward of 4000Å (Fig.24), and the limit on the MgII line polarization is not significant either (Table 8). No good polarization measurement for Galactic stars is found in the literature within 5° from the quasar.

3.11 Q1004+130
3.11.1 ISP or second polarization component 1
The polarization gradually increases toward shorter wavelengths in this object, and the PA rotates also gradually (Fig.25). The data points on the - plane align linearly (Fig.26), and its alignment probably suggests that it has one polarization component at PA ° and another component with being roughly wavelength-independent and larger than % based on the distance between the alignment line and the origin (for this lower limit case, the PA of this component is at PA °). The latter component might be an ISP: we do not have stars with large estimated distance within °, but at radii °, several stars show a polarization roughly aligned at PA 75-85°, though the polarization are all low % (one has an estimated distance of 100pc). We need a good observation of a Galactic star to check the ISP.
3.11.2 Polarization and the BAL property
In any case, the polarization property is quite different from the previous objects. The polarization seems to consist of two components: one of them is probably quite wavelength-independent, but the other has quite a blue polarized flux, which might be due to dust scattering.
This quasar is one of the few Broad Absorption Line (BAL) quasars having both a well-defined radio jet axis and good spectropolarimetric data. The evidence for the BAL property of this quasar was presented in Wills, Brandt, & Laor (1999). The spectropolarimetry data of this quasar has been documented by Antonucci et al. (1996), and our data are qualitatively consistent with their results in terms of the polarization magnitude and PA rotation, but their integrated polarization PA (though covering up to longer wavelengths) is a little larger than ours (by °), which might be due to variability.
The overall alignment between the polarization PA (67°) and radio jet axis (121°) is intermediate. However, the component at PA ° is roughly perpendicular to the radio axis, and the second component might be due to an ISP as described above.
In the other two cases of BAL quasars with FRII jet axis and optical spectropolarimetric data (FIRST J101614.3+520916, Gregg et al. 2000; LBQS 1138-0126, Brotherton et al. 2002), the relations between the polarization PA and jet axes are again intermediate and PA rotations are seen. For both cases, is quite large and the ISP seems to be quite small based on very small , suggesting that the PA rotation would originate from two intrinsic polarization components rather than from an ISP contamination.


3.12 Q2251+113
The polarization looks constant over all the wavelengths, except at the emission lines (Fig.27). The blue side of the H line seems to be polarized at a different PA from the continuum. However, there might be some effect from an ISP, since the polarization measurements of several stars within 5° from the quasar show an ISP at a consistent PA of 100-105°with %.
3.13 Q2115-305
Polarization is rising towards the bluer side, and thus the polarized flux is bluer than the total flux (Fig.28). The MgII line is polarized in the same way as the neighboring continuum (Table 8). This may well be a case of scattering by dust outside the BLR. Several stars around the quasar (within 4°) show a small polarization (%), and the PA tendency is not clear although two of them with large estimated distances (2.4kpc and 0.5kpc) have PAs rather close to the polarization PA of Q2115-305.
3.14 Q0350-073
The polarization looks almost constant, though slightly higher around rest 4000Å, and the polarized flux shape under the small blue bump looks the same as the total flux (Fig.29). There seems to be some PA rotation at the red end of the spectrum. MgII line might be polarized at a different PA from the continuum. Only small polarizations for Galactic stars (%) are found within 10° from the quasar, and no clear PA tendency is seen.
3.15 Q0205+024
This is a quasar which shows the spectrum of narrow-line Seyfert 1 galaxies. The polarization level is small (Fig.30). It looks constant over 4000Å and the ratio is consistent with unity but with a rather large uncertainty. Two stars (within 5° from the quasar) show 0.2-0.3% polarization at 140-160°.
4 Discussion
4.1 The Balmer edge feature
4.1.1 Observed edge feature
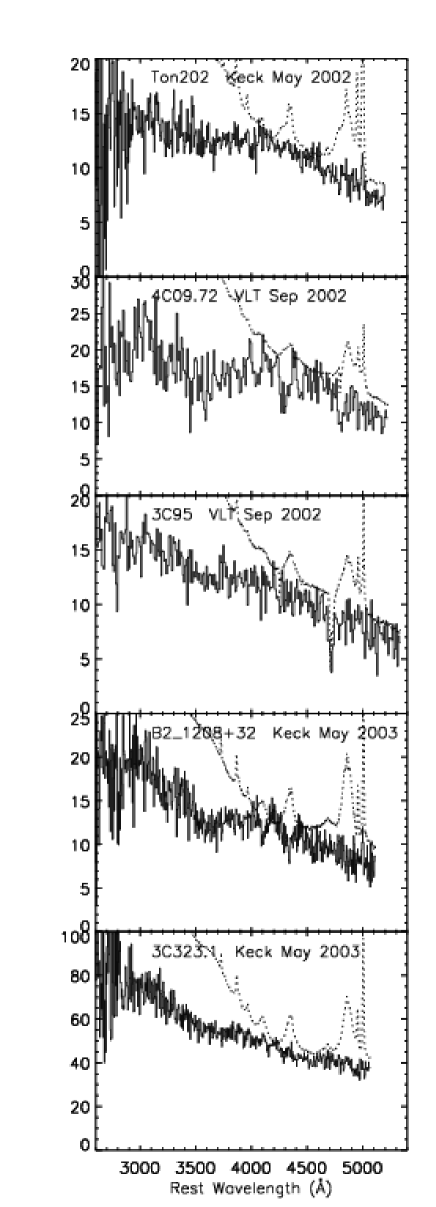
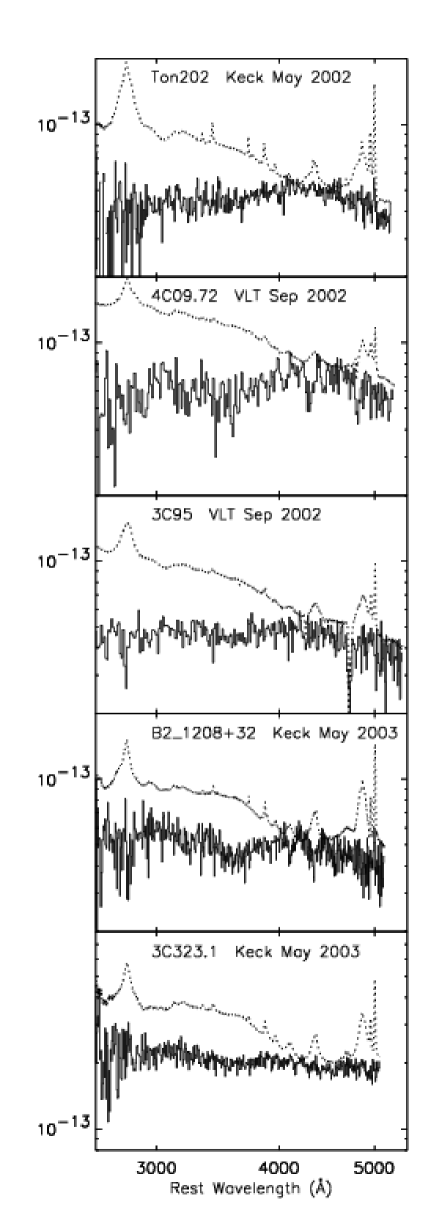
In Fig.31 we show the comparison of the spectrum, i.e. essentially the polarized flux spectrum, for Ton 202 from Paper I and for 4C09.72, 3C95, 3C323.1 (after the ISP correction) and B2 1208+32. The wavelengths are all in the rest frame of each quasar. The spectra for all five objects are compared in Fig.32. Note that in the ISP corrections, the uncertainty in the PA of the ISP leads to some uncertainty in the ISP-corrected polarized flux shape, but it is qualitatively unchanged as we have described in the previous section (though the shape in 3C323.1 is a little more ambiguous than in 4C09.72 and 3C95).
The comparison shows that the slope of the polarized flux of all five quasars longward of 4000Å is essentially the same as that of the total flux continuum, but the slope has a down-turn at 4000Å (i.e. a local maximum at Å; we note in one case, 3C323.1, this seems to be at a substantially shorter wavelength than in others), around where the small blue bump starts in the total flux. In addition, another change (an up-turn) of the slope is seen at around 3600Å (i.e. the spectra have local minima at Å). This slope up-turn looks more evident in B2 1208+32, while both of the slope changes look very weak in 3C323.1. The slope up-turn was already suggested in Paper I for Ton 202, but the comparison of these five quasars rather strengthens the suggestion, since the position of this slope up-turn looks roughly similar in the five polarized flux spectra.
Based on all these, we identify this spectral feature, which is composed of these two slope changes, as a Balmer edge absorption feature: (1) the slope change at Å would be the start (long wavelength limit) of a broadened Balmer edge absorption feature (2) the change of the slope at 3600Å would be the position of the maximum opacity, with the flux shape at the shorter wavelength side being formed by the combination of the intrinsic continuum color and the decrease of the continuum opacity, although the slope looks still very red in the first three objects. The feature may be widespread, since the edge features in the five objects look rather similar, and a few other objects show behavior which may also be similar, but which is less clear.
In addition, there seem to be more spectral features in the shorter UV wavelengths. We will briefly describe those in section 4.2.
4.1.2 Simplest Interpretations
The polarized flux of all these quasars essentially show no emission lines, and thus the polarization is confined to the continuum. These quasars have lobe-dominant radio jets, and the direction of the optical continuum polarization (E-vector direction) is in all cases parallel to the radio structure, as we discuss in the next section. The unpolarized broad emission lines in our quasars lead to the inference that the polarization originates interior to the BLR.222These properties are quite in contrast with Seyfert 2 galaxies where the broad emission lines and continuum are both polarized in the same way, and the polarization is very high and perpendicular to the radio structure (Antonucci, 1993). Based on these properties, the polarization in these type 2 objects is thought to be caused by polar scattering of the radiation from a hidden nucleus and BLR along the jet direction by matter in a region outside the BLR. The exact cause of the polarization is not well understood in these quasars, but we have discussed some simple possibilities in Paper I, all based on some form of electron scattering. Dust scattering is unlikely, since the region is thought to be interior to the BLR and thus within the dust sublimation radius. The electron scattering might originate in the atmosphere of putative plane-parallel scattering-dominated disk. However, this case suffers from the wrong prediction of the polarization direction, i.e. perpendicular to the symmetry axis of the disk which is thought to be along the jet direction (see Paper I for more discussion). Alternatively, the polarization is caused by an optically thin oblate pure electron scattering region surrounding the BBB emitter (with the BBB emission being unpolarized, e.g. completely depolarized by Faraday depolarization with magnetic fields in the disc atmosphere; Agol & Blaes 1996; Agol, Blaes & Ionescu-Zanetti 1998). This produces the right polarization direction if the minor axis of the oblate shape is along the jet. In this latter case, the polarized flux is simply proportional to the BBB emission. In the case of electron scattering in the disk atmosphere, the polarized flux is being produced as a part of the BBB emission and is thus intrinsic to the BBB emission. Therefore, in both of these cases, the Balmer edge feature seen in our quasars should be intrinsic to the BBB emission.
To summarize, our most simple interpretation is that the observed Balmer edge absorption feature is intrinsic to the BBB emission. If this is correct, then the observed feature directly indicates that the BBB emission is indeed thermal, and its emitter is optically thick. However, there is much to learn from the details of the polarized flux features, which tend to repeat from object to object, if we can identify them in theoretical models. We also discuss other possibilities below in section 4.1.4.

4.1.3 Broadening and a disk atmosphere model
The onset of the edge feature looks broadened over the whole range from Å to Å. This could be at least partly due to the high-order Balmer absorption lines and possibly metal lines as well. However, the observed feature suggests a broadening due to a high velocity dispersion in the gravitational potential well. Very naively, in terms of a simple black-body disk, the expected velocity dispersion looks roughly consistent with the observed extent of broadening. The radius Å) emitting the radiation around 4000Å is given as
where , and are the mass of the black hole, radiative efficiency ( with accretion rate ) and Eddington luminosity, respectively, and . The radius corresponds to for a Keplerian rotation, thus roughly consistent with the apparent broadening.
Detailed disk model spectra (Hubeny et al. 2000) are roughly in agreement with these simple estimates, although considerable flux in the Balmer edge region can arise from smaller radii in some disk models. As mentioned in section 1, accretion disk modeling of the Balmer edge region is complicated by the fact that the relevant annuli contain internal hydrogen ionization zones. These result in very steep, convectively unstable temperature gradients, as well as density inversions. This only adds to the considerable uncertainty in the vertical structure of such models.
As an illustration, Fig.33 shows a face-on disk model around a Kerr () black hole of mass M⊙, accreting at 2 M⊙ yr-1. The model spectrum has arbitrary normalization, and is plotted on top of the Ton 202 Keck data from May 2002. Disks viewed at higher inclinations will have the edge smeared out further and shifted toward the blue. The model does not include any lines, particularly high order Balmer lines and metal lines that may help shift the edge to longer wavelengths. Note that the model spectrum is the total flux spectrum, and some polarizing mechanism would still need to be invoked. (The intrinsic polarized flux produced by the disk model at nonzero inclinations has a much stronger edge feature, and is polarized in the wrong direction.)
If the Balmer edge arises from a disk, an atmosphere contributing to the edge at some radius might change on a time scale comparable to the thermal time at the effective photosphere. This will be less than the local thermal time of the entire disk thickness at that radius, which is
where is the Shakura & Sunyaev (1973) viscosity parameter. This might be consistent with the time scale between observations. However, the disk would have to do this in a coordinated fashion at all radii producing flux in the Balmer edge region, and this probably requires reprocessing of radiation from the inner disk. (Such reprocessing is already required in disk models in order to explain the near simultaneous optical/UV continuum variability observed in quasars.)
4.1.4 Alternative possibilities
As discussed in Paper I, we cannot rule out some alternative explanations. One possible case would be that the feature is due to foreground absorption. However, a simple foreground absorption is unlikely, due to the lack of a huge Lyman edge absorption in quasars. This is expected in a simple foreground absorption case, since the Lyman edge is a resonant feature, unlike the Balmer edge. In particular, for the five objects shown in Fig.31, the ones with available far-UV spectra (4C09.72 and Ton202; Lanzetta, Turnshek & Sandoval 1993) do not show such a strong Lyman edge absorption.
Alternatively, our Balmer edge absorption feature could be imprinted in the scattering medium itself, i.e. both scattering and absorption are occurring in the same region. This is actually the favored model for the circumstellar disks of Be stars. In these systems, the radiation from the stellar photosphere is electron-scattered by the circumstellar disk. Due to the absorption opacity in the disk medium competing with electron scattering, absorption signatures are imprinted in the scattered light spectrum. Thus a large Balmer edge is seen in the polarized flux (e.g. Bjorkman et al. 1991; note that their Fig.1 shows and , not directly ).
The same thing might be happening to our quasars. The edge feature could be imprinted by the circumnuclear scattering region — this scattering region might possibly be the BLR clouds. However, our argument is based on the empirical fact that there is essentially no feature seen in the broad-line wavelengths, either in absorption or in emission. This fact (1) suggests that the spatial scale of the scattering region is smaller than that of the BLR as we have argued, (2) seems to be against any simple scattering model involving in situ absorption.
Also, the fact that the edge feature looks quite broadened might require quite specific conditions (e.g. high velocity dispersion) for the medium producing the feature. If the feature is imprinted in the scattering region, these conditions might put the scattering region as deep in the potential well as a part of the continuum emitter: this is equivalent to one of our simple pictures, i.e. the polarization and the feature in the polarized flux originate from the BBB emitter and thus are intrinsic to the BBB emission.
It is possible that the outer part of the disk itself scatters the radiation from the inner regions. This would give the right polarization direction parallel to the disk symmetry axis (which is supposed to be along the radio jet axis). The Balmer edge feature could be intrinsic to the radiation from the inner regions or could be imprinted by the outer part of the disk. In either case, the medium producing the feature must satisfy the constraints we discussed above: that the broad lines are essentially unseen and the edge is broadened.
4.2 UV spectral features
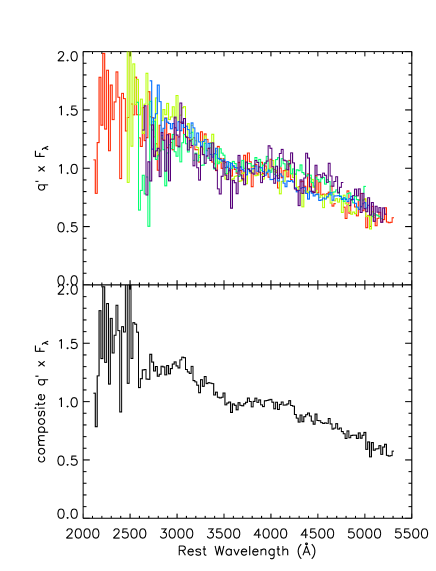
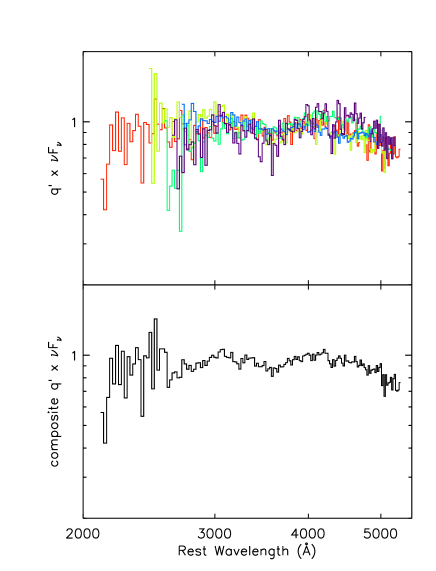
We have so far concentrated on the spectral feature at the Balmer edge region. However, there are apparently more spectral features in the polarized flux at shorter wavelengths in at least some of the objects shown in Fig.31: a local peak at Å, and/or absorption shortward of Å, and a possible absorption at Å. These look clearer in the overplotted and composite spectra shown in Fig.34 and 35. To produce the composite, we first normalized the five polarized flux spectra by the mean flux between 2800Å and 5000Å in the rest frame of each quasar excluding the wavelengths affected by telluric absorptions, binned the spectra with a 20Å width (shown in the upper panel), and then took the average of these five with equal weighting (the lower panel).
The identification and interpretation of these possible spectral features is not still clear, but they might be related to FeII absorption and possibly the Bowen resonance-fluorescence lines which are expected often to be highly polarized. One of the authors (RA) would offer US$100,000 to anyone who successfully identifies them. To be decisive on these possible features, we need more data with a higher S/N at this wavelength region on these and other quasars.
| Name | z | (erg/s) | Radio | PAopt | PAcor | PA | EW ratio | ref | |||
| at 4000Å | (W/Hz/sr) | Axis (°) | (°) | (°) | (°) | ||||||
| Parallel | |||||||||||
| Q0414-060 | 0.775 | 46.07 | 25.77 | 152 | 162 | 10 | 1.78 | 2 | |||
| 3C95 | 0.616 | 46.01 | 25.79 | 166 | 1 | 9 | 23 | 1.13 | 3 | ||
| 4C09.72 | 0.433 | 45.89 | 25.06 | 143 | 119 | 131 | 12 | 1.44 | 4 | ||
| Q0003+158 | 0.450 | 45.80 | 25.21 | 114 | 94 | 87 | 27 | 1.98 | 4 | ||
| 3C323.1 | 0.264 | 45.41 | 25.11 | 20 | 16 | 10 | 10 | 1.73 | 4 | ||
| B2 1208+32 | 0.388 | 45.35 | 24.65 | 3 | 29 | 26 | 1.45 | 7 | |||
| Ton202 | 0.366 | 45.21 | 24.64 | 53 | 69 | 16 | 1.05 | 4 | |||
| Q2349-014 | 0.174 | 44.96 | 24.60 | 170 | 155 | 15 | 1.69 | 6 | |||
| Intermediate | |||||||||||
| Q0405-123 | 0.573 | 46.67 | 26.04 | 13 | 139 | (160?) | 54 | 2.08 | 1 | ||
| Q1004+130 | 0.240 | 45.49 | 24.72 | 121 | 67 | (45?) | 54 | 0.51 | 4 | ||
| Perpendicular | |||||||||||
| Q2115-305 | 0.979 | 46.44 | 26.33 | 149 | 55 | 86 | 2.06 | 2 | |||
| Q0350-073 | 0.962 | 46.34 | 26.32 | 97 | 170 | 73 | 0.96 | 2 | |||
| Q2251+113 | 0.326 | 45.43 | 25.17 | 138 | 51 | 87 | 1.00 | 4 | |||
| Not classified | |||||||||||
| Q1912-550 | 0.402 | 45.26 | 24.72 | 5 | 1 | ||||||
| Q0205+024 | 0.155 | 44.98 | 22.62 | 80? | 3 | 77? | 5 | ||||
4.3 Radio properties
In Table 9, we have summarized the radio properties of our quasar sample along with the polarimetric properties. The quasars observed are all radio-loud except Q0205+024. For these radio-loud quasars, radio maps with resolved structures are available in the literature except for Q1912-550. All of them show edge-brightened FR-II morphology.
It is known that there is a strong statistical tendency for the optical polarization E-vector direction to lie parallel to the radio structural axis in quasars and Seyfert 1s (Stockman et al. 1979; Moore & Stockman 1984; Rusk & Seaquist 1985; Antonucci 1983, 2002), though there are some cases where the optical polarization direction lies rather perpendicular to the radio axis (Moore & Stockman 1984; Antonucci 2002; Smith et al. 2002). Some quasars in our sample also show a perpendicular relationship (2 of them are included in Moore and Stockman sample), while most of the others show parallel polarization. In Fig.36, the histogram of the difference of these two PAs (PA) is shown for our sample. It is not certain whether this distribution indicates bimodality (e.g. a dip test [Hartigan & Hartigan 1985] does not reject unimodality with a significant confidence level). The bimodality is also uncertain in the large samples such as those of Moore & Stockman (1984) and Rusk & Seaquist (1985) (again, a dip test does not give a statistically significant result). In Table 9, we have classified the quasars into three groups simply as ’parallel’ (PA 30°), ’intermediate’ (30° PA 60°), and ’perpendicular’ (60° PA). Some properties seem to have a possible PA dependence as we discuss below.

4.3.1 , line polarization and Balmer edge
Most of the quasars in the parallel group show a decrease in polarization shortward of 4000Å, meaning an (at least partially) unpolarized small blue bump. We show the polarization ratio in Table 9 (taken from Table 6). Those in the parallel group also show essentially unpolarized emission lines: many of them have a tight upper limit on the broad line EW in the polarized flux compared to that in the total flux, as we show in Table 9 the ratio of the former to the latter (for H, or MgII if H not available; see Tables 7 and 8). It also seems that the quasars in the parallel group tend to have the Balmer edge absorption feature in the polarized flux: all the five quasars shown in Fig.31 are in this parallel group, and the feature is possibly seen in another parallel quasar Q0003+158.
On the other hand, the quasars in the perpendicular group do not seem to show the decrease shortward of 4000Å ( or ), which indicates that they tend to have a polarized small blue bump. While the constraint on is still not tight in two of the three quasars, the other one (Q2115-305) shows increase instead of decrease. The broad lines also look polarized in these objects: this is quite certain in Q2115-305; marginal in Q0350-073; in Q2251+113, the line polarization is puzzling in that the PA rotation seen at the lines is not present in the small blue bump wavelengths. We have plotted against PA in Fig.37, which illustrate the correlation between them (95.9% statistical significance in the Spearman’s rank correlation coefficient, and 96.2% in the Kendall’s).
Note also that depends on the strength of small blue bump in the total flux. In fact, the small blue bump seems to be stronger in the parallel ones and weaker in the perpendicular ones. This is shown in Fig.38. As a rough strength measure for the small blue bump, we simply take the ratio of the total flux at 3050Å to that at 4200Å (so of course this also depends on the color of the underlying continuum), and convert it to the corresponding spectral index where . This index is plotted against PA, which illustrates the correlation (99.8% statistical significance in the Spearman’s rank correlation coefficient, and 99.9% in the Kendall’s). Thus, is probably measuring the effects from both the polarization and the strength of the small blue bump.
For the intermediate group, we note that Q0405-123, as we described in the previous section, shows a polarization PA rotation shortward of rest 4000Å, which is similar to 4C09.72 (and 3C95 or 3C323.1) and may be due to ISP contamination. The PA of the intrinsic polarization could be at 160°, which would put this object close to the ’parallel’ group (PA 33°). Note also that Q1004+130 may have an ISP contamination, and the intrinsic polarization PA could be at 45°, which would put it into a ’perpendicular’ group (PA 76°). Even before this correction, this object looks similar to Q2115-305 in terms of the rising toward shorter wavelengths. These possible re-evaluations of PA look consistent with the properties described above for the parallel and perpendicular groups, though we did not detect H line polarization in Q1004+130.


4.3.2 and viewing angle
For the ones with resolved radio structure, the ratio of the core to lobe luminosity can provide a rough indication for the viewing angle, the angle of our line of sight to the jet axis (Wills & Browne, 1986). Or, a better quantity is the ratio of the core luminosity to optical luminosity (Wills & Brotherton, 1995), denoted as . We have calculated this latter ratio for each quasar in our sample with available core flux measurements, following Wills & Brotherton (1995). The values are shown in Table 9. Note that the value for Q2115-305 is regarded as an upper limit since its available map is coarse and no flat-spectrum core seems to be well isolated. The values for the two perpendicular ones and Q1004+130 are smaller than the others, suggesting that the perpendicular ones have a larger viewing angle than the parallel ones (this tendency is also seen in the values of ).
4.3.3 Possible interpretation for these and other AGN
The overall tendencies for the small blue bump polarization, broad line polarization, and viewing angles could be understood if we suppose that (1) electron scattering is occuring in a flat or oblate compact (100-1000?) optically thin region interior to the BLR, and (2) electron or dust scattering is occuring in an extended ( pc) optically thin polar region exterior to the BLR, as deduced from the unified model.
When the viewing angle is small, the scattered light from the 100-1000 flat compact region dominates, resulting in a small parallel polarization of the continuum only. The objects have Type 1 spectra. When the viewing angle is somewhat larger, and the the inner disk-like flat scattering region becomes occulted or otherwise ineffective, the pc-scale region dominates: this would cause a small perpendicular polarization when the BBB and BLR aren’t occulted or just attenuated leading to a perpendicular-polarized Type 1, and a Type 2 when these components do become occulted. In fact the continuum of the perpendicular ones in our sample might be redder than the parallel ones, based on the flux ratio at 3050Å and 4200Å which would depend both on the color of the continuum under the small blue bump and the strength of the small blue bump (the continuum color longward of the small blue bump wavelengths could not be obtained reliably from our data for high-redshift ones in particular).
For the polarization of Seyfert 1 galaxies, Smith et al. (2004) have already suggested that two different scattering regions exist, one in an inner equatorial region and the other in an outer polar region. The difference from our case is that those Seyfert 1 galaxies with the parallel property have polarized broad lines, and the polarization PA is different from that of the continuum with the polarization magnitude lower than that of the continuum (e.g. Smith et al. 2002). This is also the case in some broad-line radio galaxies (Cohen et al. 1999). In these cases, the inferred inner equatorial scattering region would be comparable in size to the BLR.
The distinction between the ones with essentially unpolarized lines (i.e. most of the parallel quasars in our sample) and the ones with partially polarized lines is not yet clear, but it might be related to optical luminosity. Many of the objects with partially polarized lines are of a rather low optical luminosity ( at 4000Å erg/s), while the ones with unpolarized lines in our sample are of a rather high optical luminosity ( at 4000Å erg/s; see Table 9). However, an object like 3C382, which has partially polarized broad lines, has a rather high optical luminosity ( at 4000Å erg/s). We need a larger sample for the distinction to be clarified.
5 Conclusions
In our previous paper, we have reported our detection of a Balmer edge feature in one quasar, Ton202, which was observed in May 2002. We have since implemented VLT/FORS1 and Keck spectropolarimetry in Sep 2002 and May 2003, respectively, on 14 more quasars with a known 1% optical polarization, and also re-observed Ton 202 in May 2003. Some of these observations are affected by interstellar polarization, but the measurements have been corrected for this effect reasonably well. Among the newly observed 14 quasars, the high or relatively high S/N polarized flux of at least four quasars (4C09.72, 3C95, 3C323.1, B2 1208+32) shows essentially no emission lines. We have found that these four quasars show a Balmer edge feature in the polarized flux, which is quite similar to that seen in Ton202 observed in May 2002.
Based on the unpolarized broad emission lines, the polarized flux is thought to originate interior to the BLR, and the Balmer edge feature is most simply interpreted as an intrinsic spectral feature of the Big Blue Bump emission. In this case, the edge absorption feature indicates that the BBB emission is thermal and optically thick. However, we have also discussed other alternative interpretations.
The Balmer edge feature identified in the polarized flux of these five quasars is entirely a new finding. The feature is apparently widespread, based on its similarity in these well observed objects, and the possible similar behavior of the polarized flux at around 4000Å in two other objects (Q0003+158, Q1912-550). There also seem to be more spectral features in the shorter rest UV wavelengths of the polarized flux, which are common to multiple objects.
In the re-observation of Ton202 in May 2003, we did not find a similar dramatic feature. This is apparently due to real polarization variability. This is not unexpected since the polarization is thought to originate from a small scale, less than the size scale of broad line region. The polarization variability of normal quasars (aside from synchrotron dominated objects) has been reported in the literature. This object, as well as other objects should be followed up to confirm the variability.
Among the 15 quasars in our sample, 13 are radio-loud quasars with an available radio map. While many of them show the optical polarization roughly parallel to the radio structural axis, some of them show the polarization rather perpendicular to the radio axis (however, the bimodality is not certain). Although the sample is too small to draw strong conclusions, the parallel ones tend to show an unpolarized and stronger small blue bump (thus shows a polarization drop shortward of 4000Å), unpolarized broad lines, a Balmer edge absorption feature in the polarized flux, and a smaller viewing angle, while the perpendicular ones tend to show a polarized and/or weaker small blue bump, polarized broad lines, and a larger viewing angle.
Based on our spectropolarimetric data and other data in the literature, the parallel type 1 objects seem to have at least partially unpolarized broad lines. The ones with (almost completely) unpolarized lines might have a higher optical luminosity than the ones with partially unpolarized lines. However, a much larger sample is required to clarify this distinction.
Acknowledgments
This research has made use of the NASA/IPAC Extragalactic Database (NED) which is operated by the Jet Propulsion Laboratory, California Institute of Technology, under contract with the National Aeronautics and Space Administration. This research has also made use of the SIMBAD database, operated at CDS, Strasbourg, France. The authors thank A. Barth for providing calibration data. The work by RA was supported in part by NSF grant AST-0098719. The work by OB was supported in part by NASA grant NAG5-13228.
References
- Agol & Blaes (1996) Agol, E., Blaes, O., 1996, MNRAS, 282, 965
- Agol, Blaes & Ionescu-Zanetti (1998) Agol, E., Blaes, O., Ionescu-Zanetti, C. 1998, MNRAS, 293, 1
- Antonucci (1983) Antonucci, R. 1983, Nature, 303, 158
- Antonucci (1984) Antonucci, R. 1984, ApJ, 278, 499
- Antonucci (1985) Antonucci, R. 1985, ApJS, 59, 499
- Antonucci (1988) Antonucci, R. 1988, in Supermassive Black Holes, ed. M. Kafatos (Cambridge: Cambridge Univ. Press), 26
- Antonucci (1993) Antonucci R., 1993, ARA&A, 31, 473
- Antonucci et al. (1996) Antonucci, R., Geller, R., Goodrich, R. W., Miller, J. S. 1996, ApJ, 472, 502
- Antonucci (1999) Antonucci, R. 1999, in High Energy Processes in Accreting Black Holes, ASP Conf. Ser. 161, 193
- Antonucci (2002) Antonucci, R. 2002, in Astrophysical Spectropolarimetry (Cambridge: Cambridge Univ. Press), 151
- Avila, Rupprecht, & Beckers (1997) Avila, G., Rupprecht, G., Beckers, J.M. 1997, SPIE, 2871, 1135
- Bjorkman et al. (1991) Bjorkman K. S., et al., 1991, ApJ, 383, L67
- Blaes et al. (2001) Blaes, O., Hubeny, I., Agol, E., Krolik, J. H. 2001, ApJ, 563, 560
- Blaes (2004) Blaes, O. 2004, in AGN Physics with the Sloan Digital Sky Survey, ASP Conference Series, G. T. Richards & P. B. Hall, eds., in press.
- Berriman et al. (1990) Berriman, G., Schmidt, G. D., West, S. C., Stockman, H. S., 1990, ApJS, 74, 869
- Brotherton et al. (2002) Brotherton M. S., Croom S. M., De Breuck C., Becker R. H., Gregg M. D., 2002, AJ, 124, 2575
- Cardelli et al. (1989) Cardelli J. A., Clayton G. C., Mathis J. S., 1989, ApJ, 345, 245
- Cohen et al. (1999) Cohen, M., Ogle, P.M., Tran, H.D., Goodrich, R.W., Miller, J.S. 1999, AJ, 118, 1963
- Czerny & Elvis (1987) Czerny, B., & Elvis, M. 1987, ApJ, 321, 305
- Fanti et al. (1977) Fanti, C., Fanti, R., Formiggini, L., Lari, C., Padrielli, L. 1977, A&AS, 28, 351
- Gregg et al. (2000) Gregg M. D., Becker R. H., Brotherton M. S., Laurent-Muehleisen S. A., Lacy M., White R. L., 2000, ApJ, 544, 142
- Hartigan & Hartigan (1985) Hartigan, J. A., Hartigan, P. M. 1985, Ann. Statist. 13, 70
- Heiles (2000) Heiles, C. 2000, AJ, 119, 923
- Hubeny et al. (2000) Hubeny, I., Agol, E., Blaes, O., Krolik, J. H., 2000, ApJ, 533, 710
- Hutchings et al (1998) Hutchings, J.B., Dewey, A., Chaytor, D., Ryneveld, S., Gower, A.C., Ellingson, E. 1998, PASP, 110, 111
- Kellermann et al. (1994) Kellermann, K.I., Sramek, R.A., Schmidt, M., Green, R.F., Shaffer, D.B. 1994, AJ, 108, 1163
- (27) Kishimoto, M., Antonucci, R., Blaes, O. 2003, MNRAS, 345, 253 (Paper I)
- Kishimoto et al. (2003) Kishimoto, M., Antonucci, R., Boisson, C., & Blaes, O. 2004, Progress of Theoretical Physics Supplement, in press
- Koratkar & Blaes (1999) Koratkar, A., Blaes, O., 1999, PASP, 111, 1
- Kriss et al. (1999) Kriss, G. A., Davidsen, A. F., Zheng, W., Lee, G., 1999, ApJ, 527, 683
- Lanzetta et al. (1993) Lanzetta, K. M., Turnshek, D. A., Sandoval, J., 1993, ApJS, 84, 109
- Laor et al. (1990) Laor, A., Netzer, H., Piran, T., 1990, MNRAS, 242, 560
- Laor et al. (1997) Laor, A., et al. 1997, ApJ, 477, 93
- Lee, Kriss & Davidsen (1992) Lee, G., Kriss, G. A., & Davidsen, A. F. 1992, in AIP Conf. Proc. 2540, Testing the AGN Paradigm, ed. S. S. Holt, S. G. Neff, & C. M. Urry (New York: AIP), 159
- (35) Miller, J. S., Robinson, L. B., Goodrich, R. W., 1988, in Instrumentation for Ground-Based Astronomy, ed. L. B. Robinson (New York, Springer), p. 157
- Moore & Stockman (1984) Moore, R. L., Stockman, H. S. 1984, ApJ, 279, 465
- Oke et al. (1995) Oke, J. B. et al. 1995, PASP, 107, 375
- Price et al. (1993) Price, R., Gower, A.C., Hutchings, J.B., Talon, S., Duncan, D., Ross, G. 1993 ApJS, 86, 365
- Reid, Kronberg, & Perley (1999) Reid, R.I., Kronberg, P.P., Perley, R.A. 1999, ApJS, 124, 285
- Romney et al. (1984) Romney, J. et al 1984, A&A, 135, 289
- Rudnick, Sitko, & Stein (1984) Rudnick, L, Sitko, M.L., Stein, W.A. 1984, AJ, 89, 753
- Rusk & Seaquist (1985) Rusk, R., Seaquist, E. R. 1985, AJ, 90, 30
- Schlegel et al. (1998) Schlegel, D. J., Finkbeiner, D. P., Davis, M. 1998, ApJ, 500, 525
- Schmidt et al. (1992) Schmidt, G. Elston, R., Lupie, O. L., 1992, AJ, 104, 1563
- Schmidt & Smith (2000) Schmidt, G., Smith, P., 2000, ApJ, 545, 117
- (46) Serkowski, K., Mathewson, D.S., Ford, V.L. 1975, ApJ, 196, 261
- Shakura & Sunyaev (1973) Shakura N. I., Sunyaev R. A., 1973, A&A, 24, 337
- Simmons & Stewart (1985) Simmons J. F. L., Stewart B. G., 1985, A&A, 142, 100
- Stockman et al. (1979) Stockman, H. S., Angel, J. R. P., Miley, G. K. 1979, ApJ, 227, L55
- (50) Stockman, H.S., Moore, R.L., Angel, J.R.P. 1984, ApJ, 279, 485
- Smith et al. (2002) Smith, J. E., Young, S., Robinson, A., Corbett, E. A., Giannuzzo, M. E., Axon, D. J., Hough, J. H. 2002, MNRAS, 335, 773
- Smith et al. (2004) Smith J. E., Robinson A., Alexander D. M., Young S., Axon D. J., Corbett E. A., 2004, MNRAS, 350, 140
- Telfer et al. (2002) Telfer, R. C., Zheng, W., Kriss, G. A., Davidsen, A. F. 2002, ApJ, 565, 773
- Visvanathan & Wills (1998) Visvanathan, N., Wills, B.J. 1998, AJ, 116, 2119
- Whittet et al. (1992) Whittet, D.C.B., Martin, P.G., Hough, J.H., Rouse, M.F., Bailey, J.A., Axon, D.J. 1992, ApJ, 386, 562
- Wills & Browne (1986) Wills, B.J., Browne, I.W.A., 1986, ApJ, 302, 56
- Wills & Brotherton (1995) Wills B. J., Brotherton M. S., 1995, ApJ, 448, L81
- Wills, Brandt, & Laor (1999) Wills B. J., Brandt W. N., Laor A., 1999, ApJ, 520, L91
- Young et al. (1999) Young, S., Corbett, E. A., Giannuzzo, M. E., Hough, J. H., Robinson, A., Bailey, J. A., Axon, D. J. 1999, MNRAS, 303, 227
- Zheng et al. (1997) Zheng, W., Kriss, G. A., Telfer, R. C., Grimes, J. P., Davidsen, A. F., 1997, ApJ, 475, 469