Accurate rest frequencies of methanol maser
and dark cloud lines††thanks: Tables 1 to 3 are also available
in electronic form at the CDS via anonymous ftp to
cdsarc.u-strasbg.fr (130.79.128.5)
or via http://cdsweb.u-strasbg.fr/cgi-bin/qcat?J/A+A/
We report accurate laboratory measurements of selected methanol transition frequencies between 0.834 and 230 GHz in order to facilitate astronomical velocity analyses. New data have been obtained between 10 and 27 GHz and between 60 and 119 GHz. Emphasis has been put on known or potential interstellar maser lines as well as on transitions suitable for the investigation of cold dark clouds. Because of the narrow line widths ( km s-1) of maser lines and lines detected in dark molecular clouds, accurate frequencies are needed for comparison of the velocities of different methanol lines with each other as well as with lines from other species. In particular, frequencies for a comprehensive set of transitions are given which, because of their low energy levels ( cm-1 or 30 K), are potentially detectable in cold clouds. Global Hamiltonian fits generally do not yet yield the required accuracy. Additionally, we report transition frequencies for other lines that may be used to test and to improve existing Hamiltonian models.
Key Words.:
Masers – Molecular data – Method: laboratory – Techniques: spectroscopic – ISM: molecules – Radio lines: ISM1 Introduction and Motivation
1.1 Methanol masers
Methanol (CH3OH) is the molecule with the largest number of known interstellar maser lines. These transitions arise from a wide range of energy levels above the ground state, and modeling their excitation provides important information on their emitting regions. Based on the small number of lines known at the time, Batrla et al. (1986) were the first to suggest that all methanol maser transitions belong to either one of two types, named class I and class II by Menten (1991a,b).
Obviously, the lines considered (within each class) have to arise from the same region for excitation modeling to make sense. The first clue that this indeed is the case comes from the observation that different transitions cover very similar LSR velocity ranges. Moreover, in particular for class I maser lines, the frequently very sparse spectra (sometimes showing a single strong feature only) look very similar for different transitions (apart from their intensities); see, e.g., Fig. 1 of Menten 1991b. The conclusion made in the latter reference, that class I methanol masers are associated with interstellar outflows and frequently found far away (up to a pc) from their exciting sources, while class II masers arise from the closest, warm ( K), dense ( cm-3) environment of newly formed high-mass stars, has been confirmed by all subsequent observations (see astronomical references in Table 1). This dichotomy is coupled to their excitation: As model calculations show (Leurini et al. 2004a), class I masers arise from basic properties of the methanol molecule via collisional excitation, if no strong far-infrared field is present, i.e. far away from stars. In contrast, class II masers are pumped by infrared radiation (from the embedded objects), most likely via one or more torsionally excited states (e.g., Sobolev & Deguchi 1994).
A common origin of different maser lines has been directly proven – so far – in only a few cases: Very Long Baseline Interferometry observations of the two strongest class II maser lines, the and transitions, at 6.7 and 12.2 GHz, respectively, show that, indeed, maser spots in both lines do arise from identical locations on milliarcsecond (few AU) scales (Menten et al. 1992). More recently, Kogan and Slysh (1998) found something similar for class I maser transitions in DR21(OH) by combining their observations of at 44.0 GHz with those of at 95.2 GHz by Plambeck and Menten (1990).
While such direct imaging certainly proves the coexistence issue, it is available for few lines and few sources only. Thus, a lot of the interpretation depends on comparison of line profiles. Therefore, a need for rest frequency values of the highest possible accuracy is rather obvious.
1.2 Methanol in dark clouds
As mentioned above, methanol is readily found in hot, dense molecular cores in high-mass star-forming regions.
In contrast, few observations of methanol in cold dark clouds have been made. This is partially due to the weakness of the emission, which is optically thin and has a low excitation temperature in such sources, where small CH3OH/H2 ratios of order – are found. Such values can be readily explained by gas phase chemistry models.
The first observations of CH3OH in cold, dark clouds where made by Friberg et al. (1988), who detected the and -type and the -type lines of the quartet near 96.7 GHz as well as the 48.4 GHz transition. Sources included the well-studied molecule-rich clouds TMC-1, L134N (= L183), and B335. Turner (1998) added a number of other lines to the still small list of methanol lines observed in dark clouds (see Table 2).
Of particular importance in this context is the detection of enhanced absorption (over-cooling or anti-inversion) of the 12.2 GHz line against the cosmic microwave background radiation toward TMC-1 and L183 (Walmsley et al. 1988). No line better demonstrates the class I/II maser dichotomy than this transition, the second most luminous and widespread class II maser line known (Batrla et al. 1987), which is pumped by prodigious far-infrared radiation near newly formed high-mass (proto)stars. In class I sources, in contrast, as well as in dark clouds, i.e. in regions devoid of strong far-infrared radiation, this line becomes anti-inverted by the same mechanism, that produces the () maser lines (see Table 1 and Leurini et al. 2004a,b).
2 Existing data and new laboratory measurements
Modern millimeter-wavelength spectroscopy of methanol effectively started with the classic paper by Lees & Baker (1968).
An early compilation of line rest frequencies was presented by Lees et al. (1973). Many of the millimeter and submillimeter transition frequencies commonly used by astronomers today are the result of a concerted laboratory measurement/theory effort by the Duke, then Ohio State University group. They used large quantities of measured line frequencies to fit the (many) parameters of an extended internal axis method Hamiltonian, yielding better than 100 kHz accuracy fits to the bulk of the frequencies (Herbst et al. 1984; De Lucia et al. 1989; Anderson et al. 1990).
The published frequencies in the older references had typical uncertainties of 0.1 MHz. At 100 GHz, this corresponds to a velocity uncertainty of 0.3 km s-1, comparable to the line widths of single maser features.
More recently, these measurements have been extended to selected frequency regions between 550 and 1200 GHz by Belov et al. (1995) employing the Cologne Terahertz Spectrometer. Still higher frequency measurements were published e. g. by Matsushima et al. (1994) and Odashima et al. (1995). In the latter laboratory, rather comprehensive measurements have been performed between 7 and 200 GHz (Tsunekawa et al. 1995). Even further measurements and often model Hamiltonians have been reported in references cited in these articles and the ones mentioned below.
The highest accuracy measurements available for lines in the radio frequency and centimeter wavelength ranges, where high accuracy is most important, were made by Radford (1972), Heuvel and Dymanus (1973), and Gaines et al. (1974), employing beam-maser spectroscopy. Later, Mehrotra et al. (1985) and Breckenridge & Kukolich (1995) employed microwave Fourier transform (MWFT) spectroscopy.
In this paper, we present a compilation of frequencies of all known class I and II methanol maser lines. Values with the highest accuracy published were chosen in general. In addition, we used spectrometers available in Cologne and Kiel for accurate measurements of selected methanol transition frequencies.
3 Cologne and Kiel laboratory measurements
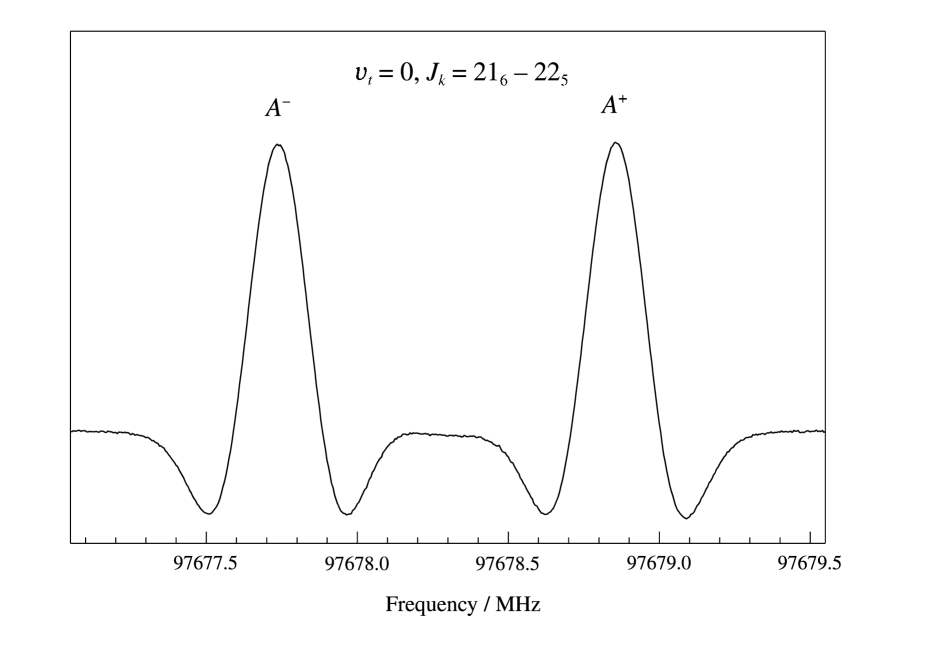
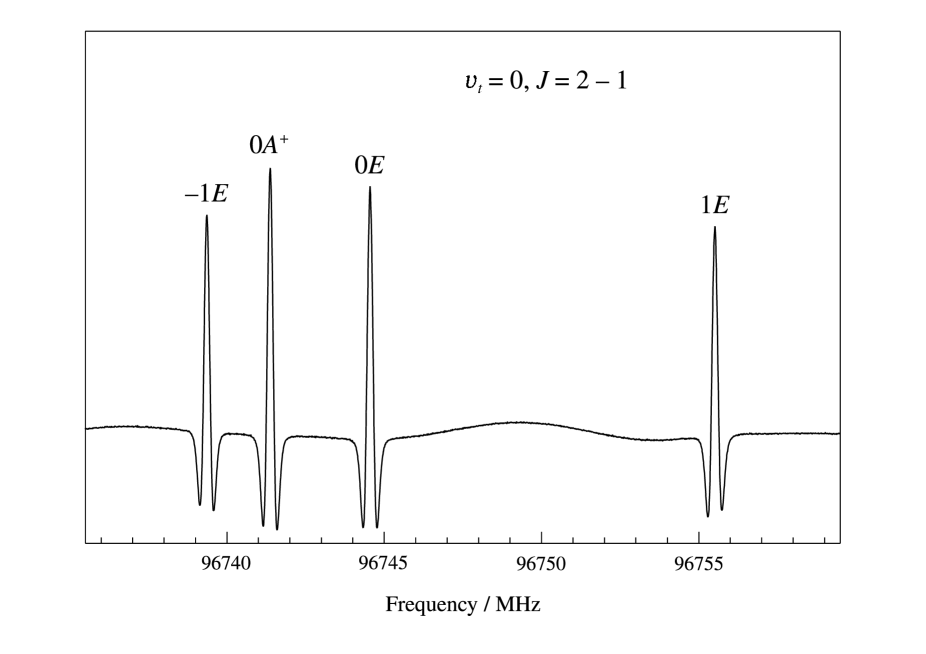
The frequency region between 60 and 119 GHz has been investigated in Cologne employing AM-MSP1 and AM-MSP2 millimeter wave synthesizers (Analytik & Meßtechnik GmbH, Chemnitz, Germany) as sources and a Schottky diode detector. Details of the spectrometer were described by Winnewisser et al. (2000). The absorption cell was about 3.5 m long. In order to obtain accurate line positions, low pressures (0.1 – 1.0 Pa) and a large number of data points were used. Figs. 1 and 2 demonstrate the very good signal-to-noise ratio and the smoothness of the baseline for strong to moderately weak transitions.
Two waveguide microwave Fourier transform spectrometers were used for the measurements in Kiel which cover the regions of roughly 8 – 18 and 18 – 26 GHz. Further details on the spectrometer are given by Krüger et al. (1993) and Meyer et al. (1991).
Table 1 presents our compilation of laboratory frequencies of all known interstellar methanol maser lines. References for the first astronomical detection of maser111In some transitions narrow maser emission is observed as well as broader (quasi)thermal emission. emission are also given for each line. The latest version of Frank Lovas’ “NIST Recommended Rest Frequencies for Observed Interstellar Molecular Microwave Transitions”, Revision 2002 (Lovas 2004), proved an invaluable resource in compiling it. We augmented this Table with high accuracy rest frequencies obtained by us and other groups where appropriate. The methanol transition frequencies and uncertainties in the Lovas (2004) compilation are the calculated values from Xu & Lovas (1997); see also the discussion. The Xu & Lovas (1997) data are also available online in the Cologne Database for Molecular Spectroscopy, CDMS, described in Müller et al. (2001) and Müller et al. (2004).
Table 2 gives frequencies for strong transitions with lower state energies below 20 cm-1 and frequencies below 200 GHz for which laboratory frequencies with less than 30 kHz uncertainties are known. Note that some transitions may be both in Table 1 and Table 2.
Only very few transitions have larger uncertainties (of the order 50 kHz).
Finally, Table 3 summarizes the remaining transition frequencies determined in the course of the present study. These frequencies, together with the newly measured ones in Tables 1 and 2, may be useful for improving existing methanol Hamiltonians.
| Classa | Transition, | Frequency (MHz)c | (cm-1) | (D2) | Laboratory Ref.e | Astronomical Ref.f |
|---|---|---|---|---|---|---|
| I?g | 834.267(2)h | 11.705 | 1.2129 | Radford 1972 | Ball et al. 1970 | |
| I?g | 5005.32079(20)h | 19.703 | 0.4693 | HD73 | Robinson et al. 1973 | |
| II | 6668.5192(8) | 33.876 | 5.0768 | BR95 | Menten 1991 | |
| I | 9936.202(4) | 76.102 | 2.7769 | BR95 | Slysh et al. 1993 | |
| II | 12178.597(4) | 13.556 | 1.9848 | BR95 | Batrla et al. 1987 | |
| II | 19967.3961(2) | 18.803 | 0.9244 | M85 | Wilson et al. 1985 | |
| II | 23121.0242(5) | 98.053 | 3.1467 | M85 | Wilson et al. 1984 | |
| I | 24928.707(7) | 24.310 | 2.8073 | This work | Barrett et al. 1975 | |
| I | 24933.468(2) | 30.764 | 3.9283 | Gaines et al. 1974 | Barrett et al. 1971 | |
| I | 24934.382(5) | 19.469 | 1.5948 | Gaines et al. 1974 | Barrett et al. 1975 | |
| I | 24959.0789(4) | 38.833 | 5.0264 | M85 | Barrett et al. 1971 | |
| I | 25018.1225(4) | 48.514 | 6.1287 | M85 | Barrett et al. 1971 | |
| I | 25124.8719(4) | 59.809 | 7.2483 | M85 | Barrett et al. 1971 | |
| I | 25294.4165(2) | 72.717 | 8.3910 | M85 | Barrett et al. 1971 | |
| I | 25541.3979(4) | 87.239 | 9.5570 | M85 | Menten et al. 1986 | |
| I | 25878.2661(4) | 103.373 | 10.7398 | M85 | Matsakis et al. 1980 | |
| I | 26847.233(50) | 140.478 | 13.0919 | T95 | Wilson et al. 1996 | |
| I | 27472.531(30) | 161.449 | 14.2057 | T95 | Wilson et al. 1996 | |
| I | 28169.462(30) | 184.032 | 15.2244 | T95 | Wilson et al. 1996 | |
| I | 28905.812(30) | 208.226 | 16.0977 | T95 | Wilson et al. 1996 | |
| II | 28969.942(50) | 83.319 | 3.0236 | T95 | Wilson et al. 1993 | |
| I | 29636.936(10) | 234.031 | 16.7716 | T95 | Wilson et al. 1996 | |
| I | 30308.034(10) | 261.445 | 17.1961 | T95 | Wilson et al. 1996 | |
| I | 36169.265(30) | 18.803 | 2.5184 | T95 | Morimoto et al. 1985⋆ | |
| II | 37703.700(30) | 61.930 | 2.4051 | T95 | Haschick et al. 1989 | |
| II | 38293.268(50) | 58.813 | 0.9488 | T95 | Haschick et al. 1989 | |
| II | 38452.677(50) | 58.813 | 0.9495 | T95 | Haschick et al. 1989 | |
| I | 44069.410(10) | 43.694 | 6.1380 | T95 | Morimoto et al. 1985 | |
| I | 84521.169(10) | 25.254 | 3.0830 | This work | Batrla & Menten 1988⋆ | |
| II | 86615.600(5) | 68.493 | 1.3578 | This work | Sutton et al. 2001⋆ | |
| II | 86902.949(5) | 68.493 | 1.3596 | This work | Sutton et al. 2001⋆ | |
| I | 95169.463(10) | 54.888 | 7.2211 | This work | Plambeck & Wright 1988⋆ | |
| I | 104300.414(7) | 106.779 | 3.4141 | This work | Voronkov et al. 2004⋆ | |
| II | 107013.803(5) | 16.134 | 3.0088 | This work | Val’tts et al. 1995a⋆ | |
| II | 108893.963(7) | 5.490 | 0.9784 | This work | Val’tts et al. 1999⋆ | |
| I | 132890.692(10) | 33.316 | 3.6871 | T95 | Slysh et al. 1997⋆ | |
| I | 146618.794(50) | 67.679 | 8.3288 | T95 | Menten 1991b | |
| II | 156488.868(10) | 61.930 | 6.7830 | T95 | Slysh et al. 1995a⋆ | |
| II | 156602.413(10) | 9.681 | 1.9963 | T95 | Slysh et al. 1995a⋆ | |
| II | 156828.533(10) | 49.035 | 6.2749 | T95 | Slysh et al. 1995a⋆ | |
| II | 157048.625(10) | 37.749 | 5.6636 | T95 | Slysh et al. 1995a⋆ | |
| II | 157179.017(10) | 28.073 | 4.9589 | T95 | Slysh et al. 1995a⋆ | |
| II | 157246.056(10) | 20.009 | 4.1725 | T95 | Slysh et al. 1995a⋆ | |
| II | 157270.851(10) | 5.490 | 1.4611 | T95 | Slysh et al. 1995a⋆ | |
| II | 157272.369(10) | 13.556 | 3.3178 | T95 | Slysh et al. 1995a⋆ | |
| II | 157276.058(10) | 8.717 | 2.4090 | T95 | Slysh et al. 1995a⋆ | |
| I | 229758.760(50) | 54.266 | 5.0473 | Sastry et al. 1985 | Slysh et al. 2002⋆ |
aGives the maser type. Interstellar methanol masers are either class I or to II; see text and Menten 1991a,b. bThe parity of symmetry transitions is given as superscript. If the parities of the upper (left) and lower (right) state differ, the parities are given as upper and lower superscript, respectively. cNumbers in parentheses denote the measurement uncertainties in units of the least significant figures. dLower state level energies are all relative to the ground-state () level of the -symmetry species. The E-type ground state () level is at a 5.490 cm-1 higher energy. eHD73 stands for Heuvel & Dymanus 1973; BR95 for Breckenridge & Kukolich 1995, M85 for Mehrotra et al. 1985, and T95 for Tsunekawa et al. 1995. fOnly the first reference reporting maser emission in this line is given. An asterisk means that this line was earlier detected in thermal emission or absorption. See Lovas (2004) for relevant references. gSee section 4.3. for a discussion of these lines. hThe 1H hyperfine splitting has been resolved to some extent in the laboratory. For the transition, four components, spread over 19.4 km s-1, have been observed. The frequency in the Table is the one of the strongest component; the intensity weighted average is 1 kHz lower. For the transition, two components, split by 0.19 km s-1, have been observed.
| Masera | Transition, | Frequency (MHz)c | (cm-1) | (D2) | Laboratory Ref.e | Dark cloud ref.f |
|---|---|---|---|---|---|---|
| I? | 834.267(2) | 11.705 | 1.2129 | Radford 1972 | Slysh et al. 1995b | |
| 2502.7785(10) | 14.904 | 0.6725 | HD73 | ND | ||
| I? | 5005.32079(20) | 19.703 | 0.4693 | HD73 | Kalenskiĭ et al. 2004 | |
| II | 12178.595(3) | 13.556 | 1.9848 | Gaines et al. 1974 | Walmsley et al. 1988 | |
| II | 19967.3961(2) | 18.803 | 0.9224 | M85 | ||
| I | 24934.382(5) | 19.469 | 1.5948 | Gaines et al. 1974 | ||
| I | 36169.265(30) | 18.803 | 2.5184 | T95 | ||
| 48372.4558(7) | 0.000 | 0.8086 | HD73 | Friberg et al. 1988 | ||
| 48376.892(10) | 9.122 | 0.8084 | T95 | Kaifu et al. 2004 | ||
| 60531.489(10) | 8.717 | 1.4742 | This work | NO | ||
| 68305.640(20) | 13.963 | 0.4573 | This work | |||
| 95914.309(5) | 11.705 | 1.2141 | This work | |||
| 96739.362(5) | 5.490 | 1.2133 | This work | Friberg et al. 1988 | ||
| 96741.375(5) | 1.614 | 1.6171 | This work | Friberg et al. 1988 | ||
| 96744.550(5) | 10.736 | 1.6167 | This work | Friberg et al. 1988 | ||
| 96755.511(5) | 16.241 | 1.2443 | This work | Menten et al. 1988 | ||
| 97582.804(7) | 11.733 | 1.2141 | This work | |||
| II | 107013.803(5) | 16.134 | 3.0088 | This work | ||
| II | 108893.963(7) | 5.490 | 0.9784 | This work | Turner 1998 | |
| 121689.975(10) | 16.241 | 2.8297 | T95 | |||
| 143865.801(10) | 14.904 | 2.1584 | T95 | |||
| 145093.707(10) | 13.963 | 2.4249 | T95 | |||
| 145097.370(10) | 8.717 | 2.1569 | T95 | Turner 1998 | ||
| 145103.152(10) | 4.840 | 2.4257 | T95 | Turner 1998 | ||
| 145131.855(10) | 19.469 | 2.2119 | T95 | |||
| 146368.342(50) | 14.988 | 2.1585 | T95 | |||
| II | 156602.413(10) | 9.681 | 1.9963 | T95 | ||
| II | 157270.851(10) | 5.490 | 1.4611 | T95 | ||
| II | 157272.369(10) | 13.556 | 3.3178 | T95 | ||
| II | 157276.058(10) | 8.717 | 2.4090 | T95 | ||
| 165050.195(10) | 10.736 | 1.3466 | T95 | |||
| 165061.156(10) | 13.963 | 2.2373 | T95 | |||
| 165099.271(10) | 18.803 | 3.1170 | T95 | |||
| 170060.581(10) | 19.469 | 3.1205 | T95 | ND | ||
| 191810.509(10) | 19.703 | 3.0352 | T95 | ND | ||
| 193415.367(10) | 18.803 | 3.2327 | T95 | ND | ||
| 193441.610(10) | 13.556 | 3.0330 | T95 | ND | ||
| 193454.361(10) | 9.681 | 3.2342 | T95 | ND | ||
| 195146.760(10) | 19.870 | 3.0353 | T95 | ND |
For nomenclature see also notes to Table 1. aI and II mean that these lines are class I and II maser transitions, respectively, in some non-dark cloud regions (see Table 1). fOnly references reporting the first detection of a line in cold ( K) dark clouds are listed. For non-dark cloud astronomical references to first detections, see Lovas (2003). “ND” means that no astronomical detection is reported in the latter reference; “NO” means that the line is not observable from the ground. gThis line appears in enhanced absorption (i.e. is over-cooled) against the cosmological microwave background radiation. References in italics report observations of a given line that did not yield its detection.
| Transition, | Frequency (MHz)c | Transition, | Frequency (MHz)c | |||||
|---|---|---|---|---|---|---|---|---|
| 0 | 10058.268(2) | 1 | 96501.705(10) | |||||
| 0 | 11841.902(1) | ND | 1 | 96513.675(10) | ||||
| 0 | 14407.777(1) | ND | 1 | 96588.582(5) | ||||
| 0 | 14446.665(1) | ND | 0 | 97677.738(5) | ||||
| 0 | 16941.190(1) | ND | 0 | 97678.857(7) | ||||
| 0 | 17513.342(2)x | ND | 0 | 99602.078(10) | ND | |||
| 0 | 19390.121(6) | ND | 0 | 101737.173(20) | ||||
| 1 | 20970.651(1) | 0 | 102122.667(10) | |||||
| 1 | 21550.300(6) | 0 | 102658.046(7) | |||||
| 0 | 21708.662(5) | ND | 0 | 102704.298(20) | ND | |||
| 0 | 23854.261(6) | ND | 1 | 102957.691(7) | ||||
| 0 | 25787.125(10) | ND | 0 | 103381.146(5) | ||||
| 1 | 26120.584(10) | ND | 0 | 104060.657(10) | ||||
| 0 | 66947.895(20) | ND | 0 | 104336.562(7) | ||||
| 0 | 76247.283(5) | 0 | 104354.819(5) | |||||
| 0 | 76509.668(7) | 0 | 104410.446(5) | |||||
| 0 | 78254.011(20) | ND | 0 | 105063.691(5) | ||||
| 0 | 80993.241(7) | 0 | 105576.290(10) | |||||
| 0 | 81318.424(20) | ND | 0 | 107159.820(10) | ||||
| 0 | 83792.561(10) | ND | 0 | 109136.883(7) | ||||
| 0 | 84423.776(5) | 0 | 109153.107(10) | |||||
| 1 | 84930.946(10) | ND | 0 | 110060.492(20) | ND | |||
| 1 | 85346.076(7) | ND | 0 | 111254.256(20) | U | |||
| 0 | 85568.084(10) | 0 | 111289.550(10) | |||||
| 1 | 85773.092(7) | ND | 0 | 111626.449(15)T | ||||
| 0 | 87066.748(10) | ND | 0 | 112490.953(15) | ND | |||
| 0 | 87241.339(10) | ND | 0 | 112745.243(10) | ND | |||
| 0 | 89505.808(5) | 0 | 113408.094(7) | ND | ||||
| 0 | 91254.686(10) | ND | 0 | 114650.861(5) | ||||
| 1 | 93196.673(10) | 0 | 115800.166(20) | ND | ||||
| 1 | 94022.734(10) | ND | 0 | 117636.228(10) | NO | |||
| 0 | 94541.765(5) | ND | 1 | 118156.280(10) | NO | |||
| 0 | 94814.987(10) | ND | 1 | 118207.927(5) | NO | |||
| 1 | 96396.040(7) | 0 | 118293.492(5) | NO | ||||
| 0 | 96446.619(15) | 1 | 118481.011(5) | NO | ||||
| 1 | 96492.152(7) | 0 | 118522.453(15) | NO | ||||
| 1 | 96493.540(10) |
For nomenclature see notes to Table 1. Tsunekawa et al. (1995) give 111626.846(30) MHz for the frequency of the line marked with T; we suspect a typographical error, see section 4.1, where also some assignments for are discussed. Heuvel and Dymanus 1973 give 17513.34127(20) MHz for the unsplit position of the line marked with x. All lines, except those marked “ND” have been detected in astronomical sources. See Lovas (2004) for references to first detections. “ND” means that no astronomical detection is reported in the latter reference. “U” means that this line is listed as unidentified in Lovas (2004).
4 Discussion and conclusions
4.1 Comparison with earlier results
The newly obtained transition frequencies are generally much more accurate than previously published values, sometimes by more than a factor of 10. Moreover, they agree generally well within experimental uncertainties both with older measurements summarized in Xu & Lovas (1995) and with more recent measurements from Tsunekawa et al. (1995). Specifically, among the new lines in Tables 1 and 2 there is only one for which the agreement is not quite within estimated uncertainties with either data. The value of 86615.760 MHz in Xu & Lovas (1995) originates from Sastry et al. (1985) and has an uncertainty of 100 kHz in that paper. Tsunekawa et al. (1995) give 86615.578 MHz with an uncertainty of 10 kHz. Both values differ slightly from our value of 86615.600(5) kHz. But since experimental uncertainties are usually given as values, agreement “only” within twice or three times the larger uncertainties should not be of major concern. Moreover, our current value is in excellent agreement with the calculated value of 86615.602(14) kHz in Xu & Lovas (1995). Also, the transition frequencies around 96 GHz given in Table 2 agree within 1 to 4 kHz with calculated values in Xu & Lovas (1995). In most instances, this is less than both the experimental and the calculated uncertainties.
The agreement of the transition frequencies in Table 3 with calculated values in Xu & Lovas (1995) is mostly within 50 kHz or three times the calculated uncertainties, whichever is larger; only some high lines show larger deviations. This level of agreement is satisfactory. It should be pointed out that the calculated frequencies and uncertainties not only in Xu & Lovas (1995), but for all Hamiltonian models depend on the quality of the model employed and on the quality of the input data. Since the input data in Xu & Lovas (1995) has an accuracy of 50 or 100 kHz for the most part it cannot be expected that the predictions are much better than this in general – irrespective of the predicted uncertainties. Moreover, while predictions are usually reliable in cases of interpolation, extrapolations should always be viewed with caution.
In addition, most transitions in Table 3 had been measured already by Tsunekawa et al. 1995. The agreement is almost always good to very good, meaning within three and one times the combined experimental uncertainties, respectively. There are, however, lines with larger deviations: For the line they report 111626.846(30) MHz while we measured 111626.449(15) MHz. The latter value is in good agreement with 111626.530(100) MHz measured by Sastry et al. (1985) and with 111626.550(35) MHz calculated by Xu & Lovas (1995). Therefore, we suspect a typographical error by Tsunekawa et al. A bigger discrapancy occured for the transition. Tsunekawa et al. (1995) report 12198.200(50) MHz. No line was measured at that position in the course of the present investigation. Pearson communicated an alternative position almost 200 MHz lower for this transition from an ongoing investigation into the ro-torsionial spectrum of CH3OH, a reassignment for the line at 14446.665 MHz, supposedly the transition, as well as an alternative position for the latter. Lines with very good signal-to-noise ratio could be measured within 100 kHz of the predictions.
4.2 Astronomical impact
On occasion, astronomical measurements have been used to propose improved rest frequencies compared to the ones obtained in the laboratory. While it may be sometimes easy to obtain very precise astronomical line frequencies, the determination of accurate positions (i. e. the absolute line position) is significantly more difficult. Nevertheless, astronomical observations have pointed at deficiencies in the accuracy of laboratory rest frequencies and have provided improved values in several instances. In fact, the laboratory measurements by Gaines et al. (1974) were sparked by seemingly different velocity shifts for the -symmetry, , transitions with 6 and 7 observed by Chui et al. (1974). The greatly improved transition frequencies of Gaines et al. (1974) resolved these discrepancies.
Friberg et al. (1988) proposed an improved rest frequency of the line by comparison with the velocities of other lines with more accurately known frequencies. However, their shift from 96741.42 MHz to 96741.39 MHz was close to the extrapolated uncertainty of 0.04 MHz. On the other hand, Turner (1998) found no need for a revised rest frequency; his downward shift by 8 kHz was well within the uncertainty of 32 kHz. Our new frequency implies an even larger downward shift of 45 kHz, see Table 2, which is in perfect agreement with the calculated position from Xu & Lovas (1997), see above.
To give just one example of the impact our (in many cases revised) frequencies have on the interpretation of maser data, we mention that Val’tts et al. (1995) proposed a revision of the 107013.85(10) MHz rest frequency by Lees & Baker (1968) to 107013.67 MHz. The present results clearly show that that shift is too large. In fact, our value of 107013.803(5) MHz, see Table 1, is well within the uncertainties of Lees & Baker (1968). Indeed, when critically examining their revised velocities, e.g. , that of the strongest maser feature in W3(OH) and the thermal emission components in Orion-KL, with literature values of other methanol lines, we believe that the value presented here is the most appropriate.
4.3 A note on the low frequency lines
The identification of certain lower-, , transitions as masers is uncertain. Given the large linewidths and extended emission distribution observed in the Galactic center region (and only there), the line, the first interstellar methanol transition discovered, does clearly not show high gain maser action. However, the fact that it appears in emission against a high brightness temperature continuum background indicates that it must be weakly inverted, like low quantum number transitions from various other complex molecules found near the Galactic center; see Menten (2004). Optical depth estimates are of order (see Gottlieb et al. 1979), which implies certainly no strong maser action. The same arguments apply to the line, which is also seen in emission toward Sgr B2 and at least one other location in the Galactic center region, G (Sgr B1; Mezger & Smith 1976). Recent calculations on CH3OH excitation predict these lines and other lines to be very weak class I masers under certain conditions (Leurini et al. 2004a).
5 Summary
The present manuscript provides accurate transition frequencies for methanol maser as well as dark cloud lines, several of which have been determined in the course of the present investigation. This compilation of methanol lines should be useful for velocity analyses of methanol masers and of dark clouds. Moreover, the newly determined transition frequencies will be useful for improving existing Hamiltonian models for methanol. This is of particular importance for obtaining improved methanol rest frequencies in the 26 – 54 GHz region for which it may be difficult to improve the data in the laboratory.
Acknowledgements.
The work in Bonn and Cologne has been supported by the Deutsche Forschungsgemeinschaft via grant SFB 494. Additional funding by the science ministry of the Land Nordrhein-Westfalen is also acknowledged. We thank John C. Pearson for comments on and new predictions for some transitions with . We also thank the referee, Slava Slysh, for a super-diligent reading and his useful remarks; in particular he pointed out a newly detected maser line (at 104.3 GHz).References
- Anderson, de Lucia, & Herbst (1990) Anderson, T., de Lucia, F., & Herbst, E. 1990, ApJS, 72, 797
- Ball, Gottlieb, Lilley, & Radford (1970) Ball, J. A., Gottlieb, C. A., Lilley, A. E., & Radford, H. E. 1970, ApJ, 162, L203
- Barrett, Ho, & Martin (1975) Barrett, A. H., Ho, P., & Martin, R. N. 1975, ApJ, 198, L119
- Barrett, Schwartz, & Waters (1971) Barrett, A. H., Schwartz, P. R., & Waters, J. W. 1971, ApJ, 168, L101
- Batrla & Menten (1988) Batrla, W. & Menten, K. M. 1988, ApJ, 329, L117
- Batrla, Matthews, Menten, & Walmsley (1987) Batrla, W., Matthews, H. E., Menten, K. M., & Walmsley, C. M. 1987, Nature, 326, 49
- (7) Belov, S. P., Winnewisser, G., & Herbst, E 1995, J. Mol. Spectrosc., 174, 253
- Breckenridge & Kukolich (1995) Breckenridge, S. M. & Kukolich, S. G. 1995, ApJ, 438, 504
- (9) Chui, M. F., Cheung, A. C., Matsakis, D., Townes, C. H., & Cardiasmenos, A. G. 1974, ApJ, 187, L19
- (10) De Lucia, F. C., Herbst, E., Anderson, T., & Helminger, P. 1989, J. Chem. Phys., 134, 394
- Friberg, Hjalmarson, Madden, & Irvine (1988) Friberg, P., Hjalmarson, A., Madden, S. C., & Irvine, W. M. 1988, A&A, 195, 281
- Gaines, Casleton, & Kukolich (1974) Gaines, L., Casleton, K. H., & Kukolich, S. G. 1974, ApJ, 191, L99
- Gottlieb, Ball, Gottlieb, & Dickinson (1979) Gottlieb, C. A., Ball, J. A., Gottlieb, E. W., & Dickinson, D. F. 1979, ApJ, 227, 422
- Haschick, Baan, & Menten (1989) Haschick, A. D., Baan, W. A., & Menten, K. M. 1989, ApJ, 346, 330
- (15) Herbst, E., Messer, J. K., De Lucia, F. C., & Helminger, P. 1984, J. Mol. Spectrosc., 108, 42
- (16) Heuvel, J. E. M., & Dymanus, A. 1973, J. Mol. Spectrosc., 45, 282
- Kaifu et al. (2004) Kaifu, N., et al. 2004, Publ. Astron. Soc. Japan, 56, 69
- (18) Kalenskiĭ, Slysh, V. I., Goldsmith, P. F., & Johansson, L. E. B. 2004, ApJ, 610, 329
- (19) Kogan, L., & Slysh, V. I., 1998, ApJ, 497, 800
- (20) Krüger, M., Harder, H., Gerke, C. & Dreizler, H., 1993, Z. Naturforschung, 48a, 737
- Lees & Baker (1968) Lees, R. M., & Baker, J. G. 1968, J. Chem. Phys., 48, 5299
- Lees et al. (1973) Lees, R. M., Lovas, F. J., Kirchhoff, W. H. & Johnson, D. R. 1973, J. Phys. Chem. Ref. Data, 2, 205
- (23) Leurini, S., Menten, K. M., & Schilke, P. 2004a, to be submitted to A&A
- (24) Leurini, S., Schilke, P., Menten, K. M., Flower, D. T., Pottage, J. T., & Xu, L.-H. 2004b, A&A, 422, 573 – 585
- (25) Lovas, F. J. 2004, J. Phys. Chem Ref. Data, 33, 177
- Matsakis et al. (1980) Matsakis, D. N., Wright, M. C. H., Townes, C. H., Welch, W. J., Cheung, A. C., & Askne, J. I. H. 1980, ApJ, 236, 481
- (27) Matsushima, F., Evenson, K. M., & Zink, L. R., 1994, J. Mol. Spectrosc., 164, 517
- Menten (1991) Menten, K. M. 1991a, ApJ, 380, L75
- (29) Menten, K. M. 1991b, in “Skylines”, Proceedings of the Third Haystack Observatory Meeting, eds. A. D. Haschick & P. T. P. Ho (San Francisco: Astronomical Society of the Pacific), p. 119
- (30) Menten, K. M. 2004, in The Dense Interstellar Medium in Galaxies – Proceedings of the 4th Cologne-Bonn-Zermatt-Symposium, eds. S. Pfalzner, C. Kramer, C. Straubmeier, & A. Heithausen (Springer: Berlin) 69
- Menten et al. (1992) Menten, K. M., Reid, M. J., Pratap, P., Moran, J. M., & Wilson, T. L. 1992, ApJ, 401, L39
- Menten, Walmsley, Henkel, & Wilson (1986) Menten, K. M., Walmsley, C. M., Henkel, C., & Wilson, T. L. 1986, A&A, 157, 318
- Menten, Walmsley, Henkel, & Wilson (1988) Menten, K. M., Walmsley, C. M., Henkel, C., & Wilson, T. L. 1988, A&A, 198, 253
- (34) Mehrotra, S. C., Dreizler, H., & Mäder, H. 1985, Z. Naturforschung, 40a, 683
- (35) Meyer, V., Jäger, W., Schwarz, R. & Dreizler, H., 1991, Z. Naturforschung, 46a, 445
- Mezger & Smith (1976) Mezger, P. G. & Smith, L. F. 1976, A&A, 47, 143
- Morimoto, Kanzawa, & Ohishi (1985) Morimoto, M., Kanzawa, T., & Ohishi, M. 1985, ApJ, 288, L11
- (38) Müller, H. S. P., Thorwirth, S., Roth, D. A., & Winnewisser, G. 2001, A&A, 370, L49; see also http://www.ph1.uni-koeln.de/vorhersagen/
- (39) Müller, H. S. P., Thorwirth, S., Stutzki, J. & Winnewisser, G., in Proceedings of the 4th Cologne-Bonn-Zermatt-Symposium ”The Dense Interstellar Medium in Galaxies”; Springer Verlag, Heidelberg, 2004, 95–98
- (40) Odashima, H., Matsushima, F., Nagai, K., Tsunekawa, S., & Takagi, K., 1995, J. Mol. Spectrosc., 173, 404
- Plambeck & Wright (1988) Plambeck, R. L. & Wright, M. C. H. 1988, ApJ, 330, L61
- (42) Plambeck, R. L. & Menten, K., 1990, ApJ, 364, 555
- (43) Radford, H. E. 1972, ApJ, 174, 207
- Robinson, Brooks, Godfrey, & Brown (1974) Robinson, B. J., Brooks, J. W., Godfrey, P. D., & Brown, R. D. 1974, Australian Journal of Physics, 27, 865
- (45) Sastry, K. V. L. N., Lees, R. M., & DeLucia, F. D., 1985, J. Mol. Spectrosc., 103, 486
- Slysh, Kalenskiĭ, & Val’tts (1993) Slysh, V. I., Kalenskiĭ, S. V., & Val’tts, I. E. 1993, ApJ, 413, L133
- Slysh, Kalenskiĭ, & Val’tts (1995) Slysh, V. I., Kalenskiĭ, S. V., & Val’tts, I. E. 1995a, ApJ, 442, 668
- Slysh, Baan, Val’Ts, & Kalenskii (1995) Slysh, V. I., Baan, W. A., Val’tts, I. E., & Kalenskii, S. V. 1995b, Astronomy Reports, 39, 158
- Slysh, Kalenskiĭ, Val’tts, & Golubev (1997) Slysh, V. I., Kalenskiĭ, S. V., Val’tts, I. E., & Golubev, V. V. 1997, ApJ, 478, L37
- Slysh, Kalenskiĭ, & Val’tts (2002) Slysh, V. I., Kalenskiĭ, S. V., & Val’tts, I. E. 2002, Astronomy Reports, 46, 49
- Sobolev & Deguchi (1994a) Sobolev, A. M. & Deguchi, S. 1994, A&A, 291, 569
- Sutton et al. (2001) Sutton, E. C., Sobolev, A. M., Ellingsen, S. P., Cragg, D. M., Mehringer, D. M., Ostrovskii, A. B., & Godfrey, P. D. 2001, ApJ, 554, 173
- (53) Tsunekawa, S., Ukai, T., Toyama, A., & Takagi, K., Department of Physics, Toyama Univerity, Japan, 1995
- Turner (1998) Turner, B. E. 1998, ApJ, 501, 731
- Val’tts et al. (1995) Val’tts, I. E., Dzura, A. M., Kalenskiĭ, S. V., Slysh, V. I., Booth, R. S., & Winnberg, A. 1995, A&A, 294, 825
- Val’tts et al. (1999) Val’tts, I. E., Ellingsen, S. P., Slysh, V. I., Kalenskiĭ, S. V., Otrupcek, R., & Voronkov, M. A. 1999, MNRAS, 310, 1077
- (57) Voronkov, M. A., Sobolev, A. M., Ellingsen, S. P. Ostrovskii, A. B., & Alakoz, A.; Proc. of European Workshop on Astronomical Molecules, 17-20 February 2004, Zwolle, The Netherlands (in press)
- Walmsley, Menten, Batrla, & Matthews (1988) Walmsley, C. M., Menten, K. M., Batrla, W., & Matthews, H. E. 1988, A&A, 197, 271
- Wilson, Walmsley, Menten, & Hermsen (1985) Wilson, T. L., Walmsley, C. M., Menten, K. M., & Hermsen, W. 1985, A&A, 147, L19
- Wilson, Walmsley, Jewell, & Snyder (1984) Wilson, T. L., Walmsley, C. M., Jewell, P. R., & Snyder, L. E. 1984, A&A, 134, L7
- Wilson, Zeng, Huettemeister, & Dahmen (1996) Wilson, T. L., Zeng, Q., Hüttemeister, S., & Dahmen, G. 1996, A&A, 307, 209
- (62) Winnewisser, M., Lichau, H, & Wolf, F. 2000, J. Mol. Spectrosc. 202, 155
- (63) Xu, L.-H., & Lovas, F. J. 1997, J. Phys. Chem. Ref. Data., 26, 17