22institutetext: Universitätssternwarte Göttingen, Geismarlandstraße 11, 37083 Göttingen, Germany
33institutetext: Landessternwarte Heidelberg, Königstuhl, 69117 Heidelberg, Germany
Quantitative interpretation of the rotation curves of
spiral galaxies at redshifts and
We present decompositions of the rotation curves of three spiral galaxies at redshifts 0.7 and 1 into contributions by their bulges, disks, and dark halos, respectively. In order to set constraints on the degeneracy of the decompositions we interpret the morphology of the spiral structures quantitatively in the framework of density wave theory. Galaxy models constrained in such a way show that the distant galaxies, which are much younger than nearby galaxies, have very likely ‘maximum disks’, i.e. are dominated in their inner parts by baryonic matter. We argue that current theories of the cosmogony of galaxies must allow for these types of galaxies.
Key Words.:
galaxies: spiral — galaxies: kinematics and dynamics1 Introduction
The rotation curves of spiral galaxies, in particular the HI – rotation curves, have incontrovertibly revealed that the outer parts of the galaxies are dominated by dark matter. For instance, van Albada et al. (1985) have measured the rotation curve of NGC 3198 in HI extending radially outwards to 11 disk scale lengths, much beyond the optical disk. At such a galactocentric radius the rotation curve of a single disk would have fallen to half of its peak value at 2.2 radial scale lengths (cf. equation 5), whereas the observed rotation curve stays flat. However, there is an intense debate in the literature if and to what degree the inner parts of the galaxies, where their optical disks reside, are dominated by dark matter as well. The various arguments and the present state of this so called ‘maximum disk’ problem have been reviewed recently by Bosma (2004). The reason for this dispute is the notorious degeneracy of the decomposition of the rotation curves into the contributions by the various constituents of the galaxies such as bulge, stellar disk, interstellar gas disk, and dark halo, respectively. Thus, further constraints on the decomposition of the rotation curves are needed. Using arguments of the density wave theory of galactic spiral arms Fuchs (2003) has pointed out that the implied dynamics of the disks might provide such constraints for modelling spiral galaxies. Its application to the nearby bright galaxies NGC 2985 and NGC 3198 points towards maximum disk models in both cases, i.e. the contributions of the disks to the rotation curves are at the maximum allowed by the data. This would imply that baryons dominate completely the inner parts of the galaxies.
If this constraint is applied to the decomposition of the rotation curves of redshifted galaxies, this allows insight into the cosmogony of spiral galaxies. For this purpose Fuchs, Möllenhoff & Heidt (1998) have analyzed the optical rotation curves of two spiral galaxies at redshifts and , respectively, which had been imaged with HST and showed clearly discernible spiral structures. The rotation curves were measured with the Keck telescope (Vogt et al. 1996). Fuchs et al. (1998) concluded that the disks of these galaxies are submaximal. This has to be modified, though, because they assumed flat rotation curves for the galaxies. Since the rotation curves span radially only two and three radial scale lengths, respectively, the rotation curves are still rising over these ranges, which had not been taken into account. The disks were modelled as exponential disks, and their rotation curves rise until 2.2 radial scale lengths and develop only then a flat plateau (cf. equation 5). This affects the density wave theory argument through the coefficient in equation (8) below, and, when properly taken into account, the disks of the two redshifted galaxies seem to be maximum disks as well (Leeuwin & Fuchs, priv. com.).
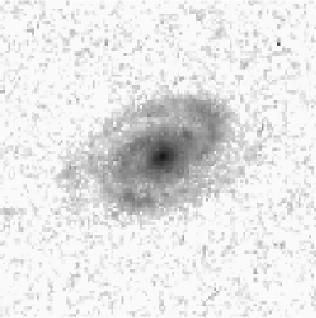
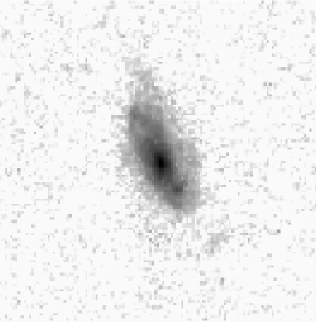
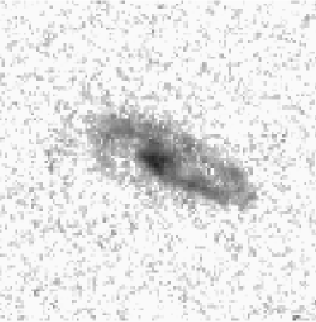
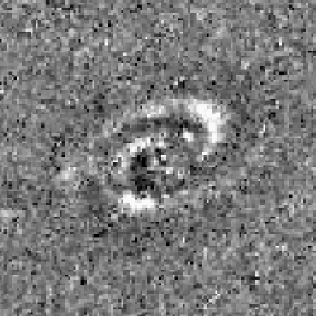
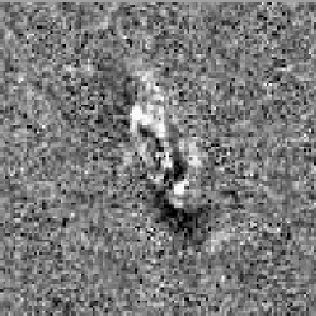
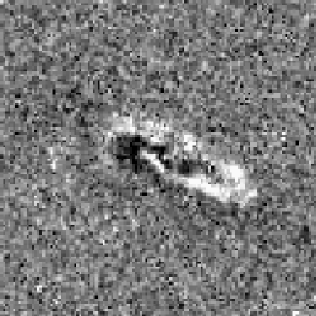
Lower panel: Corresponding residual images after subtraction of 2-dim models for disk and bulge. The remaining structures show the dominant bisymmetric arms. White, grey, and black colors corresponds to positive, zero, and negative residuals, respectively
.
In the present paper we investigate spiral galaxies identified in the FORS Deep Field (hereafter referred to as FDF, Appenzeller et al. 2000). The photometric survey is described in detail by Heidt et al. (2003). Ziegler et al. (2002) and Böhm et al. (2004) observed the kinematics of a large sample of FDF-galaxies in the redshift range . Three of the galaxies at turn out to be suitable for a quantitative analysis of their morphologies and kinematics and allow to extend our previous studies out to redshifts . The data are described in section 2. In sections 3 and 4 we construct dynamical models for the galaxies. As discussed in the final section the dynamical modelling seems to indicate maximum disks also in field galaxies in that redshift range.
seeing (FWHM), maximum rotation velocities,
and scale conversion factors of the observed galaxies
|
2 Observations
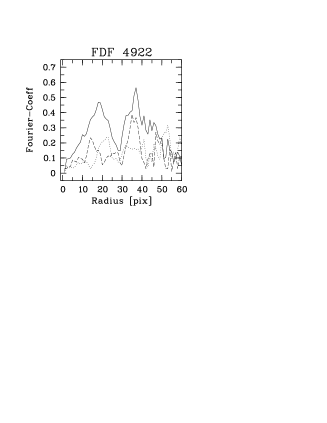
Böhm et al. (2004) have measured spatially resolved rotation curves of 77 galaxies in the FDF using the FORS spectrograph at VLT. 36 of these rotation curves were classified as high quality in terms of large radial extent and small asymmetries. Moreover, Ziegler and collaborators (Böhm et al., in preparation) have obtained HST images of the FORS Deep Field with the ACS wide field camera. The 6 6 arcmin field–of–view of the FDF was observed within 4 visits. Each visit was splitted into two exposures of 1180 s integration time using the F814W filter. We have examined the ACS image of each high quality object in the redshift range and found three galaxies showing discernible spiral structure: FDF 2484 at redshift , FDF 2174 at , and FDF 4922 at , respectively. The HST images of the galaxies are reproduced in the upper panels of Fig. 1. As can be seen from the residual images in the lower panels all galaxies show well developed two-armed spirals. The arm mode was confirmed by a Fourier analysis of the arm pattern as described in the next section (Fig. 2).


|
The optical rotation curves are shown as data points in Figs. 3 to 5 in section 4. The seeing during the spectroscopic observations is summarized in Table 1. For the determination of the misalignment between the galaxies’ apparent major axes and the slit directions, we took into account a slight rotation of the HST/ACS frames with respect to the FORS spectra. This tilt has been derived by coordinate transformations between the two reference systems and amounts to approximately deg. The last column in Table 1 gives scale conversion factors from arcsec to kpc. These have been determined in the same way as by Vogt et al. (1996) adopting a cosmological model with , which at the redshifts discussed here is similar to the concordance model with and . We assumed a Hubble constant of km s-1 Mpc-1.
As can be seen from Figs. 3 to 5 the rotation curves have been measured with good accuracy. The methods to extract the rotation curves from the spectra and to estimate the errors are described in detail in Böhm et al. (2004). The rotation curves are very regular and quite symmetric. Taken together with the unperturbed optical appearances of the galaxies this should allow in our view a reliable comparison with model rotation curves in order to draw inferences about the dark matter content.
3 Bulge–disk decomposition
The surface-brightness distributions of the galaxies were modelled in the same way as in Fuchs, Möllenhoff & Heidt (1998). A thin disk was assumed which has elliptical isophotes when seen under an inclination angle . The radial brightness profiles were fitted by an exponential function
| (1) |
with a scale length . For reasons of the easier handling of the dynamical models we adopt instead of a de Vaucouleurs law for the surface brightness profiles of the bulges softened power laws
| (2) |
where denotes the core radius. The corresponding three–dimensional distribution has the same form as equation (2), but with an exponent lowered to -3.5/2. The central density of the three-dimensional distribution is given by . The models (1) and (2) were fitted simultaneously to the data using the two–dimensional fitting code of Möllenhoff (2004). The parameters , and the position angle of the major axis of the disk are free fit-parameters. The photometric parameters of the best fits are given in Table 2. The angle in Table 2 is the position angle of the slit relative to the major axis of the inclined galaxy.
The fit to the surface–brightness distribution describes the axisymmetric structure of disk and bulge. Therefore the spiral arms appear clearly in the residual image = galaxy – model (Fig. 1, lower panels). The residual images were transformed to face–on view and the spiral arm pattern was Fourier-analyzed. Fig. 2 shows the radial variation of the coefficients =2, 3, 4 in the galaxies. The two–armed pattern =2 is dominant in all cases. The image of FDF 2174 shows that the spiral extends radially out to about 1.3 arcsecs. This corresponds in the diagram of the =2 Fourier coefficients in Fig. 2 to the indentation at a radius of about 25 pixel lengths. The very large amplitude of the =2 Fourier coefficients beyond that radius is caused by two outer patches lying nearly diagonally towards northeast and southwest, which are, however in our view, not related to the spiral structure (cf. Fig. 1). But as evidenced by the rotation curve, these outer regions do belong to the optical disk of the galaxy.
4 Decomposition of the rotation curves
We adopt model rotation curves of the form
| (3) |
where , , and denote the contributions by the bulge, disk, and dark halo, respectively. The bulge contribution is given by
| (4) |
where denotes the constant of gravitation. The rotation curve of an infinitesimally thin exponential disk is given by Freeman’s (1970) formula,
| (5) |
where is an abbreviation for and and denote Bessel functions. In equations (4) and (5) we use the scale lengths determined in the previous section and the ratios of / found by the quantitative modelling of the surface brightness photometry. Only the mass–to–light ratio is a free parameter which is determined as explained below. The dark halos are modelled as quasi–isothermal spheres
| (6) |
which leads to a contribution to the rotation curve of the form
| (7) |
Such density profiles of dark halos with homogeneous cores fit usually the rotation curves of galaxies better (de Blok, McGaugh & Rubin 2001, de Blok & Bosma 2002, Gentile et al. 2004) than centrally cusped profiles as proposed, for instance, by Navarro, Frenk & White (1997). The velocity fields described by the rotation curve model (3) are projected onto the sky adopting the inclination angles determined in the previous section. Next, the line–of–sight components of the rotation velocities are calculated and weighted by the surface brightness. The radial velocity fields were then convolved with two–dimensional Gaussians in order to model the blurring of the velocity fields by seeing. Finally the velocity field models were masked according to a slit width of 1 arcsec and the position angles of the slit given in Table 2 (cf. also Fig. 4 of Böhm et al. 2004). The synthetic rotation curves determined this way can be directly compared with the observed rotation curves.
Since the decomposition of the rotation curves is completely degenerate, we set constraints on the decomposition using arguments of the density wave theory of galactic spiral arms. The density wave theory predicts that spiral density waves grow preferentially with azimuthal wavelengths (Toomre 1981, Fuchs 2001)
| (8) |
where denotes the epicyclic frequency of the stellar orbits, . The coefficient depends on the slope of the rotation curve measured by Oort’s constant (Fuchs 2001). For a flat rotation curve its value is . The expected number of spiral arms is obviously given by how often the circumferential wavelength fits onto the annulus,
| (9) |
As was pointed out first by Athanassoula (1988) and Athanassoula et al. (1987) equations (9) and (8) can be used to determine the surface density of galactic disks once the rotation curve and thus the epicyclic frequency are known. In this way the morphological appearance of spiral galaxies constrains the decomposition of the rotation curve into its various contributions.
|
||||||||||||||||||||||||||||||||||||||||||||||||||||||||||||||||||
We have tested the prediction of equation (9) on the numerical simulation of the dynamical evolution of a galactic disk by Sparke & Sellwood (1987). The mass of the disk and the rotation curve are known from the setup of the simulation and we find that equation (9) predicts indeed a two–armed spiral as seen in the first snapshots of the simulation before it develops a bar.
5 Results and discussion

Lower panel: Expected number of spiral arms in the radial range where spiral structure can be seen. The dotted curve is again for the model with a dark halo included.


In the upper panels of Figs. 3 to 5 we present model rotation curves fitted to the observed rotation curves of the three galaxies assuming no dark halos. As can be seen from the figures the models fit well to the data. The corresponding dynamical parameters are listed in Table 3. The expected number of spiral arms estimated using equation (9) are shown as solid lines in the lower panels of Figs. 3 to 5. In each case the prediction is a two–armed spiral, exactly as observed. This hardly allows massive inner dark halos. Nevertheless, we also performed fits with dark halos.
Unfortunately, the rotation curves span radially only between two and four disk scale–lengths. The core radii of the dark halos are not well constrained in such cases (van der Kruit 1995). We have therefore adopted rather arbitrarily for each galaxy a core radius of 10 kpc. The central halo densities were chosen so that the expected number of spiral arms is still in accordance with the observed morphologies of the galaxies, i.e. two–armed spirals. The resulting fits are shown as dotted lines in Figs. 3 to 5. As can be seen from the figures they are of the same quality as in the case of the bulge–disk models without dark matter. The dark halo contributions could be raised and simultaneously the disk contributions lowered further, and would lead to equally good fits to the rotation curves. However, the expected number of spiral arms would then increase according to equation (9) as and would fit no longer to the observed morphologies of the galaxies. Thus, applying the density wave theory constraint to the decomposition of the rotation curves the disks of the three galaxies in the to 1 redshift range we find that the galaxies seem to have maximum disks similar to the nearby galaxies. This does not mean that we argue against the presence of dark matter in the galaxies. The observed rotation curve of FDF 2174, for example, spans already about four radial scale lengths and shows no indications of falling at the outer radii. This would be the case if there were only a single disk. Instead the flat shape of the rotation curve implies according to our model a ratio of = 0.24 at galactocentric radius = 12.5 kpc.
Using the absolute rest frame luminosities of the FDF galaxies derived by Böhm et al. (2004), transformed to the value of adopted here, we have determined the mass–to–light ratios shown in Table 3. The dynamically determined mass–to–light ratios are in good agreement with stellar mass–to–light ratio estimates based on population synthesis models for galaxies in this this redshift range (Dickinson et al. 2003, Drory et al. 2004).
We have demonstrated that there exist galaxies out at redshifts of which are dominated by baryons in their inner parts. Obviously this must reflect on theories of the cosmogony of the galaxies. It would be interesting if the present paradigm of cold dark mater cosmology can account for such galaxies. For instance, the recent state–of–the–art simulation of galaxy formation by Abadi et al. (2003) lead to a galaxy model dominated by dark matter through all phases of its evolution, which is at variance to our findings. Admittedly the selection criterion of visible spiral structure might introduce a bias in the galaxy sample which we have analyzed. Since the galaxies have organized themselves quite early by self gravity, they have probably not experienced a major merger event and could settle into equilibrium.
Acknowledgements.
This work was supported by the DFG Sonderforschungsbereich 439, the Volkswagen Foundation (I/76 520) and the Deutsches Zentrum für Luft- und Raumfahrt (50 OR 0301). We are grateful for the comments by the anonymous referee which clarified the presentation of the paper.References
- (1) Abadi, M.G., Navarro, J.F., Steinmetz, M., Eke, V.C. 2003, ApJ, 591, 499
- (2) Appenzeller, I., Bender, R., Böhm, A. et al., 2000, ESO Msngr, 100, 44
- (3) Athanassoula, E. 1988, in Towards understanding galaxies at large redshifts, eds. R. Kron & A. Renzini, p. 111
- (4) Athanassoula, E., Bosma, A., Papaioaunou, S. 1987, A&A, 179, 23
- (5) de Blok, W.J.G., McGaugh, S.S., Rubin, V., 2001, AJ, 122, 2396
- (6) de Blok, W.J.G., Bosma, A., 2002, A&A, 205, 816
- (7) Böhm, A., Ziegler, B.L., Saglia, R.P., et al. 2004, A&A, 420, 97
- (8) Bosma, A. 2004, in Dark matter in galaxies, IAU Symp. Vol. 220, eds. S. Ryder, D.J. Pisano, M. Walker & K.C. Freeman, in press (astro-ph/0312154)
- (9) Dickinson, M., Papovich, C. Ferguson, H.C., Budavari, T. 2003, ApJ, 587, 25
- (10) Drory, N., Bender, R., Feulner, G., et al. 2004, ApJ, submitted
- (11) Freeman, K.C., 1970, ApJ, 160, 811
- (12) Fuchs, B. 2001, A&A, 368, 107
- (13) Fuchs, B. 2003, in Proceedings of the Fourth International Workshop on the Identification of Dark Matter, eds. N.J.C. Spooner & V. Kudryavtsev, p. 72
- (14) Fuchs, B., Möllenhoff, C., Heidt, J. 1988, A&A, 336, 878
-
(15)
Gentile, G., Salucci, P., Klein U., et al. 2004,
MNRAS, in press
(astro-ph/0403154) - (16) Heidt, J., Appenzeller, I., Gabasch, A., et al. 2003, A&A, 398, 49
- (17) Möllenhoff, C. 2004, A&A, 415, 63
- (18) Navarro, J.F., Frenk, C.S., White, S.D.M. 1997, ApJ, 490, 493
- (19) Sparke, L.S., Sellwood, J.A. 1987, MNRAS, 225, 653
- (20) Toomre, A. 1981, in The Structure and Evolution of Normal Galaxies, eds. S. M. Fall & D. Lynden-Bell, p. 111
- (21) van Albada, T.S., Bahcall, J.N., Begeman, K., Sancisi, R., 1985, ApJ, 295, 305
- (22) van der Kruit, P.C., 1995, in Stellar Populations, IAU Symp. Vol. 164, eds. P. C. van der Kruit & G. Gilmore, p. 205
- (23) Vogt, N.P., Forbes, D.A., Phillips, A.C., et al. 1996, ApJ, 465, L15
- (24) Ziegler, B. L., Böhm, A., Fricke, K. J., et al. 2002, ApJ, 564, L69