11email: gioia@ira.cnr.it 22institutetext: INAF-Osservatorio Astronomico di Brera, Via Brera 28, I-20121 Milano, Italy
22email: anna@brera.mi.astro.it 33institutetext: European Southern Observatory, Karl-Schwarzschild-Str. 2, Garching bei München, D-85740 Germany
33email: cmullis@eso.org 44institutetext: Institute for Astronomy, 2680 Woodlawn Drive, Honolulu, HI 96822, USA
44email: henry@ifa.hawaii.edu 55institutetext: Max-Planck-Institut fur Extraterrestrische Physik, Giessenbachstrasse, Postfach 1312, Garching,
D-85741 Germany
55email: hxb@xray.mpe.mpg.de,ugb@xray.mpe.mpg.de 66institutetext: Visiting Astronomer at the W. M. Keck Observatory, jointly operated by the California Institute of Technology, the University of California and the National Aeronautics and Space Administration. 77institutetext: Visiting Astronomer at the Canada-France-Hawai′i Telescope, operated by the National Research Council of Canada, le Centre National de la Recherche Scientifique de France and the University of Hawai′i.
RXJ 1821.66827: a Cool Cluster at z0.81 from the ROSAT NEP Survey ††thanks: Data presented here used the XMM-Newton facility
We present an analysis of the properties of the cluster of galaxies RXJ 1821.66827, or NEP 5281, at a redshift z0.8160.001. RXJ 1821.66827 was discovered during the optical identification of the X-ray sources in the North Ecliptic Pole (NEP) region of the ROSAT All-Sky Survey and it is the highest redshift cluster of galaxies of the NEP survey. We have measured spectroscopic redshifts for twenty cluster galaxies using the Keck-I and the Canada-France-Hawai′i (CFH) telescopes. The value for the cluster velocity dispersion is km s-1. The cluster was also observed by XMM-Newton. Both the optical and X-ray data are presented in this paper. The cluster has an unabsorbed X-ray flux in the 2–10 keV energy band of erg cm-2 s-1 and a K-corrected luminosity in the same band of h erg s-1 (90% confidence level). The cluster X-ray bolometric luminosity is h erg s-1 ( h erg s-1 in the concordance cosmology). The data do not allow fitting both metal abundance and temperature at the same time. The abundance is unconstrained and can vary in the range 0.28–1.42 Z☉ while the best fit X-ray temperature is T4.7 keV. This emission weighted X-ray temperature is a little lower, barely within the uncertainties, than the predicted temperature, T6.34 keV, from the L relation of local clusters published in the literature. The optically measured velocity dispersion is consistent with the velocity dispersion expected from the relationship. We also examine the point X-ray source RXJ 1821.96818, or NEP 5330, located to the south east of the cluster which was identified as a QSO at z1.6920.008 in the ROSAT NEP survey. The X-ray source is well fitted by an absorbed power law model with N atoms cm-2 and a photon index 0.12 typical of an active galactic nucleus.
Key Words.:
galaxies: clusters – general – individual: RXJ 1821.66827; X-rays: general – individual: RXJ 1821.968181 Introduction
Clusters of galaxies are the most massive, collapsed structures in the Universe. They are the highest peaks in a cosmic terrain driven by gravitational clustering and represent the manifestations of cosmic structure building (Peebles, 1993; Peacock, 1999). The study of the properties of clusters at intermediate and high redshift, both individually and as a population, is important since it allows different cosmological and structure formation models to be tested and constrained. The internal mix of components within clusters, as well as the space density of the most distant and massive clusters and the temperature distribution function of X-ray clusters, can be used to determine fundamental cosmological parameters (Henry & Arnaud, 1991; Oukbir & Blanchard, 1992, 1997; Eke et al., 1998; Borgani et al., 1999, 2001; Henry, 2000, 2004; Vikhlinin et al., 2003). Through the detection of X-ray emission from the hot intracluster gas, X-ray cluster surveys are unbiased in the sense that they exclusively select gravitationally bound objects and are essentially unaffected by projection effects. There are only a few known clusters of galaxies beyond redshift unity, most of them were found in X-ray survey samples (see Rosati et al., 2004). Even if we are far from having very large complete samples of distant () clusters, our capabilities to discover and observe distant objects are rapidly increasing as more accurate and sensitive observing techniques become available.
In recent years we have been involved in the study of the deepest region of the ROSAT All-Sky Survey, at the North Ecliptic Pole (Henry et al., 2001; Voges et al., 2001), to produce a complete and unbiased X-ray-selected sample of clusters of galaxies. The resulting NEP cluster sample has been used to investigate the nature of cluster evolution (Gioia et al., 2001) and to explore the potential implications for large-scale structure models (Mullis et al., 2001). RXJ 1821.66827, or NEP 5281, was detectd in the ROSAT NEP survey as a 4.5 source with only 409 net photons in a vignetting corrected exposure of 5519s. The identification program of the survey (Gioia et al., 2003) revealed the cluster nature of the source. Optical spectroscopic observations with the CFH and Keck-I telescopes placed the cluster at a redshift of z0.8160.001. RXJ 1716.66708 is the most distant cluster of galaxies in the ROSAT NEP survey. Follow-up XMM-Newton observations were also performed, and are reported here together with the optical observations. Note that this is the second z0.81 cluster discovered in the NEP survey. The first one, RXJ 1716.66708 (Gioia et al., 1999), does not appear in the final complete NEP sample because it did not meet the selection criterium for source count rate of signal-to-noise ratio .
Section 2 describes the optical and X-ray data acquisition and analysis. Section 3 details the results obtained and discuss these results. A brief summary is given in Section 4. Throughout this paper, we assume an Einstein-de Sitter model H km s-1 Mpc-1, , and for direct comparison to previous work in this field, but we also repeat the calculations in the current cosmological concordance model ()=(0.7, 0.3, 0.7). At the redshift of the cluster, the luminosity distance is 5.62 h Gpc, the angular size distance is 1.70 h Gpc, and the scale is 8.26 h kpc per arcsec. Throughout the paper quoted uncertainties are 90% confidence levels for one interesting parameter.
2 Observations and Data Analysis
In this section we present the optical spectroscopy for the cluster galaxies performed at the CFHT and Keck-I and the X-ray follow-up observations of RXJ 1821.66827 acquired with XMM-Newton. We first describe the optical spectroscopy, and then present the X-ray data which show that NEP 5281 has a low temperature, lower than expected from its bolometric luminosity, but commensurate with its velocity dispersion. We also present the optical and X-ray data on the point source to the south east of the cluster, namely RXJ 1821.96818, or NEP 5330, which is identified with a QSO at z=1.692.
2.1 CFHT and Keck-I Spectroscopy
RXJ 1821.66827 was observed on July 3, 1997, at the CFHT with the MOS instrument using the STIS2 20482 and the O300 grism in multislit mode. The wavelength coverage was from 4000 to 10000 Å and the pixel size was 4.8 Å pix-1. The slitlet width of 1.5′′ provided a spectral resolution of 17 Å. The data were reduced using the MULTIRED package developed by Le Fevre et al. (1995). Seven galaxies from the CFHT data were identified as cluster members from the CaII break only (one has [OII] in emission). NEP 5281 was also observed at the Keck-I telescope on June 22, 2001, with the Low Resolution and Imaging Spectrograph (LRIS, Oke et al., 1995) in slit-mask mode. With both spectrographs in operation, LRIS_R and LRIS_B, it is possible to obtain multi-object spectra covering the entire optical window in one integration. However we used only data from the red arm given the redshift of the cluster. The 600 l/mm grating blazed at 7850 Å, to target [OII] plus Ca II break and CN at the redshift of the cluster. Combined with our grating angle the wavelength coverage was approximately 6500 Å to 9500 Å, and the pixel size was 1.25 Å. The GG495 filter was used to eliminate the overlapping second order spectrum to avoid any contamination blueward of 9500 Å. Given the fact that galaxies are extended objects, even at this redshift, we used a slit width of 1.4″, which gives a spectral resolution of roughly 6.5 Å. For the selection of the objects to spectroscopically observe, we used deep two color (B and I) images previously taken by us at the University of Hawai′i (UH) 2.2m telescope. The UCSCLRIS package designed by Drew Phillips and collaborators at Lick Observatory was used to prepare the slit-mask files. We designed two masks at different position angles in order to cover the central part of the cluster. Only data from the first slitmask were used since the second slitmask exposure was affected by heavy cirrus and bad weather. Thus we do not have a complete coverage for the galaxies in the central region of the cluster. The first mask was exposed for 10,800s. After the mask exposure, flat fields and arc calibrations exposures were also obtained. The data have been reduced using the standard IRAF package routines for 2-D spectra images. The two-dimensional spectra had to be straightned using the software package WMKOLRIS kindly provided by Greg Wirth at the W. M. Keck Observatory.
Fifteen galaxies out of 26 observed objects were recognized as cluster members on the basis of CaII H and K, CN and, in some cases, the G band absorption features. Only one of the 15 galaxies observed had [OII] in emission. Two of the seven galaxies observed at the CFHT are common to the Keck-I observations. In the end, 15 unique objects observed by Keck plus 5 unique objects observed by CFHT turned out to be cluster member galaxies. These twenty galaxies are listed in Table 1. For each galaxy the (J2000) coordinates, measured velocity, 1 error, and redshift are given. In the last column the main spectral features are also noted.
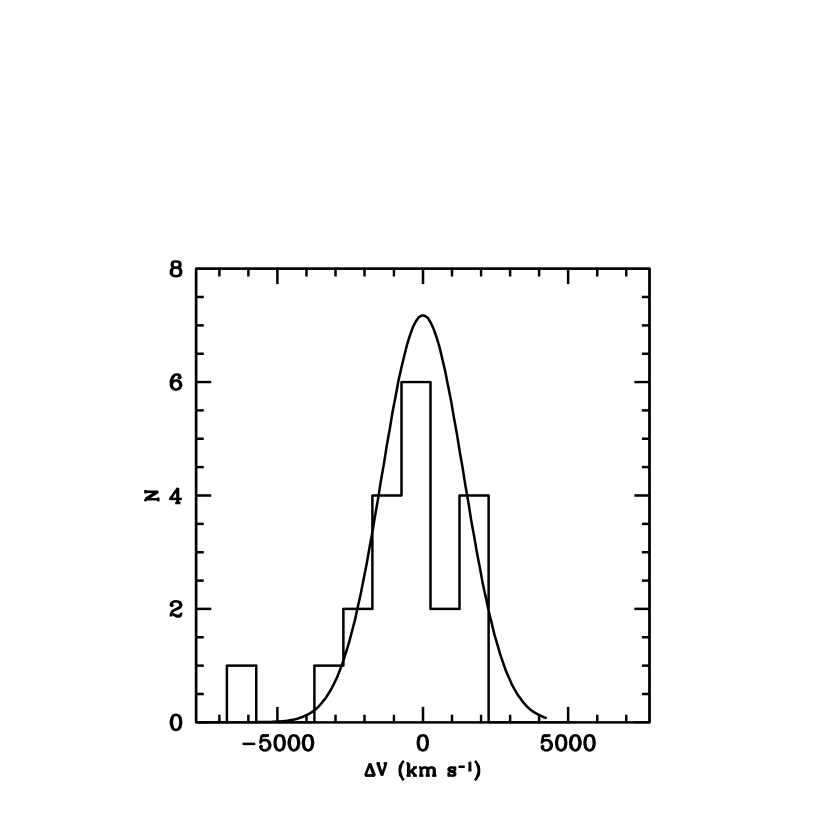
The velocity histogram for the 20 member galaxies is shown in Fig. 1. There is a low-velocity extension in the histogram at 238,500 km s-1 (2 galaxies) that our 3 iterative clipping algorithm (following Danese et al., 1980) excludes from the computation of the cluster velocity. From 18 accepted cluster members, and taking into account the errors on the redshift, we obtain a mean velocity km s-1, an average redshift , and a dispersion along the line of sight km s-1 (corrected to first order for cosmological redshift by dividing by 1z). Without the 3 clipping the mean velocity for the 20 galaxies is km s-1, the average redshift is , and the dispersion along the line of sight is km s-1.
Using the ROSTAT software by Tim Beers and collaborators (Beers et al., 1990) (see also Bird & Beers, 1993) we obtain very similar results to those of the 3 iterative clipping algorithm by Danese et al. (1980). Below the values obtained by the biweight estimator of scale, as suggested by Beers et al. (1990) for this number of galaxies, are given. The errors are the 90% confidence intervals. The average redshift is accounting for errors on z ( with no errors), and a km s-1, corrected to first order for cosmological redshift ( km s-1 corrected to first order cosmological redshift but without taking into account the errors on redshift), which are consistent with either the 20 cluster member and the 18 cluster member velocity dispersions obtained with the previously adopted 3 clipping algorithm.
2.2 XMM-Newton observations
XMM-Newton (Jansen et al., 2001) observed RXJ 1821.66827 as part of the GO program in three epochs, on November 13 and 23, 2002, and on December 19, 2002, for a nominal exposure of 63 Ks with the European Photon Imaging Camera (EPIC) pn (Strüder et al., 2001) and for 73.5 ks with the EPIC MOS CCD arrays (Turner et al., 2001). The pn was operating in extended-full-frame mode with thin filter while the MOS was in the full-frame mode also with the thin filter applied. The pileup is not a problem given the low count rate of the X-ray source.
Unfortunately the observations suffer from periods of
very high background. Event files produced by the standard pipeline
processing have been examined and filtered to remove the high background time
intervals (using the version 5.4.1 of the Science Analysis Software, SAS,
and the latest calibration files released by the EPIC team). Only events
corresponding to pattern 0-12 for MOS and pattern 0-4 for pn have been
used111see the XMM-Newton Users’ Handbook
http://xmm.vilspa.esa.es/external/xmm_user_support/documentation/uhb/XMM_UHB.htm.
Good time intervals were selected by applying
thresholds of 0.35 counts s-1 in the MOS and 1 counts s-1 in the
pn to the photons at energies greater than 10 keV. At these higher energies
counts come mostly from background.
The net exposure times, after data cleaning, are 21.3 Ks and 22.0 Ks for
the MOS 1 and MOS 2, respectively, and 10.6 Ks for the pn. For subsequent
analysis background counts have been accumulated using nearby source-free
circular regions.
The three images, one for each instrument, taken on different epochs were summed using the SAS task merge. Given the position of the source at the center of the field, the different orientations of the instrument with respect to the sky coordinates should not affect the response of the instruments. Thus resulting response matrices and auxiliary files are the average of the three exposures, weighted by the different exposure times.
Response matrices (that include the correction for the effective area) have been generated using the SAS tasks arfgen and rmfgen. The X-ray fluxes reported below are computed using the MOS1 detector and calibration(s). From our data the normalization of the MOS2 is 5% lower than that of the MOS1 whereas the normalization of the pn is 24% lower. This apparently discrepant normalization value has to be attributed to the fact that the cluster falls on the CCD gap of the pn.

2.3 Overall Cluster Properties
Fig. 2 shows the XMM-Newton smoothed contours of RXJ 1821.66827 overlayed onto an optical 1800s I band image taken at the UH 2.2m telescope. Both MOS1 and MOS2 data were used to produce the X-ray contours in the 0.3–8 keV band. The data were smoothed with a Gaussian using cells of 16 pixels corresponding to a resolution of 8″. The X-ray cluster is extended along the NE-SW direction. There are not enough X-ray counts to produce a more meaningful comparison between the optical and X-ray images.
To measure the emission-weighted cluster temperature, net counts were extracted from a circle of radius 100″ centered at which corresponds to the barycenter of the X-ray emission and is very close to the position of galaxy 7 (see Table 1). At the redshift of the cluster such a radius corresponds to a linear size of 826 h kpc. A larger radius including more extended emission counts could not be chosen given the high increment in background counts. There are 70835 net counts in the (0.4–4.0 keV) energy range in the MOS1 detector, 67136 in (0.5–4.3 keV) in the MOS2, and 75140 net counts in (0.5–3.4 keV) in the pn detector. X-ray properties are listed given in Table 2. The data were fitted in XSPEC (version 11.3.0) with a single temperature MEKAL model (Mewe et al., 1985) modified by Galactic absorption, where the ratio between the elements are fixed to the solar values as in Anders & Grevesse (1989)222 These values for the solar metallicity have recently been superseded by the new values of Grevesse & Sauval (1998), who used a 0.676 times lower Fe solar abundance. However, we prefer to report metallicities in the units of Anders & Grevesse abundances since most of the literature still refers to these old values..
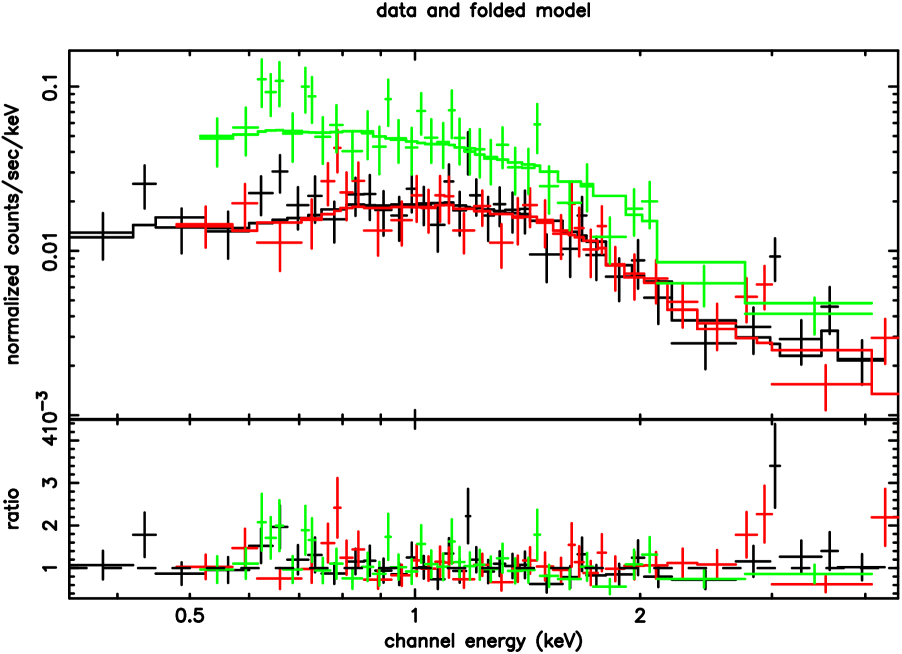
The relative normalization of the three instruments was left free to account for possible intercalibration differences or mismatches. The absorption and redshift were kept constant while the temperature and abundance were left free to vary. The absorption was fixed at the Galactic value of atoms cm-2 (Elvis et al., 1994) and the redshift was fixed at z0.8163. The best fit with a thermal MEKAL model gives a temperature T4.7 keV and a best fit abundance Z0.77 Z☉, which is unconstrained by these data due to a non-detection of the iron K line. The metallicity can vary in the range 0.28–1.42 Z☉. The binned X-ray spectrum and best fit folded model are shown in Fig. 3 where bins were chosen so as to have each resulting energy channel significant at the signal-to-noise ratio of at least 4. The total number of photons in each bin allows the use of the statistics for the fit. The fit has a reduced of 0.90 for 102 degrees of freedom. If one fixes the abundance to Z0.5 Z☉ then the temperature increases a little (T4.9 kev) but it is consistent with the previously determined temperature within the errors. The reduced becomes 0.90 for 103 degrees of freedom.
The unabsorbed flux in the 2–10 keV energy band is erg cm-2 s-1, (see Table 3). While the unabsorbed X-ray flux in 0.5–2.0 keV band is erg cm-2 s-1, to be compared with the flux obtained with the ROSAT PSPC in 0.5–2.0 keV of erg cm-2 s-1. The K-corrected luminosity in the 2–10 keV energy band is h erg s-1 while the bolometric luminosity is h erg s-1. The luminosity in the 0.5–2.0 keV obtained with XMM-Newton is h erg s-1, comparable with the ROSAT PSPC luminosity of h erg s-1. In the concordance cosmology the K-corrected luminosity in the 2–10 keV energy band becomes h erg s-1 and the bolometric luminosity becomes h erg s-1.
As can be seen from Fig. 2 there are point-like sources both to the north-east and the south-west which are included in the 100″ radius even if it is unclear if they belong to the cluster. The data were re-analyzed excluding the point sources from the measure of the cluster X-ray temperature. Freezing as before the Galactic absorption to the neutral hydrogen column density N atoms cm-2, the redshift to z0.8163 and leaving the abundance free to vary, a value of T4.9 keV is determined for the cluster gas once the point sources are excluded. The fit has a reduced of 0.91 for 85 degrees of freedom. This value for the temperature is perfectly consistent with the temperature previously obtained (T4.7 keV) within the uncertainties.
2.4 RXJ 1821.96818, or NEP 5330: the QSO at z1.692 in the XMM-Newton field
There are at least 20 point sources in the XMM-Newton image. We discuss here only one point source, RXJ 1821.96818, which appears in the NEP survey catalog (Gioia et al., 2003) as NEP 5330, and which is not visible in Fig. 2 since it is outside the field of view. The source was identified with an AGN1 (or type 1 AGN, a classification which includes either Seyfert 1 and QSO objects) at redshift z1.6920.008. The object was spectroscopically observed at the UH 2.2m telescope as part of the identification program of the NEP survey sources on June 18, 1998. The telescope was equipped with the Wide Field Grism Spectrograph and the Tek2048 CCD. We used the 420 l mm-1 red grism and a 300 slit (2.4″) which provided at the f/10 focus a pixel scale in spectroscopic mode of 3.6 Å pix-1, a spectral resolution of Å FWHM, and a wavelength coverage of approximately 3900Å–9500Å.
The classification with an AGN1 has been done on the basis of the equivalent width of the emission lines (W30 Å) and on the FWHM (4000 km s-1) of the broad permitted emission lines, indicating a QSO type object (see Gioia et al. 2003 for more details on the optical classification). An optical spectrum is shown in Fig. 4 where the dashed lines indicate the positions of the emission lines at the QSO redshift. Wavelenghts of atmosphric absorption bands are also indicated.
To examine the X-ray source associated to the QSO, a circle of radius 25″ was centered at . There are a total of 60925 net counts in the (0.4–3.8 keV) energy range in the MOS1 detector, 63226 in (0.5–4.6 keV) in the MOS2, and 87430 net counts in (0.5–6.2 keV) in the pn detector (see Table 2). The data were fitted in XSPEC with an absorbed power law model given the nature of the source. The relative normalization of the three instruments was left free. The X-ray flux reported below is computed using the MOS1 detector and calibration. The normalization of the MOS2 is 2% lower than that of the MOS1 whereas the normalization of the pn is 3% lower. The three instrument normalizations are in better agreement than in the analysis of the cluster source implying that the high normalization discrepancy (24%) found previously for the pn with respect to the two MOS detectors is most probably due to the fact that the cluster falls in one of the gap of the pn.
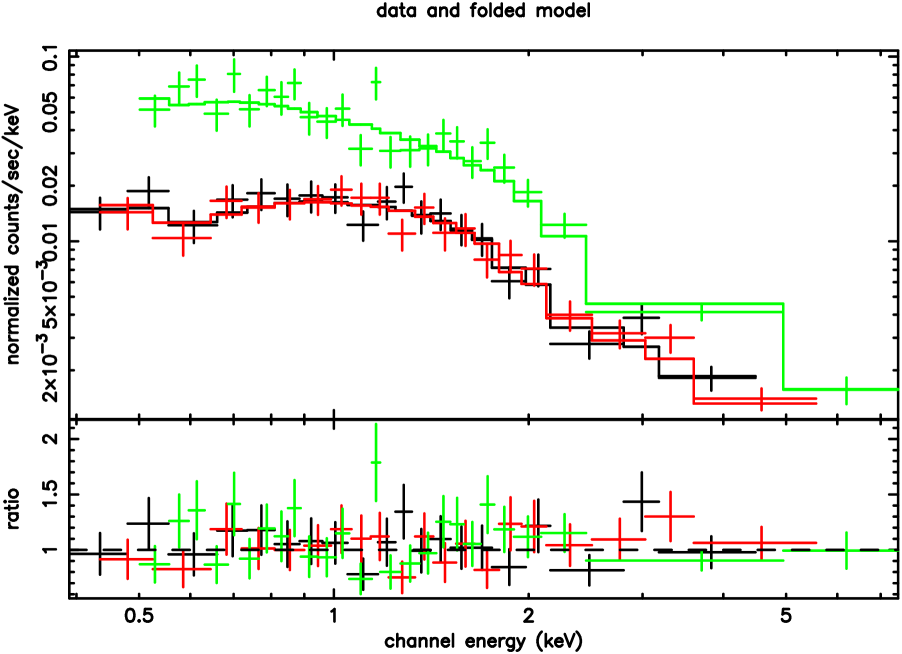
Both the absorption and the photon index () of the power law model were free to vary. The best fit is 1.670.12 and the best fit absorption is N atoms cm-2, consistent with the Galactic value of N atoms cm-2. The binned X-ray spectrum and best fit folded model are shown in Fig. 5 where bins were chosen so as to have each resulting energy channel significant at the signal-to-noise ratio of at least 5. The fit has a reduced of 0.92 for 61 degrees of freedom. The unabsorbed flux of the QSO in the 2–10 keV energy band is erg cm-2 s-1 (see Table 3). The K-corrected luminosity in the 2–10 keV energy band is h erg s-1. In the concordance cosmology the K-corrected luminosity in the 2–10 keV energy band becomes h erg s-1. Note that the luminosity of RXJ 1821.96818 as measured with XMM-Newton in 2002 is approximately 2.5 times higher than that measured with ROSAT in 1990 (see Mullis et al. 2004 for revised fluxes and luminosities for NEP AGN). Such a difference is not surprising given the time variability of AGN.
RXJ 1821.96818 was also observed with the Very Large Array at 1.5 GHz by Kollgaard et al. (1994) who mapped a 29.3 deg2 region surrounding the north ecliptic pole to support the deepest portion of the ROSAT all-sky soft X-ray survey. RXJ 1821.96818 was detected by the the VLA-NEP survey with a flux density of 182 mJy at 1.5 GHz.
3 Discussion and Conclusions
The main result of this paper is the presentation of the optical and X-ray data, namely the spectroscopic data acquired through Keck-I, CFH and UH 2.2m telescopes, and the X-ray temperature obtained with the detectors onboard the XMM-Newton satellite. We will focus the following discussion on the implications of measured quantities such as the emission weighted temperature and velocity dispersion for RXJ 1821.66827. As with other X-ray selected, distant clusters RXJ 1821.66827 does not have a spherically symmetric morphology in X-rays or in optical. Its X-ray morphology is elongated and very similar to other 0.8 clusters like RXJ 1716.66708 (Gioia et al., 1999), another cluster found in the course of the NEP identification program but which did not meet the 4 selection criterium for sources (Gioia et al., 2003), or to the better known Medium Survey cluster MS 10540321 (Gioia et al., 2004). Differently from RXJ 1716.66708 and MS 10540321 that both show high velocity dispersions ( km s-1 and km s-1, respectively: Gioia et al., 1999; van Dokkum et al., 2000), RXJ 1821.66827 has a velocity dispersion of km s-1, rather typical of normal relaxed clusters. We are also dealing with a cool cluster with a temperature (T4.7 keV) a little lower than the temperature of RXJ 1716.66708 (which Chandra measured to be T6.60.8 keV; Vikhlinin et al., 2002) and even lower than the X-ray temperature of MS 10540321 (which XMM-Newton measured to be T7.2 keV; Gioia et al., 2004).
A large number of authors (see Table 5 in Girardi et al. 1996, or Table 2 in Wu et al. 1998 for an exhaustive list of papers on the subject) have attempted to determine the TX using different cluster samples in order to test the dynamical properties of clusters (see among others Girardi et al., 1998; Donahue et al., 1999; Tran et al., 1999; Gioia et al., 1999; Horner et al., 1999; Rosati et al., 2002; Yee & Ellingson, 2003; Lubin et al., 2004). This relationship is physically meaningful since both the velocity dispersion of the galaxies and the temperature of the intracluster medium provide a measure of the overall mass of the system. If we characterize the TX relationship as
(where is the mean molecular weight of the gas, mp is the proton mass and is the Boltzmann’s constant) and if we assume energy equipartition between the galaxies and the gas in the cluster (1), we obtain a velocity dispersion for RXJ 1821.66827 consistent with the measured one. We derive km s-1 from the above TX relation vs the measured value of km s-1.
Girardi et al. (1996) have derived a best fit relation between the velocity dispersion and the X-ray temperature, with more than 30% reduced scatter with respect to other workers (Edge & Stewart, 1991; Lubin & Bahcall, 1993; Bird et al., 1995; Wu et al., 1998). Girardi et al. (1996) have taken into account distortions in the velocity fields, asphericity of the cluster or presence of substructures to derive their best fit relation: log() (2.530.04) (0.610.05) log(T). If we insert the temperature of RXJ 1821.66827 in the above relation, the resulting velocity dispersion value, = 874 km s-1, is consistent, even if on the high side, with the measured velocity dispersion.
The temperature of RXJ 1821.66827 is a little lower than predicted from its X-ray luminosity for local LTX relation. Understanding the evolution of the L relation is important not only to understand the physics behind the formation of galaxy clusters, but also because it provides a link between observations of clusters and derivation of cosmological parameters. There is an extensive literature on the correlation between these two basic and measurable quantities based on ASCA, ROSAT PSPC and more recently Chandra and XMM-Newton data (see among other David et al., 1993; Fabian et al., 1994; Mushotzky & Scharf, 1997; Markevitch, 1998; Sadat et al., 1998; Arnaud & Evrard, 1999; Fairley et al., 2000; Borgani et al., 2001; Novicki et al., 2002; Vikhlinin et al., 2002; Lumb et al., 2004). The L relation has been well studied at low redshift. Characterizing the LX–TX relation as
investigators have found for values ranging from 2.33 to 2.88, all consistent within the errors. There is no consensus yet on the evolution of the L relation with redshift (see among others: Borgani et al., 2001; Novicki et al., 2002; Vikhlinin et al., 2002; Lumb et al., 2004) probably due to the lack of large samples of galaxy clusters at cosmologically significant redshift. Vikhlinin et al. (2002) have detected for the first time an evolutionary trend in the LX–TX relation using Chandra data for distant clusters. More recently Lumb et al. (2004) have also found an evolutionary trend of the relation using XMM-Newton data, albeit using a sample of only 8 clusters in a restricted redshift range (0.450.62). On the other hand Ettori et al. (2004) detect only hints of negative evolution in the LX–TX using a larger sample of 28 clusters observed by Chandra and in a larger redshift range (0.41.3). We assume the parametrization by Arnaud & Evrard (1999) who analyzed a sample of 24 low-z clusters with accurate ASCA temperature measurements and absence of strong cooling flows. Comparing the bolometric luminosity of RXJ 1821.66827 with the Arnaud & Evrard (1999) best fit relation, log(LBOL,X) (2.880.15) log(T/6keV) (45.060.03), one would expect for RXJ 1821.66827 a temperature of 6.34 keV that is a little higher, even within the uncertainties, than the best-fit XMM-Newton temperature, implying that this cluster may fit better in an evolving LTX relation. Given the XMM-Newton results, RXJ 1821.66827 does not show extreme X-ray luminosity or temperature values.
We can also estimate the mass of RXJ 1821.66827 using the X-ray temperature value. With the assumptions that the mean density in the virialized region is 200 times the critical density at the redshift of the cluster and that the cluster is isothermal (Evrard et al., 1996; Donahue et al., 1998), we can use the scaling law method as illustrated in Arnaud & Evrard (1999). From the simulations of Evrard, Metzler & Navarro (1996) for the mass-temperature relation one can estimate the virial mass within a radius by using the equation
From the XMM-Newton temperature the virial mass is approximately M M☉ within Mpc, where the uncertainties on the mass reflect the uncertainties on the temperature.
4 Summary
We have presented observations for the z0.8163 galaxy cluster RXJ 1821.66827 performed with the instruments on board the XMM-Newton satellite, and with the CFHT and Keck-I telescopes. The main result of the paper is to present new optical and X-ray data for the most distant cluster in the NEP survey. Both the temperature and the metal abundance have been left as free parameters in the fitting of the X-ray data with a model. Thus freezing the hydrogen column density to the Galactic value of atoms cm-2 and the redshift to the measured z0.8163, we obtain a best fit temperature with a thermal MEKAL model of T4.7 keV, while the abundance is unconstrained and can vary in the range 0.28–1.42 Z☉. This X-ray temperature is a little lower than predictions from the cluster X-ray bolometric luminosity erg s-1 ( erg s-1 in the concordance cosmology) from the L relation of local clusters published in the literature.
From 18 accepted cluster members we obtain an average redshift and a dispersion along the line of sight km s-1. This measured value is consistent with the velocity dispersion expected from the relationship obtained from different cluster samples. From the M – T relation we estimate a virial mass for RXJ 1821.66827 within the Mpc on the assumptions that the mean density in the virialized region is 200 times the critical density at the redshift of the cluster and that the cluster is isothermal. The estimated virial mass has a value of M M☉ which shows that RXJ 1821.66827 is a massive cluster at high redshift.
The point source to the south, RXJ 1821.96818, identified in the NEP survey as a QSO at z1.6920.008, is well fitted by an absorbed power law with N atoms cm-2 and a photon index 0.12 which is typical for this class of objects.
Acknowledgements.
IMG would like to thank the hospitality of the Institute for Astronomy of the University of Hawai′i where this paper was written. She also notes that this work was done in spite of the continued efforts by the Italian government to dismantle publicly-funded fundamental research. An anonymous referee made several comments which improved the manuscript. Partial financial support for this work came from the Italian Space Agency ASI (Agenzia Spaziale Italiana) through grant ASI I/R/037/00.References
- Anders & Grevesse (1989) Anders, E. & Grevesse, N. 1989, Geochim. Cosmochim. Acta., 53, 197
- Arnaud & Evrard (1999) Arnaud, M. & Evrard, A. E. 1999, MNRAS, 305, 631
- Beers et al. (1990) Beers, T. C., Flynn, K., & Gebhardt, K. 1990, AJ, 100, 32
- Bird & Beers (1993) Bird, C. M. & Beers, T. C. 1993, AJ, 105, 1596
- Bird et al. (1995) Bird, C. M., Mushotzky, R. F., & Metzler, C. A. 1995, ApJ, 453, 40
- Borgani et al. (1999) Borgani, S., Rosati, P., Tozzi, P., & Norman, C. 1999, ApJ, 517, 40
- Borgani et al. (2001) Borgani, S., Rosati, P., Tozzi, P., et al. 2001, ApJ, 561, 13
- Danese et al. (1980) Danese, L., de Zotti, G., & di Tullio, G. 1980, A&A, 82, 322
- David et al. (1993) David, L. P., Slyz, A., Jones, C., et al. 1993, ApJ, 412, 479
- Donahue et al. (1998) Donahue, M., Voit, G. M., Gioia, I., et al. 1998, ApJ, 502, 550
- Donahue et al. (1999) Donahue, M., Voit, G. M., Scharf, C. A., et al. 1999, ApJ, 527, 525
- Edge & Stewart (1991) Edge, A. C. & Stewart, G. C. 1991, MNRAS, 252, 414
- Eke et al. (1998) Eke, V. R., Cole, S., Frenk, C. S., & Patrick Henry, J. 1998, MNRAS, 298, 1145
- Elvis et al. (1994) Elvis, M., Lockman, F. J., & Fassnacht, C. 1994, ApJS, 95, 413
- Ettori et al. (2004) Ettori, S., Tozzi, P., Borgani, S., & Rosati, P. 2004, A&A, 417, 13
- Evrard et al. (1996) Evrard, A. E., Metzler, C. A., & Navarro, J. F. 1996, ApJ, 469, 494
- Fabian et al. (1994) Fabian, A. C., Crawford, C. S., Edge, A. C., & Mushotzky, R. F. 1994, MNRAS, 267, 779
- Fairley et al. (2000) Fairley, B. W., Jones, L. R., Scharf, C., et al. 2000, MNRAS, 315, 669
- Gioia et al. (2004) Gioia, I. M., Braito, V., Branchesi, M., et al. 2004, A&A, 419, 517
- Gioia et al. (2003) Gioia, I. M., Henry, J. P., Mullis, C. R., et al. 2003, ApJS, 149, 29
- Gioia et al. (1999) Gioia, I. M., Henry, J. P., Mullis, C. R., Ebeling, H., & Wolter, A. 1999, AJ, 117, 2608
- Gioia et al. (2001) Gioia, I. M., Henry, J. P., Mullis, C. R., et al. 2001, ApJ, 553, L105
- Girardi et al. (1996) Girardi, M., Fadda, D., Giuricin, G., et al. 1996, ApJ, 457, 61
- Girardi et al. (1998) Girardi, M., Giuricin, G., Mardirossian, F., Mezzetti, M., & Boschin, W. 1998, ApJ, 505, 74
- Grevesse & Sauval (1998) Grevesse, N. & Sauval, A. J. 1998, Space Science Reviews, 85, 161
- Henry (2000) Henry, J. P. 2000, ApJ, 534, 565
- Henry (2004) Henry, J. P. 2004, ArXiv Astrophysics e-prints
- Henry & Arnaud (1991) Henry, J. P. & Arnaud, K. A. 1991, ApJ, 372, 410
- Henry et al. (2001) Henry, J. P., Gioia, I. M., Mullis, C. R., et al. 2001, ApJ, 553, L109
- Horner et al. (1999) Horner, D. J., Mushotzky, R. F., & Scharf, C. A. 1999, ApJ, 520, 78
- Jansen et al. (2001) Jansen, F., Lumb, D., Altieri, B., et al. 2001, A&A, 365, L1
- Kollgaard et al. (1994) Kollgaard, R. I., Brinkmann, W., Chester, M. M., et al. 1994, ApJS, 93, 145
- Le Fevre et al. (1995) Le Fevre, O., Crampton, D., Lilly, S. J., Hammer, F., & Tresse, L. 1995, ApJ, 455, 60
- Lubin & Bahcall (1993) Lubin, L. M. & Bahcall, N. A. 1993, ApJ, 415, L17
- Lubin et al. (2004) Lubin, L. M., Mulchaey, J. S., & Postman, M. 2004, ApJ, 601, L9
- Lumb et al. (2004) Lumb, D. H., Bartlett, J. G., Romer, A. K., et al. 2004, ArXiv Astrophysics e-prints
- Markevitch (1998) Markevitch, M. 1998, ApJ, 504, 27
- Mewe et al. (1985) Mewe, R., Gronenschild, E. H. B. M., & van den Oord, G. H. J. 1985, A&AS, 62, 197
- Mullis et al. (2001) Mullis, C. R., Henry, J. P., Gioia, I. M., et al. 2001, ApJ, 553, L115
- Mullis et al. (2004) Mullis, C. R., Henry, J. P., Gioia, I. M., et al. 2004, ApJ, submitted
- Mushotzky & Scharf (1997) Mushotzky, R. F. & Scharf, C. A. 1997, ApJ, 482, L13
- Novicki et al. (2002) Novicki, M. C., Sornig, M., & Henry, J. P. 2002, AJ, 124, 2413
- Oke et al. (1995) Oke, J. B., Cohen, J. G., Carr, M., et al. 1995, PASP, 107, 375
- Oukbir & Blanchard (1992) Oukbir, J. & Blanchard, A. 1992, A&A, 262, L21
- Oukbir & Blanchard (1997) Oukbir, J. & Blanchard, A. 1997, A&A, 317, 1
- Peacock (1999) Peacock, J. A. 1999, Cosmological physics (Cosmological physics. Publisher: Cambridge, UK: Cambridge University Press, 1999. ISBN: 0521422701)
- Peebles (1993) Peebles, P. J. E. 1993, Principles of physical cosmology (Princeton Series in Physics, Princeton, NJ: Princeton University Press, —c1993)
- Rosati et al. (2002) Rosati, P., Borgani, S., & Norman, C. 2002, ARA&A, 40, 539
- Rosati et al. (2004) Rosati, P., Tozzi, P., Ettori, S., et al. 2004, AJ, 127, 230
- Sadat et al. (1998) Sadat, R., Blanchard, A., & Oukbir, J. 1998, A&A, 329, 21
- Strüder et al. (2001) Strüder, L., Briel, U., Dennerl, K., et al. 2001, A&A, 365, L18
- Tran et al. (1999) Tran, K. H., Kelson, D. D., van Dokkum, P., et al. 1999, ApJ, 522, 39
- Turner et al. (2001) Turner, M. J. L., Abbey, A., Arnaud, M., et al. 2001, A&A, 365, L27
- van Dokkum et al. (2000) van Dokkum, P. G., Franx, M., Fabricant, D., Illingworth, G. D., & Kelson, D. D. 2000, ApJ, 541, 95
- Vikhlinin et al. (2002) Vikhlinin, A., VanSpeybroeck, L., Markevitch, M., Forman, W. R., & Grego, L. 2002, ApJ, 578, L107
- Vikhlinin et al. (2003) Vikhlinin, A., Voevodkin, A., Mullis, C. R., et al. 2003, ApJ, 590, 15
- Voges et al. (2001) Voges, W., Henry, J. P., Briel, U. G., et al. 2001, ApJ, 553, L119
- Wu et al. (1998) Wu, X., Fang, L., & Xu, W. 1998, A&A, 338, 813
- Yee & Ellingson (2003) Yee, H. K. C. & Ellingson, E. 2003, ApJ, 585, 215
| ID | RA (J2000) | DEC (J2000) | cz | cz | z | Spectral features |
|---|---|---|---|---|---|---|
| # | h m s | ∘ ′ ″ | km s-1 | km s-1 | ||
| 1 | 18 21 16.6 | 68 30 25 | 244367 | 120 | 0.8151 | HK, G band, H, CN |
| 2 | 18 21 21.5 | 68 29 57 | 246585 | 240 | 0.8225 | HK, CN |
| 3 | 18 21 26.2 | 68 29 31 | 246016 | 170 | 0.8206 | HK, G band, CN |
| 4 | 18 21 30.8 | 68 29 29 | 245856 | 180 | 0.8204 | HK, G band, CN |
| 5 | 18 21 27.9 | 68 28 43 | 246705 | 480 | 0.8229 | HK, G band, CN |
| 6 | 18 21 33.8 | 68 28 40 | 246885 | 210 | 0.8235 | HK |
| 7 | 18 21 32.6 | 68 27 54 | 244847 | 180 | 0.8167 | HK, G band, cD ? |
| 8 | 18 21 34.9 | 68 27 53 | 242808 | 90 | 0.8099 | HK, CN |
| 9 | 18 21 37.2 | 68 27 51 | 244428 | 389 | 0.8153 | HK, G band, CN |
| 10 | 18 21 33.6 | 68 27 50 | 243317 | 389 | 0.8161 | HK, G band |
| 11 | 18 21 35.2 | 68 27 34 | 243288 | 60 | 0.8115 | HK, CN |
| 12 | 18 21 36.6 | 68 27 21 | 244996 | 120 | 0.8172 | HK |
| 13 | 18 21 37.5 | 68 27 07 | 246765 | 150 | 0.8231 | HK |
| 14 | 18 21 37.9 | 68 27 00 | 244607 | 60 | 0.8159 | HK |
| 15 | 18 21 18.2 | 68 27 00 | 238102 | 840 | 0.7942 | [OII] |
| 16 | 18 21 47.7 | 68 27 06 | 242508 | 30 | 0.8089 | HK |
| 17 | 18 21 51.1 | 68 27 17 | 241639 | 540 | 0.8060 | CaII Break |
| 18 | 18 21 57.7 | 68 27 25 | 243378 | 540 | 0.8118 | CaII Break |
| 19 | 18 21 50.8 | 68 26 09 | 244397 | 840 | 0.8152 | CaII Break, [OII] |
| 20 | 18 21 47.8 | 68 25 18 | 243498 | 90 | 0.8122 | HK |
| RA (J2000) | DEC (J2000) | Instr | R | Net Cts | T | Z (Z☉) | NH | Region |
|---|---|---|---|---|---|---|---|---|
| h m s | ∘ ′ ″ | ″ | keV | at/cm2 | ||||
| 18 21 32.5 | +68 27 45.0 | 4.7 | 0.77 | frozena | cluster | |||
| MOS1 | 100 | 70835 | ||||||
| MOS2 | 100 | 67136 | ||||||
| pn | 100 | 75140 | ||||||
| 18 21 58.3 | +68 18 41.2 | 1.670.12 | 4.1 | QSO | ||||
| MOS1 | 25 | 60925 | ||||||
| MOS2 | 25 | 63226 | ||||||
| pn | 25 | 87430 |
-
a
NH fixed at the Galactic value of atoms cm-2
| RA (J2000) | DEC (J2000) | F2-10keV | z | L2-10keV | LBOL | Region |
|---|---|---|---|---|---|---|
| h m s | ∘ ′ ″ | cgs | h cgsa | h cgs | ||
| h cgsa | h cgs | |||||
| 18 21 32.5 | +68 27 45.0 | 1.24 | 0.8160.001 | 6.32 | 1.35 | cluster |
| 5.48 | 1.17 | |||||
| 18 21 58.3 | +68 18 41.2 | 3.660.39 | 1.6920.008 | 50 | QSO | |
| 53 |
-
a
First line refers to the Einstein-de-Sitter model with H km s-1 Mpc-1, , and , while second line refers to the cosmological concordance model with H km s-1 Mpc-1, ,