The Fall of AGN and the Rise of Star-Forming Galaxies: A Close Look at the Chandra Deep Field X-ray Number Counts
Abstract
We investigate the X-ray number counts in the 1–2 Ms Chandra Deep Fields (CDFs) to determine the contributions of faint X-ray source populations to the extragalactic X-ray background (XRB). X-ray sources were separated into Active Galactic Nuclei (AGN), star-forming galaxies, and Galactic stars based primarily on X-ray-to-optical flux ratios, optical spectral classifications, X-ray spectra, and intrinsic X-ray luminosities. Number-count slopes and normalizations below erg cm-2 s-1 were calculated in each band for all source types assuming a single power-law model. We find that AGN continue to dominate the number counts in the 0.5–2.0 keV and 2–8 keV bands. At flux limits of erg cm-2 s-1 (0.5–2.0 keV) and erg cm-2 s-1 (2–8 keV), the overall AGN source densities are 7166 sources deg-2 and 4558 sources deg-2, respectively; these are factors of –20 higher than found in the deepest optical spectroscopic surveys. While still a minority, the number counts of star-forming galaxies climb steeply such that they eventually achieve source densities of 1727 sources deg-2 (0.5–2.0 keV) and 711 sources deg-2 (2-8 keV) at the CDF flux limits. The number of star-forming galaxies will likely overtake the number of AGN at erg cm-2 s-1 (0.5–2.0 keV) and dominate the overall number counts thereafter. Adopting XRB flux densities of ( erg cm-2 s-1 deg-2 (0.5–2.0 keV) and ( erg cm-2 s-1 deg-2 (2–8 keV), the CDFs resolve a total of 89.5% and 86.9% of the extragalactic 0.5–2.0 keV and 2–8 keV XRBs, respectively. AGN as a whole contribute 83% and 95% to the these resolved XRB fractions, respectively, while star-forming galaxies comprise only 3% and 2%, respectively, and Galactic stars comprise the remainder. Extrapolation of the number-count slopes can easily account for the entire 0.5–2.0 keV and 2–8 keV XRBs to within statistical errors. We additionally examine the X-ray number counts as functions of intrinsic X-ray luminosity and absorption, finding that sources with erg s-1 and cm-2 are the dominant contributors to the 0.5–2.0 keV XRB flux density, while sources with – erg s-1 and a broad range of absorption column densities primarily contribute to the 2–8 keV XRB flux density. This trend suggests that even less intrinsically luminous, more highly obscured AGN may dominate the number counts at higher energies where the XRB intensity peaks. Finally, we revisit the reported differences between the CDF-North and CDF-South number counts, finding that the two fields are consistent with each other except for 2–8 keV detected sources below erg cm-2 s-1, where deviations gradually increase to .
Subject headings:
cosmology: observations — galaxies: active — galaxies: starburst — X-rays: galaxies1. Introduction
Deep Chandra and XMM-Newton observations have now resolved the vast majority of the X-ray background (XRB) below 8 keV e.g., Cowie et al., 2002, hereafter C02; Moretti et al., 2003, hereafter M03; Worsley et al., 2004, with much of the remaining uncertainty in the resolved fraction attributed to deviations in the absolute value of the XRB itself due to large-scale structure (e.g., Gilli et al., 2003; Yang et al., 2003) and significant instrumental cross-calibration uncertainties (e.g., De Luca & Molendi, 2004, and references therein). The number counts in both the 0.5–2.0 keV (soft) and 2–8 keV (hard) bands can be fitted with characteristic double power-law shapes with breaks around – erg cm-2 s-1 (e.g., CO2; M03). Intensive optical follow-up campaigns have shown that extragalactic sources at bright X-ray fluxes (– erg cm-2 s-1) are generally unobscured or mildly obscured active galactic nuclei (AGN; e.g., Bade et al., 1998; Schmidt et al., 1998; Akiyama et al., 2003), while below this level several other populations emerge such as obscured AGN (e.g., Alexander et al., 2001; Tozzi et al., 2001; Barger et al., 2002; Mainieri et al., 2002) and starburst and quiescent galaxies (e.g., Giacconi et al., 2001; Alexander et al., 2002a; Bauer et al., 2002a; Hornschemeier et al., 2003).
This paper builds upon the overall number-count results of C02 and M03, which were both based on the 1 Ms Chandra Deep Field (CDF) datasets, and extends the quiescent galaxy number-count results presented by Hornschemeier et al. (2003) by investigating how various source populations contribute to the XRB using the multi-wavelength datasets of the 2 Ms CDF-North (CDF-N) and 1 Ms CDF-South (CDF-S). In addition to deep X-ray observations, these legacy fields have deep HST, radio, and ground-based optical imaging, as well as several thousand spectroscopic redshifts, allowing classification of different source types. We describe our X-ray sample in 2, while our method for estimating incompleteness and bias is outlined in 3. Finally, we present the selection and classification of sources and number-count results in 4. Throughout this paper, we adopt km s-1 Mpc-1, , and (Spergel et al., 2003). Unless explicitly stated otherwise, quoted errors are for a (68%) confidence level.
2. X-ray Sample
Our sample is derived from the catalogs of Alexander et al. (2003, hereafter A03), which consist of 503 X-ray sources in the 2 Ms CDF-N and 326 X-ray sources in the 1 Ms CDF-S. We have chosen to combine these two samples to achieve a more accurate census of the X-ray source population. We recognize that the number counts of these two fields have been reported to differ by % at faint X-ray fluxes (e.g., C02; M03), and we briefly investigate such differences in 4. The on-axis sensitivity limits for the CDF-N and CDF-S are erg cm-2 s-1 and erg cm-2 s-1 (soft) and erg cm-2 s-1 and erg cm-2 s-1 (hard), respectively. X-ray source fluxes are taken directly from these catalogs and include corrections for vignetting, individual spectral slopes when known (otherwise is assumed), and contamination of the ACIS blocking filters.
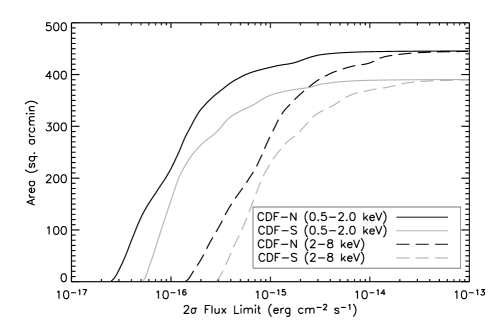
We have additionally corrected the fluxes for the intervening Galactic column densities.111The Galactic column densities toward the CDF-N and CDF-S are cm-2 and cm-2, respectively (Lockman, 2004; Stark et al., 1992). For our number-count estimates in each band, we have imposed a flux cutoff to the above sample based on the 2 limiting flux maps for the CDF-N and CDF-S, which were constructed following the prescription in 4.2 of A03. This significance level empirically matches our limiting sensitivity across the field and is adopted to remove a small number of sources with large and highly uncertain completeness and flux bias corrections (i.e., % completeness; see 3). Figure 1 presents the sensitivity and sky coverage of the CDFs. Twenty soft-band and 10 hard-band sources were rejected because they were below this flux threshold. In total, we used 724 sources detected in the soft band and 520 sources detected in the hard band to estimate the X-ray number counts, with sky coverages ranging from 0.232 deg2 to 0.004 deg2 depending on X-ray flux. Note that the CDF sample presented here consists only of point sources and does not include any obvious contribution from X-ray clusters or groups (e.g., Bauer et al., 2002b). Thus our total X-ray number counts and resolved XRB fraction estimates will likely underestimate the real quantities by a few percent (for estimates of this small contribution see, e.g., Rosati et al., 2002).
3. Chandra Simulations


To understand the effects of incompleteness and bias, we created 200 Monte Carlo simulated observations in both the soft and hard energy bands for each of the CDFs. We began by creating template background images for each field in the soft and hard bands following 4.2 of A03. To this end, we masked out all 829 known point-sources using circular apertures with radii twice those of the 90% point spread function (PSF) encircled-energy radii. We filled in the masked regions for each source with a local background estimated by making a Poisson probability distribution of counts using an annulus with inner and outer radii of 2 and 4 times the 90% PSF encircled-energy radius, respectively (for further details see A03). The resultant images include minimal contributions from detected point sources while still providing realistic contributions from extended sources (e.g., Bauer et al., 2002b), which will cause a slight overestimation of the measured background close to extended sources.
To these template background images we added simulated sources at random positions. The fluxes of these simulated sources were drawn randomly from the total number-count models of M03 between – erg cm-2 s-1 (soft) and – erg cm-2 s-1 (hard), respectively. These fluxes were converted to X-ray count rates assuming a power law and the maximum effective area of the CDFs. Assuming a somewhat different average X-ray spectral slope (–2) does not dramatically change our results. We have not attempted to account for any scatter in the distribution of and note that individual sources with significantly steeper or flatter spectral slopes are likely to have much higher flux thresholds for detection due to the energy dependence of Chandra’s effective area. The number of CDF sources with deviant X-ray spectral slopes is small, and therefore are unlikely to have a large effect.
Exposure times for the simulated sources were derived from their positions on the CDF exposure maps (see 3.1 of A03) and used to convert count rates to counts. To include the effects of Eddington bias (i.e., the measured flux is higher than the actual flux due to statistical fluctuations), the counts for a simulated source were then redrawn from a statistical error distribution. Note that we kept track of the counts both before and after including Eddington bias in order to decouple the effects of our photometry from those of Eddington bias (see Fig. 3). Finally, counts for each source were drawn randomly from a PSF probability distribution function to simulate a real source and then added to the template image. To mimic the complex PSF of the multi-observation CDFs, we adopted the combined model PSF from the nearest real X-ray source in the CDFs. These model PSFs were produced using the IDL-based source extraction tool ACIS_EXTRACT (for details see Broos et al., 2004), whereby the PSF for each individual Chandra observation was calculated with the CIAO tool MKPSF using the CALDB PSF libraries, weighted by the number of counts in each exposure, and co-added. The nearest real source was always from the simulated source position.


Source searching and photometry of the simulated images were performed in a manner identical to that used to produce the CDF catalogs [i.e., using WAVDETECT (Freeman et al., 2002) and custom software; see 3.2 and 3.4 of A03 for details]. A completeness correction was determined by comparing the number of simulated input sources to the number of simulated detected sources as a function of detected counts. Likewise, a flux recovery correction was estimated by comparing the simulated input counts (both prior to and after including Eddington bias) to our measured aperture-corrected counts. Since both completeness and flux recovery vary across the CDF fields due to Chandra’s changing PSF and spatially dependent vignetting, we determined the completeness and flux recovery functions within a 2 radius region around each real source, averaged over the 200 simulations. The radius value of 2 was chosen as a compromise between the maximum area over which the PSF remains relatively constant and the minimum area needed to achieve reasonable statistics with our 200 simulations. The above correction functions were used to correct the measured source densities and fluxes, respectively. The completeness and flux recovery functions remain close to unity above –100 counts. Below this point, Chandra’s varying PSF size and spatially dependent vignetting begin to affect source detection and photometry. Figure 2 demonstrates how the completeness and flux recovery functions behave for three separate positions in the CDF-N field in both the soft and hard bands; similar functions were obtained for the CDF-S. Incompleteness is due to three factors: a few percent decrease for moderately bright sources due to occasional source overlap; a large decrease for faint sources near the detection threshold; and a few percent increase for very faint sources due to source overlap or sources that lie in regions of particularly low background. The completeness curves shift as one moves off-axis because of the radially degrading sensitivity limit of the CDFs. Likewise, deviations in the recovered flux correction are due to three factors: a few percent increase at all fluxes due to an additional aperture correction not originally accounted for in A03; a steady increase for faint sources due to photometry errors as detailed in Figure 3; and a steady decrease for faint sources due to Eddington bias. Eddington bias only appears to win out over photometry effects for soft-band sources near the centers of the fields.
4. Number Counts
The cumulative flux distribution (-) at each flux , for all sources brighter than weighted by the corresponding sky coverage, is
| (1) |
where the sky coverage is the maximum solid angle over which each source could have been detected in both CDFs based on the 2 limiting flux maps, and is the completeness correction interpolated from the position- and count-dependent simulated completeness correction (see 3). Additionally, each flux has been corrected for flux bias assuming
| (2) |
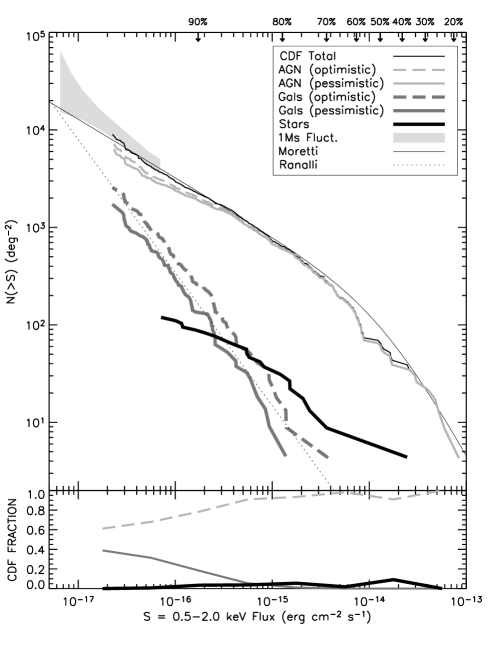
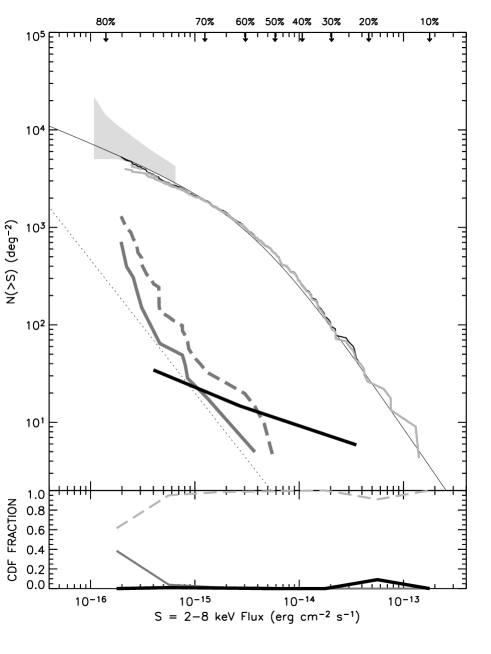
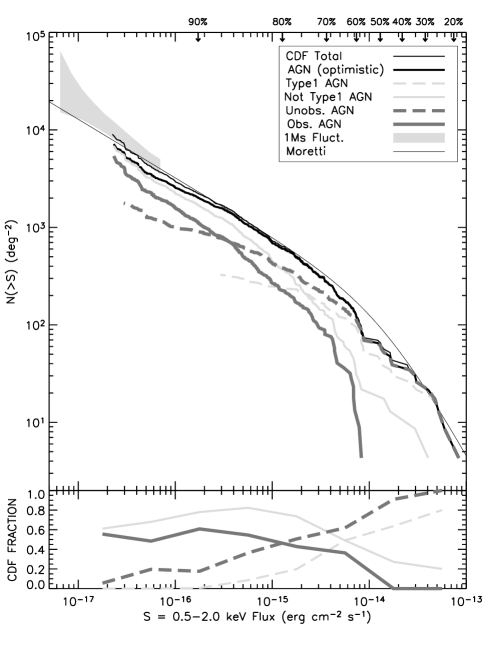
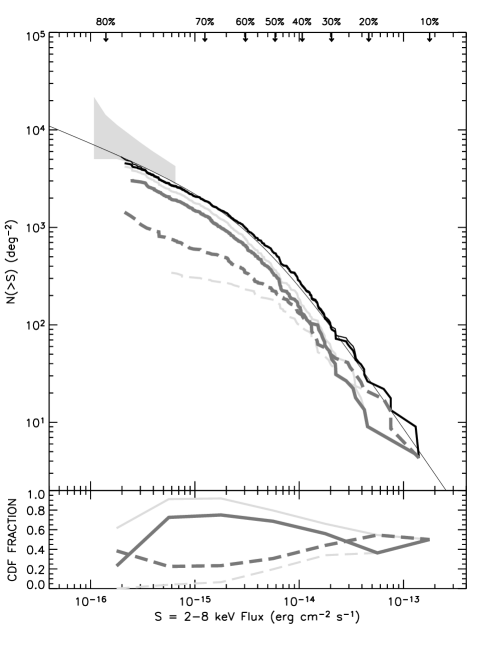
where is the position- and count-dependent simulated flux recovery function (see 3) and is the original flux. Figure 4 shows the total - in the soft and hard bands for the combined sample. The combined - curves are consistent with the distributions and models found by other authors (e.g., C02; M03) within the uncertainties. The CDFs appear to underestimate the soft-band number counts around erg cm-2 s-1 compared to the model curve of M03, although this is only a deviation. Figure 5 compares the number counts in the CDF-N and CDF-S. We have worked out error bars on the cumulative distributions following Gehrels (1986) and calculated the deviation in quadrature at each data point in units of sigma. We find that the number counts from the two fields are consistent with each other at better than the confidence level over the entire soft band and above erg cm-2 s-1 in the hard band. Below this hard-band flux, statistical deviations gradually increase to at the faintest flux levels, a finding similar to that presented in C02. This demonstrates that the field-to-field variations previously reported for the CDFs are entirely consistent with the lack of field-to-field variations found from ChaMP (Kim et al., 2004), as the latter study only examined the X-ray - for relatively bright sources where we find the CDFs are compatible.

The total number counts in both bands have previously been best fitted with broken power laws with break fluxes between – erg cm-2 s-1 (e.g., C02; M03). Given this break range and the limited statistics of the CDFs above erg cm-2 s-1, we estimate the slope only for the faint end of the number counts below erg cm-2 s-1. We have assumed a single power-law model of the form , where the slopes and normalizations were determined with a maximum-likelihood algorithm (e.g., Murdoch et al., 1973) using the sky-coverage corrected (i.e., ), differential flux distribution. The best values of were estimated by minimizing
| (3) |
where is the number of sources used. The best values of for a particular were estimated by
| (4) |
The best-fit slopes and accompanying normalizations are provided in Table 1. We typically do not have sufficient statistics to ascertain whether a single power law appropriately represents the underlying flux distribution; however, visual inspection of Figure 4 and the analyses below suggest that such a simple model is unlikely to represent adequately sources near or below our detection threshold due to the varied nature of the contributing source populations.
| (1) | (2) | (3) | (4) | (5) | |||
|---|---|---|---|---|---|---|---|
| Class | Subclass | # | Slope () | ||||
| S | H | S | H | S | H | ||
| All | Total | 724 | 520 | ||||
| AGN | Total (opt.) | 599 | 484 | ||||
| Total (pess.) | 545 | 466 | |||||
| Optical Type 1 | 73 | 65 | — | — | |||
| Optical “Not Type 1” | 526 | 419 | |||||
| X-ray Unabs. | 230 | 142 | |||||
| X-ray Abs. | 368 | 342 | |||||
| Galaxies | Total (opt.) | 157 | 30 | ||||
| Total (pess.) | 103 | 12 | |||||
| Starbursts (pess.) | 55 | 5 | — | — | |||
| Quiescent Gal. | 35 | 5 | — | — | |||
| Ellipticals (pess.) | 13 | 2 | — | — | |||
| Stars | Total | 22 | 3 | — | — | ||
| 23 | 24 | — | — | — | — | ||
| 43.5–44.5 | 165 | 169 | |||||
| 42.5–43.5 | 276 | 229 | |||||
| 41.5–42.5 | 115 | 57 | |||||
| 40.5–41.5 | 17 | 4 | — | — | |||
| 23–24 | 100 | 142 | |||||
| 22–23 | 250 | 180 | |||||
| 21–22 | 145 | 103 | |||||
| ¡21 | 724 | 55 | |||||
Note. — The two entries in columns 3–5 denote the soft (S) and hard (H) band results. Column 1: Source classification (see 4.1.1). Column 2: Source subsample (see 4.1.2 and 4.1.4). Column 3: Number of sources in class in the soft and hard samples, respectively. Columns 4 and 5: Number-count slopes () and normalizations (, sources deg-2 at erg cm-2 s-1) as estimated using the maximum likelihood method (e.g., Murdoch et al., 1973) on the soft and hard samples, respectively. Fitting was performed using only the sources with fluxes below erg cm-2 s-1 (i.e., below the known break in the X-ray number counts) for all classes except that of “Stars”. For some cases, there were too few sources or too much scatter below erg cm-2 s-1 to provide reliable number-count parameters. Such cases are denoted by “—”.
Our best-fit slopes to the total faint-end number counts are (soft) and (hard). These values are slightly lower than previous estimates in both the soft e.g., 0.70 from Mushotzky et al., 2000, 0.67 from Brandt et al., 2001b, 0.60 from Rosati et al., 2002, and 0.60 from M03 and hard e.g., 0.61 from Rosati et al., 2002, from C02, and 0.44 from M03 bands, although they are consistent within measurement errors. Our lower values may be due to a number of the factors: (1) we are using data which probe a factor of deeper (i.e., the 2 Ms CDF-N) where the number counts may become flatter, (2) we estimate the faint-end slope only using sources below erg cm-2 s-1 (i.e., a factor of several lower than the break flux adopted by other studies), and (3) we use a somewhat different technique to calculate the incompleteness and Eddington bias corrections. The best-fitted number-count models from M03 are also shown in Figure 4 and display excellent agreement apart from a slight soft-band deficit in the CDF number counts around erg cm-2 s-1 (presumably due to the effects of large-scale structure). At the CDF flux limits, we find total source densities of 9014 and 5303 sources deg-2 in the soft and hard bands, respectively (see Table 2).
| (1) | (2) | (3) | (4) | (5) | |||
|---|---|---|---|---|---|---|---|
| Class | Subclass | Total # deg-2 | CDF XRB % | TOTAL XRB % | |||
| S | H | S | H | S | H | ||
| All | Total | 9014 | 5303 | 70.3 | 75.4 | 89.5 | 86.9 |
| AGN | Total (opt.) | 7166 | 4558 | 66.0 | 73.0 | 74.6 | 83.2 |
| Total (pess.) | 6342 | 3970 | 64.6 | 71.5 | 73.2 | 81.8 | |
| Optical Type 1 | 325 | 350 | 33.8 | 20.6 | 41.5 | 28.5 | |
| Optical “Not Type 1” | 6840 | 4207 | 32.2 | 52.4 | 33.1 | 54.7 | |
| X-ray Unabs. | 1774 | 1430 | 47.8 | 29.8 | 55.5 | 37.7 | |
| X-ray Abs. | 5392 | 3127 | 18.1 | 43.2 | 19.1 | 45.5 | |
| Galaxies | Total (opt.) | 2552 | 1298 | 3.2 | 2.6 | 4.1 | 2.8 () |
| Total (pess.) | 1727 | 711 | 1.8 | 1.2 | 2.7 () | 1.4 () | |
| Starbursts (pess.) | 984 | 123 | 0.9 | 0.4 | — | — | |
| Quiescent Gal. | 343 | 481 | 0.6 | 0.7 | — | — | |
| Ellipticals (pess.) | 399 | 105 | 0.2 | 0.1 | — | — | |
| Stars | Total | 119 | 34 | 2.5 | 1.3 | 10.2 | 1.4 () |
| 109 | 113 | 13.0 | 12.7 | — | — | ||
| 43.5–44.5 | 868 | 1050 | 33.7 | 33.9 | — | — | |
| 42.5–43.5 | 2716 | 2157 | 15.9 | 22.1 | — | — | |
| 41.5–42.5 | 3055 | 1168 | 3.1 | 4.2 | — | — | |
| 40.5–41.5 | 411 | 58 | 2.6 | 1.7 | — | — | |
| 23–24 | 1754 | 1174 | 3.0 | 17.2 | — | — | |
| 22–23 | 3452 | 1668 | 14.3 | 23.9 | — | — | |
| 21–22 | 862 | 1199 | 18.4 | 14.8 | — | — | |
| 1098 | 435 | 30.2 | 16.7 | — | — | ||
Note. — The two entries in columns 3–6 denote the soft (S) and hard (H) band results. Column 1: Source classification (see 4.1.1). Column 2: Source subsample (see 4.1.2 and 4.1.4). Column 3: Source number density in the soft and hard samples, respectively. Column 4: Percentage of the XRB flux density which each source class contributes (considering detected CDF sources only). Column 5: Percentage of the XRB flux density which each source class contributes (considering CDF sources and sources brighter than those in the CDFs, which we estimate to comprise a total of 19.2% in the soft band and 11.5% in the hard band; see 4). For some classes, the percentage of the XRB for brighter sources is not well known and has been omitted (denoted by “—”).
4.1. Number Counts by Type
A large fraction of the X-ray-bright CDF sources can be securely identified as AGN based on their X-ray luminosities, X-ray spectral properties, radio properties, optical spectroscopic classifications, and X-ray-to-optical flux ratios (e.g. Alexander et al., 2002a; Bauer et al., 2002a). However, the classifications of many faint X-ray sources remain ambiguous because they lack firm redshifts, and their X-ray properties are consistent with emission from either a low-luminosity active nucleus, star formation, or a combination of both. To understand these sources, we must make a few reasonable assumptions about the nature of the CDF sources as outlined below. Following these assumptions, we adopt two classification schemes, one which conservatively estimates the number AGN and one which conservatively estimates the number of star-forming X-ray sources.
Optical magnitudes for the CDF sources have been measured using Subaru observations in the CDF-N (Barger et al., 2003) and Wide-Field Imager (WFI) observations as part of an ESO deep public survey in the CDF-S (e.g., Arnouts et al., 2001). Fifty-two of the CDF sources have no optical counterpart to the depths of the Subaru and WFI images (). We have assigned -band magnitudes to these blank X-ray sources assuming they represent the tail of the currently observed -band counterparts. This assumption is validated by deeper HST imaging for a large subset of the CDF sources (e.g., Bauer et al. 2004, in preparation; Koekemoer et al., 2004), although we caution that a small fraction of sources could be much fainter than our estimates. Redshifts for the X-ray sources were culled from several recent spectroscopic (Barger et al., 2003; Steidel et al., 2003; Le Fevre et al., 2004; Szokoly et al., 2004; Wirth et al., 2004) and photometric (Alexander et al., 2001; Barger et al., 2003; Wolf et al., 2004) catalogs. Of the 829 CDF sources, 425 have spectroscopic redshifts and another 80 have firm photometric redshifts. The remaining 324 sources that lack redshifts are nearly all optically faint () and have proven difficult to identify in large numbers even on 8–10m class telescopes. In order to classify all sources, we first must estimate the redshifts for these remaining sources (thereby allowing X-ray luminosity and rest-frame absorption column determinations). We note that detailed studies of optically faint X-ray sources indicate that they often have hard X-ray colors typical of obscured AGN and red optical colors typical of early-type galaxies at –3 (e.g., Alexander et al., 2001; Koekemoer et al., 2004; Treister et al., 2004).
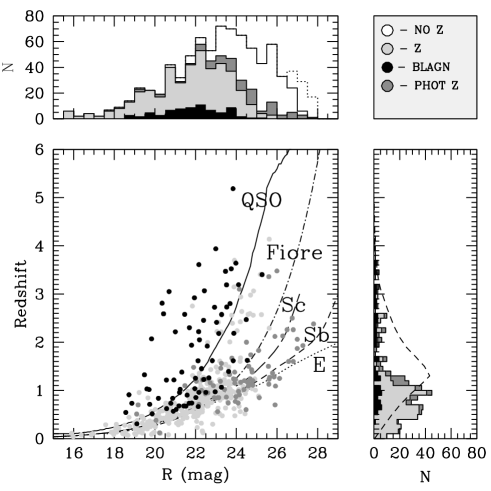
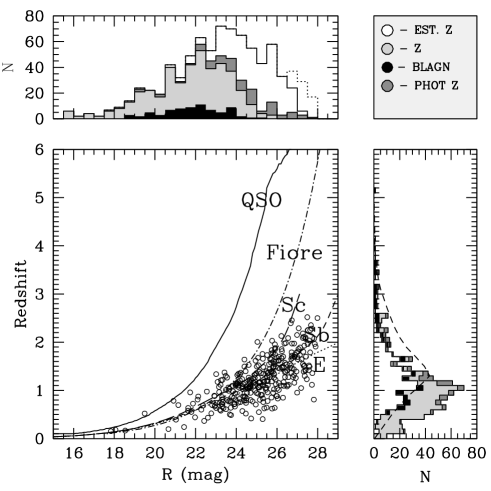
In Figure 6, we show the distribution of redshift versus -band magnitude for the CDF sources with known redshifts, as well as templates for an QSO and unevolved Sc, Sb, and E galaxies. -corrected galaxy tracks were derived from the study of Poggianti (1997). Since no evolutionary corrections have been made, these tracks should be considered extreme in the sense that a typical elliptical should have bluer colors than those shown here. The -corrected QSO track was calculated using a custom composite QSO spectrum (consistent with that of Vanden Berk et al., 2001, where they overlap) assuming the QSO continuum has (where ), typical emission-line strengths, and standard absorption due to the Lyman alpha forest.
While the broad-line AGN span a wide range in and are generally consistent with the QSO track, the overwhelming majority of the other CDF sources follow the galaxy tracks, indicating that their optical light is likely to be dominated by their host galaxies see Grogin et al., 2003 for confirmation of this dominance of the optical host galaxies from HST imaging. We note that the correlation found by Fiore et al. (2003) between intrinsic and can essentially be reduced to one between optical magnitude and redshift (such as is seen in Figure 6) as long as we include a correction for X-ray absorption, which these authors suggest is typically 15% for 90% of their sources and rarely excedes factors of a few. In this new form, the Fiore et al. (2003) correlation tracks bright optical sources as well as the galaxy templates, but appears to overestimate redshifts for sources with by increasingly large factors. Thus caution should be exercised when extrapolating this correlation to extremely faint optical magnitudes (cf. Padovani et al., 2004).
The fainter sources that lack redshifts are likely to continue to follow the galaxy tracks in Figure 6, and thus in the absence of reliable photometric redshifts we can use this good correspondence as a crude redshift indicator to glean basic trends. Differences between the galaxy templates do not appear large below . However, the Sb template formally provides the best empirical fit to the available data (see also, e.g., Alexander et al., 2002b; Barger et al., 2002, 2003) and was therefore adopted as our median spectral energy distribution (SED) to convert -band magnitude to redshift. We assumed a scatter about this template equal to that measured between =23–24 for the known redshift distribution. We caution that this technique is only valid in a statistical sense and is only strictly true if (1) fainter X-ray sources remain host-galaxy dominated at optical wavelengths and (2) their typical hosts are well-represented by an Sb galaxy SED. Reassuringly, the small number of optically faint sources with redshift determinations follow this template.
We must also calculate rest-frame X-ray absorption column densities for all CDF sources in order to determine the intrinsic power of the AGN. These were determined from direct X-ray spectral analysis (Bauer et al. 2004, in preparation), which is more accurate than using simple band ratios. An absorbed power-law model (; Morrison & McCammon, 1983) was fitted to all CDF sources. The absorption and normalization were varied as free parameters. The photon index of the power law was allowed to vary such that for sources with more than 100 counts in the 0.5–8.0 keV band, while it was fixed at for sources below 100 counts. The fitting was performed on the unbinned X-ray data using the Cash statistic (Cash, 1979) to maximize spectral information for low-count sources. The spectral parameters of the CDF sources were then used to calculate unabsorbed, rest-frame 0.5–8.0 keV luminosities.
4.1.1 Source Classification
Our first source classification scheme is based on intrinsic 0.5–8.0 keV luminosities, X-ray spectral properties, radio properties (slopes, morphologies, and variability), and optical spectroscopic classifications. Our specific AGN criteria are motivated by the following findings. From X-ray observations in the local Universe, purely star-forming galaxies do not appear to have X-ray luminosities exceeding erg s-1, and rarely, if ever, have intrinsic absorption column densities above cm-2 (e.g., Fabbiano, 1989; Colbert et al., 2004). The above numbers are probably conservative, considering the most X-ray-luminous local star-forming galaxy known, NGC 3256, only has an X-ray luminosity of (Moran et al., 1999; Lira et al., 2002) and that X-ray emission from star-forming galaxies is typically extended; obscuring X-ray emission with an average absorption column density of cm-2 would require extraordinary amounts of intervening gas. Finally, nearby extragalactic X-ray sources with extremely flat X-ray spectral slopes () are almost always identified as highly obscured or Compton-thick AGN, where the primary emission from the AGN is almost completely obscured and we only see the flat scattered or reflected component (e.g., Maiolino et al., 1998; Bassani et al., 1999). At radio wavelengths, the vast majority of sources with powerful radio jets/lobes, flat radio spectral slopes, or strong radio variability are AGN (e.g., Condon, 1984, 1986), while extragalactic sources with broad (EW1000 km s-1) or high-excitation optical emission lines are almost universally classified as AGN (e.g., Osterbrock, 1989).
Based on the above constraints, the CDF sources were divided into AGN, galaxies, and stars. Twenty-two sources were classified as Galactic stars based on their spectroscopic identifications. Six hundred thirty-two sources were classified as AGN based on at least one of the following properties: cm-2, hardness ratio (equivalent to effective ), erg s-1, or broad/high-ionization AGN emission lines. We recognize that there will be AGN-dominated sources not selected by these criteria, such as AGN with and rest-frame luminosities erg s-1; however, such AGN are difficult to classify even locally. Seventy-six sources were classified as star-forming galaxies based on either having off-nuclear X-ray emission or cm-2, hardness ratio , and erg s-1. The classifications of a remaining 99 CDF sources were considered ambiguous due to weak X-ray spectral constraints; we have tentatively classified these sources as star-forming galaxies, although there is likely to be some degree of obscured and low-luminosity AGN contamination. Note that the numbers provided above are based on the classification of all 829 CDF sources, and should not be confused with the numbers given in Table 1 which indicate the number of each source type used in the soft-band and hard-band number-count estimates, respectively.
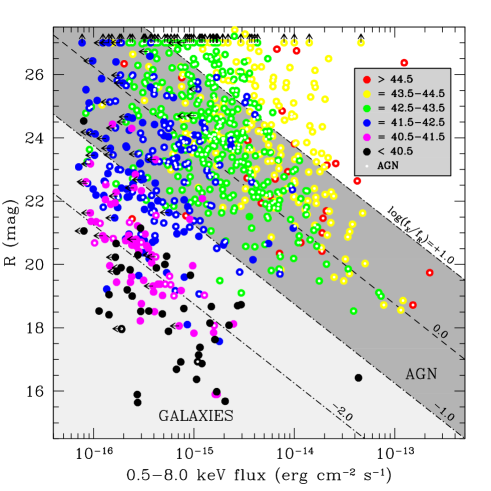
Figure 7 compares -band magnitudes and 0.5–8.0 keV fluxes for all 829 CDF sources, separated into several unabsorbed, rest-frame 0.5–8.0 keV luminosity classes. Those sources classified as AGN under our first scheme are highlighted. From inspection, it is apparent that the X-ray-to-optical flux ratio crudely tracks X-ray luminosity (and hence AGN activity), explaining why is a useful AGN/galaxy discriminator (e.g., Maccacaro et al., 1988; Stocke et al., 1991; Schmidt et al., 1998; Akiyama et al., 2000; Hornschemeier et al., 2000). At very faint X-ray flux levels, however, the relation will begin to break down for certain source types due to the very different nature of their X-ray and optical K-corrections (most notable in this regard are Type 2 Seyfert galaxies, whose X-ray-to-optical flux ratios can vary by more than an order of magnitude between –2; Moran et al., in preparation). There is also likely to be some degree of obscured and low-luminosity AGN contamination at , as well as considerable potential galaxy contamination for and erg cm-2 s-1. We attribute the fact that star-forming galaxies begin to have at faint X-ray fluxes to (1) a stronger K-correction in the optical band than in the X-ray band that tends to shift potential star-forming galaxies into the AGN region and (2) increasingly large uncertainties in the source band ratios (the primary AGN discriminator for low-luminosity X-ray sources) at faint fluxes.
We can estimate the prevalence of obscured AGN among these ambiguous faint X-ray sources by stacking them in suitable subsets and examining their average X-ray band ratios. Given the good correspondence between X-ray-to-optical flux ratio and AGN activity, we stacked all of the ambiguously classified X-ray sources with unconstrained band ratios and erg cm-2 s-1 in decades of decreasing X-ray-to-optical flux ratio. This yielded average effective ’s of 1.35, 1.45, 1.77, and 2.01 (associated errors are 10–20%) for –10, 0.1–1, 0.01–0.1, and , respectively. The steep effective photon indices for sources stacked in the “galaxies” region of Figure 7 suggest that there are relatively few obscured AGN among these sources and that they are likely star-forming in nature (although we cannot exclude the presence of soft low-luminosity AGN or AGN/starburst composites). The flatter effective photon indices for sources in the traditional AGN region, on the other hand, suggest that a significant fraction are in fact obscured AGN, with the rest presumably a mix of unobscured AGN and star-forming galaxies. Thus, our first classification scheme appears to provide a pessimistic estimate of AGN and an optimistic estimate of star-forming galaxies (since some of the ambiguous sources classified as star-forming galaxies may in fact be powered by AGN).
Our second classification scheme is a slight variation of the first and is similar to that presented in Alexander et al. (2002a) and Bauer et al. (2002a). In addition to the X-ray spectral properties, intrinsic X-ray luminosities, radio morphologies, variability, and optical spectroscopic classifications, we further classify ambiguous sources based on their X-ray-to-optical flux ratios. Thus we considered 698 sources to be AGN based on at least one of the following properties: , cm-2, hardness ratio (equivalent to effective ), erg s-1, or broad/high-ionization AGN emission lines. The remaining 109 sources were considered star-forming galaxies, although again some low-luminosity AGN might be present. In contrast to our first scheme, this division should provide a more optimistic estimate of AGN and a more pessimistic estimate of star-forming galaxies, as it attempts to address the issue of strong AGN contamination for unclassified sources.
Number counts for the two classification schemes are compared in Figure 4, and our best-fit slopes to the total faint-end number counts are provided in Table 1 for each category. Importantly, the slopes of the AGN and galaxy number counts are not strongly affected by the adopted scheme. The true number counts for each class are likely to lie somewhere in between these two determinations. Given that the stacked effective photon indices of the ambiguous sources in the AGN region are relatively hard, and that there is likely to be some soft AGN contamination in the “galaxies” region, we will adopt the second scheme presented above (optimistic AGN, pessimistic galaxies).
We can compare our pessimistic galaxy sample to the Bayesian selected sample of normal/starburst galaxies in the CDFs from Norman et al. (2004). Using only CDF sources with spectroscopic redshifts and a selection based on X-ray luminosities, observed X-ray hardness ratios, and X-ray-to-optical flux ratios, Norman et al. (2004) identified a total of 210 normal/starburst galaxies. This number is substantially larger than the 109 galaxies in our pessimistic galaxy sample or even the 175 galaxies in our optimistic sample and warrants investigation. Part of this discrepancy arises from the fact that Norman et al. (2004) use the catalog of Giacconi et al. (2002) rather than that of A03; there are 18 Giacconi et al. (2002) sources in their sample which are not in the main catalogs of A03. Of the remaining 192 Norman et al. (2004) galaxies, we find 120 and 94 matches to our optimistic and pessimistic samples, respectively. Of the 55 sources classified as galaxies here but not by Norman et al. (2004), % were objects lacking spectroscopic redshifts or with (15 cases) while it is unclear why the rest failed their criteria (40 cases). Conversely, sources classified as galaxies by Norman et al. (2004) but AGN here were objects which had a combination of (62 cases), cm-2 (44 cases), hardness ratio (23 cases), or erg s-1 (20 cases). Based on our criteria, we expect significant AGN contamination to be present in the Norman et al. (2004) sample.
We note that the upward trend seen below erg cm-2 s-1 in the AGN number counts in Figure 4 and elsewhere is likely caused by obscured AGN which have composite X-ray spectra, such that a significant fraction of the soft-band flux is likely due to either star formation associated with the host galaxy or complex AGN spectra (e.g., partial covering, scattered radiation, or reflection).
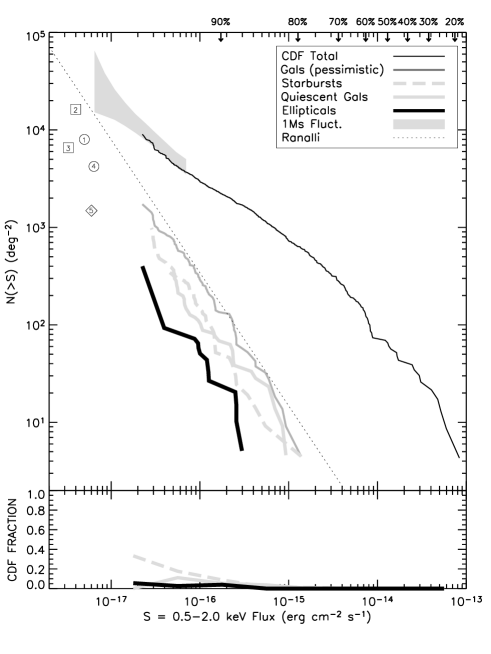
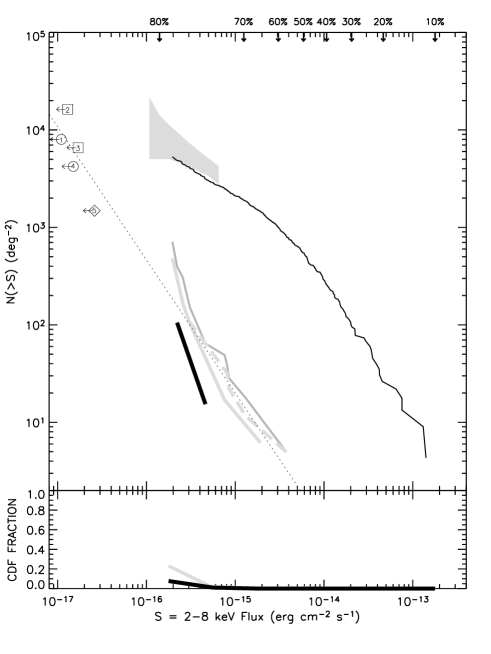
The AGN number-count slopes are flat in both bands, indicating that we are now observing AGN beyond the differential peak in the AGN number-count distribution. While the X-ray source densities of AGNs, in a differential sense (see lower panel of Figure 4), appear to be in a state of decline at X-ray fluxes below erg cm-2 s-1, the star-forming galaxy population is rising strongly (nearly Euclidean and consistent with the previously measured normal galaxy X-ray number counts of Hornschemeier et al., 2003). The star-forming galaxy number counts also agree well with the predictions made by Ranalli et al. (2003) using the X-ray/radio correlation (e.g., Bauer et al., 2002a; Ranalli et al., 2003) and the radio number counts of Richards (2000), indicating that there is a good correspondence between the X-ray and radio emission in these sources.
For completeness we also present the X-ray number counts for the 22 spectroscopically identified, Galactic stars discovered in the CDFs. These high-latitude stars are typically old G, K, and M types which are thought to emit X-ray emission via magnetic flaring; we refer the reader to Feigelson et al. (2004), who have performed analyses on a subset of the X-ray-detected stars presented here. The number-count slope of the Galactic stars is flat in the soft band and indeterminate in the hard band.
4.1.2 AGN Number Counts
We further subdivided the AGN sample based on both optical and X-ray properties. Unfortunately, the only meaningful optical division we can place is based on AGN with broad lines reported in their optical spectra (i.e., Type 1), and those apparently lacking them (i.e., not obviously Type 1 AGN), since the optical spectra are not archived, adequately analyzed, nor typically of very high signal-to-noise. Thus the “not obviously Type 1” category is probably too loose to provide much insight, as it is likely to include not only classic narrow-line AGN (Type 2), but also slightly more luminous versions of Compton-thick AGN like NGC 4945 and NGC 6240 (e.g., Matt et al., 2000), XBONGS (Comastri et al., 2002), and other odd types. We further caution that spectral misclassifications are likely for some sources since broad lines may be apparent in certain parts of the optical spectrum but not others or may be missed due to host-galaxy contamination or poor signal-to-noise data (e.g., see discussion in Moran et al., 2002). In particular, there are a significant number of CDF sources with high photometric redshifts that could turn out to be broad-line AGN (see Figure 6). Given this likely incompleteness, the number counts for the optical Type 1 and not obviously Type 1 AGN must be considered lower and upper limits, respectively. Similarly, AGN with column density estimates cm-2 were considered X-ray unobscured/mildly obscured AGN, and those above X-ray obscured AGN. Again, we caution that this distinction is far from exact, as it is based on the fit of a relatively simple spectral model, which surely is inadequate considering the known spectral complexity exhibited by local AGN (e.g., reflection, scattering, partial covering, host-galaxy contamination). Such effects tend to contribute more soft flux than predicted by a simple model and therefore can lead to an underestimate of the column density or confuse the spectral fit.
From Figure 8, we find that optical Type 1 AGN fall off abruptly below erg cm-2 s-1 in both bands, ultimately reaching source densities –20 times lower than those of AGN that are not obviously Type 1 at the CDF detection threshold. While this may be a legitimate effect, the ability to detect broad lines tends to decrease at fainter optical (and hence X-ray) fluxes, and thus we cannot exclude the possibility that observational limitations contribute to this decline. Considering AGN by their X-ray properties yields similar, albeit less extreme, results. The source density of unobscured/mildly obscured AGN gradually trails off below erg cm-2 s-1 in both bands, ultimately reaching source densities –3 times lower than those of obscured AGN at the CDF detection threshold.
The faint-end number-count slopes of all AGN subsamples are . At the CDF flux limits, we find AGN source densities of 7166 sources deg-2 (soft) and 4558 sources deg-2 (hard), which are factors of –20 higher than the 300–500 sources deg-2 found in the deepest optical spectroscopic AGN surveys (e.g., Hall et al., 2000; Steidel et al., 2002; Wolf et al., 2003; Hunt et al., 2004). At face value, this means that optical observations appear to be missing 90% of AGN compared to the deepest X-ray observations, although we concede that a direct comparison is not entirely fair. The optical surveys often target specific redshift and luminosity ranges, and X-ray and optical survey results are more consistent when compared within these ranges (c.f., Hunt et al., 2004). Importantly though, the AGN discovered in deep optical surveys are generally AGN with strong emission lines or blue continua and only have source densities comparable to our optical Type 1 AGN sample alone (i.e., 325–350 sources deg-2). Given these facts, X-ray observations therefore appear to be much more effective at identifying AGNs, particularly (more typical) obscured AGNs. This conclusion is not entirely surprising given that the optical spectra of many AGN in the CDFs are dominated by host-galaxy light.
4.1.3 AGN Completeness
While the AGN source densities achieved above are impressive, it is important to understand the completeness of our X-ray selection of AGN. It is likely, for instance, that we are still missing a significant fraction of low-luminosity AGN (primarily those which have steep X-ray spectra or fail to dominate over host-galaxy emission), as such AGN are often difficult to identify even in the local Universe (e.g., Ho et al., 1997). Local studies have also shown that 40% of moderate-to-high luminosity AGN are Compton thick, with very little direct emission from the AGN (e.g., Maiolino et al., 1998; Matt et al., 2000). Again, such sources are difficult to identify since their observed X-ray luminosities are often erg s-1 and contaminated by host galaxy emission; many such sources may be present in the CDFs but fall below our AGN luminosity threshold.
Putting these caveats aside, however, there are only two classified AGN in the CDFs which are not yet detected at X-ray wavelengths (both in the 2 Ms CDF-N). The first, VLA J123725.7621128, is a radio-bright ( mJy at 1.4 GHz) wide-angle-tail source estimated to lie between –2 with a rest-frame 0.5–2.0 keV luminosity limit of erg s-1 (e.g., Snellen & Best, 2001; Bauer et al., 2002b).222VLA J123725.7621128 can be marginally detected with some tweaking of WAVDETECT’s detection parameters beyond the scope of A03. The second, 123720.0621222, is a narrow-line AGN at (Hunt et al., 2004) with a rest-frame 0.5–2.0 keV luminosity limit of erg s-1.
There are several more AGN candidates which lack X-ray detections, although their classifications are considerably more tentative. Most notably, 10 of the 30 radio sources with 1–10 mJy at 1.4 GHz Richards, 2000; A. Koekemoer 2004, private communication lack X-ray detections in the combined CDFs. This number is consistent with expectations that 30% of radio sources at 1 mJy are star-forming galaxies (e.g., Jackson & Wall, 1999), although four of these sources have faint () optical counterparts (atypical of comparable radio-detected star-forming galaxies) and thus may be radio-loud AGN. At optical wavelengths, Wolf et al. (2004) report 51 “QSO” candidates within the 1 Ms CDF-S region using the COMBO-17 photometric redshift survey. Nearly half (24) of these lack X-ray counterparts. All but one of these non-detections, however, have ambiguous classifications [i.e., “QSO (Gal?)”] or (where the reliability of the COMBO-17 photometric redshifts becomes poor). Thus, we do not consider these to be convincing. Finally, Sarajedini et al. (2003) discovered 16 (with a correction of for incompleteness and potential spurious sources) variable galactic nuclei within the Hubble Deep Field-North. These variable nuclei are thought to be primarily low-luminosity AGN (; e.g., Ho et al., 1997), although a few may be nuclear supernovae (e.g., Riess et al., 1998). Only six have X-ray detections in the 2 Ms CDF-N, indicating 40% overlap with the X-ray sample.333 Sarajedini et al. (2003) actually report 7 X-ray matches, but the match of CXOHDFN J123651.73621221.4 to HDF 3-461.9 is incorrect as this X-ray source lies outside of the galaxy and has a more viable faint near-IR counterpart. Also, the X-ray luminosities for several of the matches are low enough to be due entirely to star-formation rather than AGN activity. If all of the variable nuclei are indeed AGN, then their number density ( deg-2) would surpass that found in the CDFs. It should be strongly emphasized here, however, that many of the AGN selected via optical nuclear variability are likely to have X-ray emission that is intrinsically 1–2 orders of magnitude lower than the CDF detection limits (i.e., – erg s-1; see Ho et al., 2001), and thus are not directly comparable.
Given all of the above, X-ray emission appears to be one of the most efficient and complete selection criteria currently available for selecting moderate-to-high luminosity AGN.
4.1.4 Galaxy Number Counts
As noted above, the star-forming galaxy population is rising rapidly below erg cm-2 s-1 in both bands. As was done for the AGN, we have further subdivided the galaxy sample based on optical and X-ray properties to gain further insight into this population. We used the HST-derived elliptical galaxy sample of Immler et al. (2004) to separate ellipticals (presumably passively evolving at the redshifts of relevance here) from spirals/irregulars/mergers (presumably actively star-forming), on the assumption that the former is likely to be dominated by different X-ray emission mechanisms (e.g., low-mass X-ray binaries, low-luminosity AGN) compared to the latter (e.g., high-mass X-ray binaries, supernovae, hot gas). The Immler et al. (2004) elliptical galaxy sample is derived from the Great Observatories Origins Deep Survey (GOODS) observations, which cover only 40% of the CDFs, so the ratio of ellipticals to other types is probably underestimated. Fortunately, % of the galaxy sample overlaps with the GOODS regions, so the elliptical galaxy number counts are likely to be underestimated by %. The non-ellipticals were split into two groups above and below , as set forth by Alexander et al. (2002a) to denote starburst and quiescent galaxies, respectively.444We would prefer to use radio and infrared data, the ”classical” probes of star-formation rate, to separate starburst and quiescent galaxies. However, the currently available infrared data cover only a tiny fraction of the CDF-N (e.g., Alexander et al., 2002a), and regions with overlapping 1.4 GHz and 8.5 GHz radio data (necessary for radio spectral slopes; e.g., Bauer et al., 2002a) either cover only a small fraction of the field (CDF-N) or are not yet deep enough to detect large numbers of star-forming galaxies (CDF-S).
The number-count slopes of the starburst and quiescent galaxy samples are consistent with being Euclidean (see Table 1), suggesting they may track to some extent the strongly evolving infrared galaxy population (e.g., Elbaz et al., 1999; Alexander et al., 2002a). The elliptical galaxies, meanwhile, have a somewhat flatter slope. Caution should be exercised when interpreting the very steep slopes observed in the hard band, of course, as these are uncertain and may be biased upward by unidentified low-luminosity or Compton-thick AGNs in all three samples. Quantifying the star-forming galaxy number counts at brighter X-ray fluxes would be useful for comparison with our slope estimates to determine potential evolutionary properties. We note again that the starburst and quiescent galaxy number-count slopes agree to within errors with the predictions made by Ranalli et al. (2003) using both the X-ray/radio correlation (e.g., Bauer et al., 2002a; Ranalli et al., 2003) and the radio number counts of Richards (2000).
Visual extrapolations of the starburst, quiescent, and elliptical galaxy number counts to fainter X-ray fluxes appear to be consistent with stacking results for various extragalactic source populations (see Figure 9). At the CDF flux limits, we find source densities of 984, 343, and 105 sources deg-2 (soft) and 123, 481, and 399 sources deg-2 (hard) for the starburst, quiescent, and elliptical galaxy samples, respectively.
4.2. AGN Number Counts by X-ray Luminosity and Absorption
Using our estimated redshifts, we can also divide the CDF sources into intrinsic X-ray luminosity and absorption bins. This is a useful exercise both for better understanding the types of X-ray sources contributing to the XRB and for testing the recent AGN X-ray luminosity function of Ueda et al. (2003, hereafter simply the Ueda XLF). The Ueda XLF is constructed from X-ray sources with fluxes above erg cm-2 s-1 (including sources from the CDF-N) and is strictly applicable only for sources with intrinsic X-ray luminosities above erg s-1 and column densities below cm-2. To compare to our full CDF dataset, we have extrapolated the Ueda XLF down to the CDF sensitivity limits and to intrinsic luminosities of erg s-1 in order to test its predictive power. For details of this extrapolation, see Treister et al. (2004).
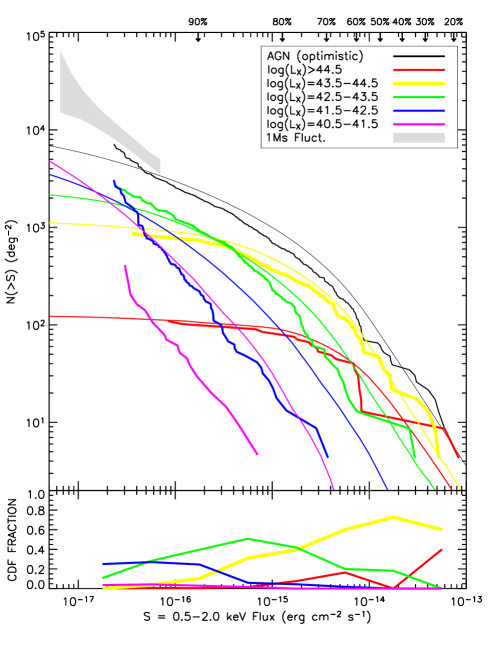
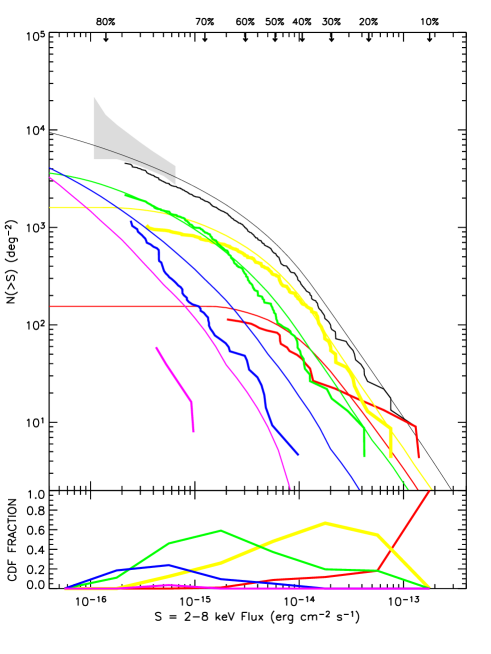
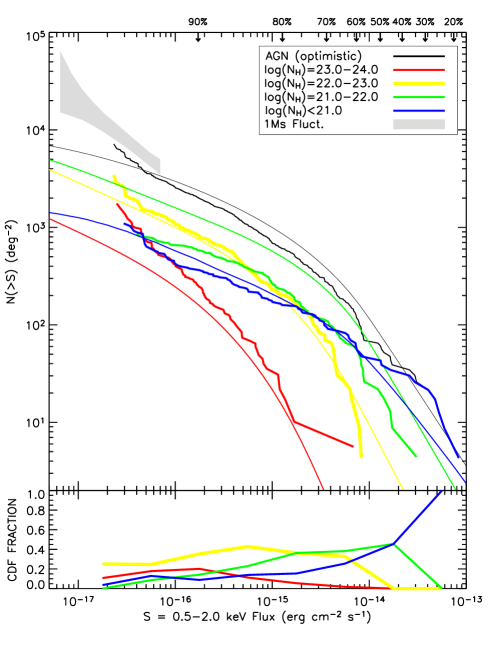
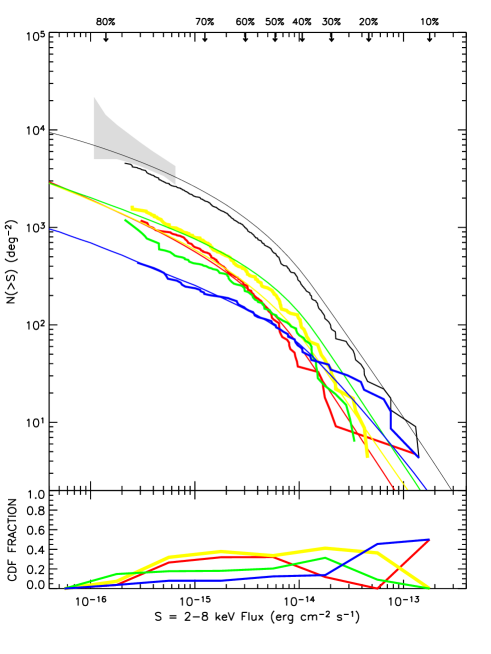
Figure 10 shows the optimistic AGN sample in the CDFs, separated into several different intrinsic luminosity and absorption classes. Also shown are the predicted X-ray number counts from the Ueda XLF for the same classes. Some caution should be exercised when interpreting the CDF number counts from cm-2 AGN. Chandra’s effective area above 4–5 keV declines rapidly such that the CDFs are almost certainly systematically missing a significant fraction of the most highly obscured AGN (e.g., Treister et al., 2004). This bias was not accounted for in our simulations, as we averaged over the energy dependence of Chandra’s effective area in our flux correction and furthermore assumed that all of our simulated sources had a spectral shape consistent with a power law.
It is readily apparent that the Ueda XLF overestimates the actual CDF AGN number counts in both bands. We have derived error bars on the cumulative distributions following Gehrels (1986) and calculated the deviation at each data point from the model in units of sigma. In the soft band, the data points consistently lie below the model over the flux range erg cm-2 s-1 to erg cm-2 s-1, with the statistical deviation increasing from 1–2 at the brighter end of this range to 4–5 at the fainter end of this range. In the hard band, the data points consistently lie below the model over the entire flux range, with the statistical deviation steadily increasing with decreasing flux from 1–5.5. The discrepancies are still significant (up to 3) even if we only consider sources over the original flux range used to construct the Ueda XLF. Note that the upturn seen in the soft-band data below erg cm-2 s-1 in Figure 10 is likely due to X-ray spectral complexity (as discussed in 4.1.1) not accounted for in the simple spectral model used to construct the Ueda XLF.
Turning to the individual intrinsic luminosity bins in Figure 10, we find that the soft-band XRB is dominated by sources with erg s-1, while the hard-band XRB is dominated by somewhat less luminous sources with – erg s-1. There is good agreement between the highest individual CDF luminosity bins and the Ueda XLF in both bands, with the best estimates in the soft band being among the erg s-1 and – erg s-1 AGN samples, as well as the bright end of the – erg s-1 AGN sample. The Ueda XLF, however, consistently overestimates the soft-band number counts of (1) – erg s-1 AGN below erg cm-2 s-1, with the statistical deviation steadily increasing with decreasing flux from 1–6, and (2) erg s-1 AGN over the flux range erg cm-2 s-1 to erg cm-2 s-1, with the statistical deviation increasing from 1–2 at the brightest and faintest ends of this range to 8–10 in the middle of this range. In the hard band, the Ueda XLF again consistently overestimates the number counts of the (1) – erg s-1 AGN below erg cm-2 s-1, with the statistical deviation steadily increasing with decreasing flux from 1–6, and (2) erg s-1 AGN over the flux range erg cm-2 s-1 to erg cm-2 s-1, with the statistical deviation increasing from 1–2 at the brightest and faintest ends of this range to 5–6 in the middle of this range. The discrepancies between the Ueda XLF predictions and the actual number of low-luminosity AGN have also been noted by Menci et al. (2004).
In terms of intrinsic absorption bins, we find that in the soft band the XRB is dominated by relatively unobscured sources with cm-2, while in the hard band the contribution to the XRB from all of the different absorption bins is nearly equal. Again, there is good agreement between some of the individual CDF absorption bins and the Ueda XLF, although discrepancies between the Ueda XLF and the data are more evident here. In the soft band, the agreement is good for cm-2 and – cm-2 AGN. However, the Ueda XLF model consistently overestimates the soft-band number counts of – cm-2 AGN over the entire flux range, with the statistical deviation steadily increasing with decreasing flux from 1–19, and underestimates the soft-band number counts of – cm-2 AGN over the entire flux range, with the statistical deviation steadily increasing with decreasing flux from 1–6. Note that this latter discrepancy is in the opposite sense to Chandra’s possible observational bias mentioned above and is therefore likely to be even worse. In the hard band, the agreement between the Ueda XLF model and the data is good for cm-2, – cm-2, and – cm-2 AGN, but consistently overestimates the hard-band number counts of – cm-2 AGN over the flux range erg cm-2 s-1 to erg cm-2 s-1, with the statistical deviation steadily increasing with decreasing flux from 1–6.

Some of the discrepancies between the individual luminosity and absorption bins and the Ueda XLF may be due to our assumptions regarding the redshift distribution (and hence the absorption and X-ray luminosity distributions). Several arguments suggest that this is unlikely to be the case: (1) The Ueda XLF overestimates the total number counts as well, where no redshift information is used. (2) The agreement between the lowest and highest column density sources is fairly good. Significant changes to the redshift distribution either way would worsen the agreement. (3) If the redshift distribution is on average higher than we have estimated in 4.1, then sources from lower X-ray luminosity bins, where the overestimate is already bad, would move into higher ones where the agreement is already acceptably good (thus worsening the agreement). (4) The X-ray sources are unlikely to lie at significantly lower redshifts than those assumed given that the sources are not generally detected in the bluest optical bands, implying substantial redshifts or that they reside in severely underluminous galaxies. The latter is unlikely given what we know about the host galaxies of powerful AGN in the nearby Universe (Kauffmann et al., 2003).
Figure 11 shows the derived CDF distribution (including errors) and the extrapolated Ueda et al. (2003) model. There is rough agreement between the data and model, although the CDF distribution clearly appears to be bimodel, while the Ueda et al. (2003) model does not. These deviations are less obvious in Figure 10 because of the coarser binning and the effect contamination from star-forming host galaxies has on the X-ray fluxes of highly obscured AGN. While the upper and lower limits on the overall determinations (dashed and dotted lines, respectively) are tight enough to exclude the possibility of this bimodality being spurious, the assumed redshift distribution for sources lacking redshifts could play a role in shaping the distribution. For instance, adopting a larger scatter in the redshift distribution might broaden the distribution to be more in line with the flat distribution from the Ueda et al. (2003) model. Alternatively, if we have systematically underestimated redshifts this would tend to shift the second peak toward higher values and increase discrepancies between the data and model at moderate column densities. We consider the CDF distribution shown in Figure 11 to be fairly robust, however, since it would take exceptionally large deviations in the adopted redshift distribution to change intrinsic values by more than a factor of a few given that . Thus, it appears that the extrapolated Ueda et al. (2003) distribution is not entirely appropriate for the CDF data. Treister et al. (2004) come to a similar conclusion using a more luminous subset of the CDF AGN and an distribution derived instead from X-ray colors.
4.3. Contributions to the Extragalactic X-ray Background
The contributions to the soft and hard XRB from each CDF source type are shown in Table 2, normalized by the average total flux density of the XRB [taken from M03 in the soft band to be ( erg cm-2 s-1 deg-2 and from De Luca & Molendi, 2004 in the hard band to be ( erg cm-2 s-1 deg-2]. For sources brighter than observed in the CDFs (i.e., erg cm-2 s-1 and erg cm-2 s-1), we have adopted total resolved flux-density contributions from the models of M03, which are 19.2% in the soft band and 11.5% in the hard band; we assume uncertainties of 4% on these values estimated from Figure 5 of M03.
The crude breakdown of these bright resolved fractions is 40% stars, 40% Type 1 AGN, 5% Type 2 AGN, 10% clusters, 5% galaxies in the soft band, and 1% stars, 69% Type 1 AGN, 20% Type 2 AGN, 8% clusters, and 2% galaxies in the hard band (e.g., Krautter et al., 1999; La Franca et al., 2002; Akiyama et al., 2003). When known, these values have been added to column 4 of Table 2 to produce total resolved XRB fractions in column 5 of Table 2. In total, and neglecting possible large-scale structure effects and instrumental cross-calibration uncertainties, we find 89.5% and 86.9% of the XRB has been resolved in the soft and hard bands, respectively.
We find that AGN as a whole contribute 83% and 95% to the resolved soft and hard XRBs, respectively. Dividing the AGN further, we find that Type 1 AGN alone contribute significantly (%) to the AGN fraction of the resolved XRB in the soft band, but far less so (%) in the hard band. X-ray unobscured/mildly obscured AGN completely dominate (%) the AGN fraction of the resolved XRB in the soft band, and contribute nearly half (%) in the hard band. If this latter trend continues to harder energies, it suggests that highly obscured X-ray sources will likely dominate the XRB emission at higher energies (e.g., closer to –40 keV peak of the XRB). This can be directly tested by performing similar analyses on deep 5.0–10.0 keV number counts from XMM-Newton. In contrast, star-forming galaxies comprise only 10% and 2% of the soft and hard XRBs. Starbursts appear to make up the bulk of the X-ray emission in the soft band, while quiescent galaxies apparently dominate in the hard band; contamination from embedded, highly obscured AGN may be responsible in the latter case.
Extrapolating the total number-count slopes from Table 1 down to erg cm-2 s-1 in the soft band and erg cm-2 s-1 in the hard band can account for an additional % and % of the XRBs, respectively. We note, however, that some of the number-count slopes for the individual CDF source types are significantly steeper than the overall number-count slopes and that independent extrapolation of these slopes actually exceeds the total XRB by a large percentage in some cases. This suggests that (1) known point-source populations can explain all of the remaining unresolved XRB and (2) the steep slopes found for some source types must flatten in the decade of flux below the CDF sensitivity limits. As such, we contend that there is little room for extra contributions from, e.g., a truly diffuse component. We additionally find that the number density of star-forming galaxies should overtake that of the AGN just below erg cm-2 s-1 in both bands, and these sources should contribute an additional 10% and 5% to the soft and hard XRB emission (here we have assumed a flattening of the starburst number counts for sources as inferred from infrared galaxy number counts; e.g., Chary & Elbaz, 2001).
Thus, the overall contribution of galaxies to the XRB appears to be 10–20% in the soft band and 2–6% in the hard band, indicating that if the cosmic star-formation rate evolves as then is likely to be near rather than a higher value (see Persic & Rephaeli, 2003). This is consistent with previous results from stacking analyses (e.g., Hornschemeier et al., 2002; Georgakakis et al., 2004) as well as the recently measured normal galaxy XLF (Norman et al., 2004).
We note that we are using relatively broad X-ray bands, and that the resolved fraction at a given energy may change somewhat throughout these bandpasses. Since the effective area of Chandra falls off rapidly above 4 keV, we are likely to resolve more of the 2–4 keV XRB and less of the 4–8 keV XRB. An investigation into this is beyond the scope of this study, but has been undertaken by Worsley et al. (2004; 2004, in preparation) using the deep Lockman Hole and the CDFs. They perform photometry of the resolved source in several narrow X-ray bands, finding that the resolved fraction of the XRB is indeed sytematically lower at harder X-ray energies. They also find that the resultant X-ray spectrum of the unresolved XRB is consistent with that from a highly-obscured (– cm-2 for ) AGN.
5. Conclusions
We have combined the CDF-N and CDF-S X-ray samples, along with substantial public ancillary data, to examine the X-ray number counts as a function of source type. Extensive simulations were carried out to quantify and correct for the completeness and flux bias problems which affect the CDF number counts. Once corrected, we find that the number counts from the two fields are consistent with each other aside from sources detected in the 2–8 keV band below erg cm-2 s-1, where statistical deviations gradually increase to at the faintest flux levels. We also find that our overall number counts are consistent with previous determinations. In total, we have resolved 89.5% and 86.9% of the extragalactic 0.5–2.0 keV and 2–8 keV XRB, respectively.
Using a classification scheme based on X-ray spectral properties, intrinsic X-ray luminosities, radio morphologies, variability, optical spectroscopic classifications, and X-ray-to-optical flux ratios, we have separated the CDF X-ray sources into 698 AGN (split into optical Type 1 and not obviously Type 1, and X-ray obscured and unobscured/mildly obscured), 109 star-forming galaxies (split into starburst, quiescent, and elliptical), and 22 Galactic stars, and determined their individual number counts. We additionally calculate the number-count slopes and normalizations below erg cm-2 s-1 for all source types assuming a single power-law model.
We confirm that AGN power the bulk of the extragalactic XRB, with only a small contribution from star-forming galaxies. The most significant contributions to the XRB are from sources with erg s-1 and cm-2 in the soft band and – erg s-1 and an evenly-distributed range of absorption column densities in the hard band. This trend suggests that even less luminous, more highly obscured AGN may in fact dominate the number counts at higher energies, where the XRB intensity peaks. At the CDF flux limits, the overall AGN source densities are 7166 sources deg-2 and 4558 sources deg-2, respectively, factors of –20 higher than found in the deepest optical spectroscopic surveys.
While star-forming galaxies make up a small fraction of sources with fluxes higher than erg cm-2 s-1 in both bands, their numbers climb steeply below this flux such that they eventually achieve source densities of 1727 sources deg-2 and 711 sources deg-2 at the CDF flux limits (with starburst galaxies making the largest contribution) and comprise up to % of the sources at the faintest X-ray fluxes. Extrapolation of the number-count slopes for galaxy source types can account for all of the remaining unresolved soft and hard XRBs. Moreover, within a factor of a few below the current CDF soft-band flux limit, the sky density of star-forming galaxies will likely overtake that of AGN.
We have also compared the Ueda et al. (2003) XLF with our X-ray number counts. While the agreement is generally good for most subsets of CDF sources, it appears that the extrapolated XLF requires some significant refinements before it will be able to reproduce the data with sufficient accuracy.
Further improvements to our study can be made in several ways. Constraining the bright-flux end of the number counts for all of our source types would be particularly useful for determining more accurate slopes and XRB contributions. Additional observations of the 2 Ms CDF-N with Chandra would (1) yield additional photons to discriminate better between AGN and galaxies and model spectral complexities for better absorption column density and luminosity estimates, (2) allow confirmation of the sharp rise in the number counts of both star-forming galaxies and moderate-to-high obscuration () AGN that we find here, and (3) perhaps provide evidence for their eventual flattening as is required by the overall XRB flux density. Upcoming ancillary observations at infrared (Spitzer) and radio (VLA) wavelengths, as well as detailed analyses of the existing optical spectra, would be extremely helpful for refining our AGN and galaxy subclassifications. Finally, a high-sensitivity, high spatial resolution X-ray telescope able to probe to erg cm-2 s-1 in the 10–40 keV band is desperately needed to resolve the peak of the XRB and determine once and for all the nature and composition of the XRB.
References
- Akiyama et al. (2003) Akiyama, M., Ueda, Y., Ohta, K., Takahashi, T., & Yamada, T. 2003, ApJS, 148, 275
- Akiyama et al. (2000) Akiyama, M., et al. 2000, ApJ, 532, 700
- Alexander et al. (2002a) Alexander, D. M., Aussel, H., Bauer, F. E., Brandt, W. N., Hornschemeier, A. E., Vignali, C., Garmire, G. P., & Schneider, D. P. 2002a, ApJ, 568, L85
- Alexander et al. (2001) Alexander, D. M., Brandt, W. N., Hornschemeier, A. E., Garmire, G. P., Schneider, D. P., Bauer, F. E., & Griffiths, R. E. 2001, AJ, 122, 2156
- Alexander et al. (2002b) Alexander, D. M., Vignali, C., Bauer, F. E., Brandt, W. N., Hornschemeier, A. E., Garmire, G. P., & Schneider, D. P. 2002b, AJ, 123, 1149
- Alexander et al. (2003) Alexander, D. M., et al. 2003, AJ, 126, 539 (A03)
- Arnouts et al. (2001) Arnouts, S., et al. 2001, A&A, 379, 740
- Bade et al. (1998) Bade, N., et al. 1998, A&AS, 127, 145
- Barger et al. (2002) Barger, A. J., Cowie, L. L., Brandt, W. N., Capak, P., Garmire, G. P., Hornschemeier, A. E., Steffen, A. T., & Wehner, E. H. 2002, AJ, 124, 1839
- Barger et al. (2003) Barger, A. J., et al. 2003, AJ, 126, 632
- Bassani et al. (1999) Bassani, L., Dadina, M., Maiolino, R., Salvati, M., Risaliti, G., della Ceca, R., Matt, G., & Zamorani, G. 1999, ApJS, 121, 473
- Bauer et al. (2002a) Bauer, F. E., Alexander, D. M., Brandt, W. N., Hornschemeier, A. E., Vignali, C., Garmire, G. P., & Schneider, D. P. 2002a, AJ, 124, 2351
- Bauer et al. (2002b) Bauer, F. E., et al. 2002b, AJ, 123, 1163
- Brandt et al. (2001a) Brandt, W. N., Hornschemeier, A. E., Schneider, D. P., Alexander, D. M., Bauer, F. E., Garmire, G. P., & Vignali, C. 2001a, ApJ, 558, L5
- Brandt et al. (2001b) Brandt, W. N., et al. 2001b, AJ, 122, 2810
- Broos et al. (2004) Broos, P., Townsley, L., Getman, K., & Bauer, F. 2004, ACIS Extract, An ACIS Point Source Extraction Package, Pennsylvania State University, http://www.astro.psu.edu/xray/docs/TARA/ae_users_guide.html
- Cash (1979) Cash, W. 1979, ApJ, 228, 939
- Chary & Elbaz (2001) Chary, R. & Elbaz, D. 2001, ApJ, 556, 562
- Colbert et al. (2004) Colbert, E. J. M., Heckman, T. M., Ptak, A. F., Strickland, D. K., & Weaver, K. A. 2004, ApJ, 602, 231
- Coleman et al. (1980) Coleman, G. D., Wu, C.-C., & Weedman, D. W. 1980, ApJS, 43, 393
- Comastri et al. (2002) Comastri, A., et al. 2002, ApJ, 571, 771
- Condon (1984) Condon, J. J. 1984, ApJ, 287, 461
- Condon (1986) — 1986, PASP, 98, 152
- Cowie et al. (2002) Cowie, L. L., Garmire, G. P., Bautz, M. W., Barger, A. J., Brandt, W. N., & Hornschemeier, A. E. 2002, ApJ, 566, L5 (C02)
- De Luca & Molendi (2004) De Luca, A. & Molendi, S. 2004, A&A, 419, 837
- Elbaz et al. (1999) Elbaz, D., et al. 1999, A&A, 351, L37
- Fabbiano (1989) Fabbiano, G. 1989, ARA&A, 27, 87
- Feigelson et al. (2004) Feigelson, E., Hornschemeier, A., Micela, G., Bauer, F., Alexander, D., Brandt, W., Favata, F., & Sciortino, S. 2004, ApJ, in press (astro-ph/0405026)
- Fiore et al. (2003) Fiore, F., et al. 2003, A&A, 409, 79
- Freeman et al. (2002) Freeman, P. E., Kashyap, V., Rosner, R., & Lamb, D. Q. 2002, ApJS, 138, 185
- Gehrels (1986) Gehrels, N. 1986, ApJ, 303, 336
- Georgakakis et al. (2004) Georgakakis, A., et al. 2004, MNRAS, 349, 135
- Giacconi et al. (2001) Giacconi, R., et al. 2001, ApJ, 551, 624
- Giacconi et al. (2002) — 2002, ApJS, 139, 369
- Gilli (2003) Gilli, R. 2003, in New X-ray Results from Clusters of Galaxies and Black Holes. Edited by C. Done, E.M. Puchnarewicz, M.J. Ward. Advances in Space Research (astro-ph/0303115)
- Gilli et al. (2003) Gilli, R., et al. 2003, ApJ, 592, 721
- Grogin et al. (2003) Grogin, N. A., et al. 2003, ApJ, 595, 685
- Hall et al. (2000) Hall, P. B., et al. 2000, AJ, 120, 2220
- Ho et al. (1997) Ho, L. C., Filippenko, A. V., & Sargent, W. L. W. 1997, ApJS, 112, 315
- Ho et al. (2001) Ho, L. C., et al. 2001, ApJ, 549, L51
- Hornschemeier et al. (2002) Hornschemeier, A. E., Brandt, W. N., Alexander, D. M., Bauer, F. E., Garmire, G. P., Schneider, D. P., Bautz, M. W., & Chartas, G. 2002, ApJ, 568, 82
- Hornschemeier et al. (2000) Hornschemeier, A. E., et al. 2000, ApJ, 541, 49
- Hornschemeier et al. (2003) — 2003, AJ, 126, 575
- Hunt et al. (2004) Hunt, M. P., Steidel, C. C., Adelberger, K. L., & Shapley, A. E. 2004, ApJ, 605, 625
- Immler et al. (2004) Immler, S., et al. 2004, AJ, submitted
- Jackson & Wall (1999) Jackson, C. A. & Wall, J. V. 1999, MNRAS, 304, 160
- Kauffmann et al. (2003) Kauffmann, G., et al. 2003, MNRAS, 346, 1055
- Kim et al. (2004) Kim, D.-W., et al. 2004, ApJ, 600, 59
- Koekemoer et al. (2004) Koekemoer, A. M., et al. 2004, ApJ, 600, L123
- Krautter et al. (1999) Krautter, J., et al. 1999, A&A, 350, 743
- La Franca et al. (2002) La Franca, F., et al. 2002, ApJ, 570, 100
- Le Fevre et al. (2004) Le Fevre, O., Vettolani, G., Paltani, S., Tresse, L., Zamorani, G., Le Brun, V., & Moreau, C. 2004, A&A, submitted (astro-ph/0403628)
- Lira et al. (2002) Lira, P., Ward, M., Zezas, A., Alonso-Herrero, A., & Ueno, S. 2002, MNRAS, 330, 259
- Lockman (2004) Lockman, F. J. 2004, in Soft X-ray Emission from Clusters of Galaxies and Related Phonomena. Edited by R. Lieu. Kluwer (astro-ph/0311386)
- Maccacaro et al. (1988) Maccacaro, T., Gioia, I. M., Wolter, A., Zamorani, G., & Stocke, J. T. 1988, ApJ, 326, 680
- Mainieri et al. (2002) Mainieri, V., Bergeron, J., Hasinger, G., Lehmann, I., Rosati, P., Schmidt, M., Szokoly, G., & Della Ceca, R. 2002, A&A, 393, 425
- Maiolino et al. (1998) Maiolino, R., Salvati, M., Bassani, L., Dadina, M., della Ceca, R., Matt, G., Risaliti, G., & Zamorani, G. 1998, A&A, 338, 781
- Matt et al. (2000) Matt, G., Fabian, A. C., Guainazzi, M., Iwasawa, K., Bassani, L., & Malaguti, G. 2000, MNRAS, 318, 173
- Menci et al. (2004) Menci, N., Fiore, F., Perola, G. C., & Cavaliere, A. 2004, ApJ, 606, 58
- Miyaji & Griffiths (2002) Miyaji, T. & Griffiths, R. E. 2002, ApJ, 564, L5
- Moran et al. (2002) Moran, E. C., Filippenko, A. V., & Chornock, R. 2002, ApJ, 579, L71
- Moran et al. (1999) Moran, E. C., Lehnert, M. D., & Helfand, D. J. 1999, ApJ, 526, 649
- Moretti et al. (2003) Moretti, A., Campana, S., Lazzati, D., & Tagliaferri, G. 2003, ApJ, 588, 696 (M03)
- Morrison & McCammon (1983) Morrison, R. & McCammon, D. 1983, ApJ, 270, 119
- Murdoch et al. (1973) Murdoch, H. S., Crawford, D. F., & Jauncey, D. L. 1973, ApJ, 183, 1
- Mushotzky et al. (2000) Mushotzky, R. F., Cowie, L. L., Barger, A. J., & Arnaud, K. A. 2000, Nature, 404, 459
- Nandra et al. (2002) Nandra, K., Mushotzky, R. F., Arnaud, K., Steidel, C. C., Adelberger, K. L., Gardner, J. P., Teplitz, H. I., & Windhorst, R. A. 2002, ApJ, 576, 625
- Norman et al. (2004) Norman, C., et al. 2004, ApJ, 607, 721
- Osterbrock (1989) Osterbrock, D. E. 1989, Astrophysics of gaseous nebulae and active galactic nuclei (Mill Valley: University Science Books)
- Padovani et al. (2004) Padovani, P., Allen, M. G., Rosati, P., & Walton, N. A. 2004, A&A
- Persic & Rephaeli (2003) Persic, M. & Rephaeli, Y. 2003, A&A, 399, 9
- Poggianti (1997) Poggianti, B. M. 1997, A&AS, 122, 399
- Ranalli et al. (2003) Ranalli, P., Comastri, A., & Setti, G. 2003, A&A, 399, 39
- Richards (2000) Richards, E. A. 2000, ApJ, 533, 611
- Riess et al. (1998) Riess, A. G., et al. 1998, AJ, 116, 1009
- Rosati et al. (2002) Rosati, P., et al. 2002, ApJ, 566, 667
- Sarajedini et al. (2003) Sarajedini, V. L., Gilliland, R. L., & Kasm, C. 2003, ApJ, 599, 173
- Schmidt et al. (1998) Schmidt, M., et al. 1998, A&A, 329, 495
- Snellen & Best (2001) Snellen, I. A. G. & Best, P. N. 2001, MNRAS, 328, 897
- Spergel et al. (2003) Spergel, D. N., et al. 2003, ApJS, 148, 175
- Stark et al. (1992) Stark, A. A., Gammie, C. F., Wilson, R. W., Bally, J., Linke, R. A., Heiles, C., & Hurwitz, M. 1992, ApJS, 79, 77
- Steidel et al. (2003) Steidel, C. C., Adelberger, K. L., Shapley, A. E., Pettini, M., Dickinson, M., & Giavalisco, M. 2003, ApJ, 592, 728
- Steidel et al. (2002) Steidel, C. C., Hunt, M. P., Shapley, A. E., Adelberger, K. L., Pettini, M., Dickinson, M., & Giavalisco, M. 2002, ApJ, 576, 653
- Stocke et al. (1991) Stocke, J. T., Morris, S. L., Gioia, I. M., Maccacaro, T., Schild, R., Wolter, A., Fleming, T. A., & Henry, J. P. 1991, ApJS, 76, 813
- Szokoly et al. (2004) Szokoly, G., et al. 2004, ApJS, in press (astro-ph/0312324)
- Tozzi et al. (2001) Tozzi, P., et al. 2001, ApJ, 562, 42
- Treister et al. (2004) Treister, E., Urry, C. M., Chatzichristou, E., Bauer, F. E., Alexander, D. M., Koekemoer, A. M., Van Duyne, J., & Brandt, W. N. 2004, ApJ, submitted
- Ueda et al. (2003) Ueda, Y., Akiyama, M., Ohta, K., & Miyaji, T. 2003, ApJ, 598, 886
- Vanden Berk et al. (2001) Vanden Berk, D. E., et al. 2001, AJ, 122, 549
- Wirth et al. (2004) Wirth, G. D., et al. 2004, AJ, 127, 3121
- Wolf et al. (2003) Wolf, C., Wisotzki, L., Borch, A., Dye, S., Kleinheinrich, M., & Meisenheimer, K. 2003, A&A, 408, 499
- Wolf et al. (2004) Wolf, C., et al. 2004, A&A, 421, 913
- Worsley et al. (2004) Worsley, M., Fabian, A., Barcons, X., Mateos, S., Hasinger, G., & Brunner, H. 2004, MNRAS, in press (astro-ph/0404273)
- Yang et al. (2003) Yang, Y., Mushotzky, R. F., Barger, A. J., Cowie, L. L., Sanders, D. B., & Steffen, A. T. 2003, ApJ, 585, L85