SMA 12CO(J = 3 – 2) interferometric observations of the central region of M51
Abstract
We present the first interferometric 12CO(J = 3 – 2) observations (beam size of or 160 pc 65 pc) with the Submillimeter Array (SMA) toward the center of the Seyfert 2 galaxy M51. The image shows a strong concentration at the nucleus and weak emission from the spiral arm to the northwest. The integrated intensity of the central component in 12CO(J = 3 – 2) is almost twice as high as that in 12CO(J = 1 – 0), indicating that the molecular gas within an pc radius of the nucleus is warm ( K) and dense ( cm-3). Similar intensity ratios are seen in shocked regions in our Galaxy, suggesting that these gas properties may be related to AGN or starburst activity. The central component shows a linear velocity gradient ( km s-1 pc-1) perpendicular to the radio continuum jet, similar to that seen in previous observations and interpreted as a circumnuclear molecular disk/torus around the Seyfert 2 nucleus. In addition, we identify a linear velocity gradient (0.7 km s-1 pc-1) along the jet. Judging from the energetics, the velocity gradient can be explained by supernova explosions or energy and momentum transfer from the jet to the molecular gas via interaction, which is consistent with the high intensity ratio.
1 INTRODUCTION
According to the unified scheme as originally suggested by Antonucci & Miller (1985), two types (Types 1 & 2) of Active Galactic Nuclei (AGNs) originate from the same object (a supermassive black hole surrounded by an optically-thick torus) that is viewed at different angles. This hypothesis has stimulated intensive millimeter-wave interferometric observations to search for molecular tori toward AGNs. For example, images of the prototypical Seyfert 2 galaxy NGC 1068 show a pc disk or torus of molecular gas around its AGN, with a rotational axis parallel to the axis of its radio continuum jet (Jackson et al., 1993; Tacconi et al., 1994; Helfer & Blitz, 1995). Sub-arcsecond 12CO(J = 2 – 1) observations suggest that this torus/disk is warped and viewed nearly edge-on at a radius of less than 110 pc (Schinnerer et al., 2000). On the other hand, recent surveys of Seyfert galaxies suggest that the circumnuclear molecular gas has a wide variety of distributions, and does not always exhibit a centrally-peaked component (e.g., Kohno et al., 2001). It may be that only a fraction of AGNs have molecular tori detectable in current observations, making detailed studies of such examples especially important.
M51 (NGC 5194), a grand-design spiral galaxy at a distance D 8.4 Mpc (Feldmeier, Ciardullo, & Jacoby, 1997), has a Type 2 AGN (Ho, Filippenko, & Sargent, 1997). As in the case of NGC 1068, Kohno et al. (1996) showed that the AGN of M51 is surrounded by a pc disk/torus of dense molecular gas with a rotational axis parallel to the axis of the central radio jet (Ford et al., 1985). The estimated column density of the molecular gas exceeds cm-2, which is comparable with the amount of obscuring material inferred from X-ray observations (e.g., Terashima & Wilson, 2001). 13CO and HCN J = 1 – 0 observations suggest that the circumnuclear molecular gas is dense ( cm-3) and warm ( K; Matsushita et al., 1998, 1999). These conditions suggest that the nuclear disk/torus can be better studied in higher-J transitions, such as 12CO J = 3 – 2 (the critical density for this transition is cm-3, and the energy of the J = 3 level corresponds to 33 K ).
Here, we report observations of the central region of M51 with the Submillimeter Array777The Submillimeter Array is a joint project between the Smithsonian Astrophysical Observatory and the Academia Sinica Institute of Astronomy and Astrophysics, and is funded by the Smithsonian Institution and the Academia Sinica. (SMA; Ho, Moran, & Lo, 2004) in the 12CO(J = 3 – 2) line. As anticipated, the central molecular torus/disk emits stronger in the J = 3 – 2 than the J = 1 – 0, but we also detected emission from a spiral arm. We point out that this torus/disk exhibits a velocity gradient not only along its major axis, but also along its minor axis parallel to the radio jet.
2 OBSERVATIONS
The submillimeter-wave aperture synthesis images toward the center of M51 were obtained in the 12CO(J = 3 – 2) line (rest frequency = 345.796 GHz) with the SMA. The observations were made on 2003 June 12 and 14 during the testing and commissioning phase when a total of four 6 m antennas were available. The SMA correlator had a 0.96 GHz bandwidth at the time, and was configured to have a frequency resolution of 0.8125 MHz. We observed Mars and Uranus, respectively, for bandpass and flux calibration, and J1310+323 every 20 minutes for amplitude and phase calibration. The uncertainty in the absolute flux scale is estimated to be 20%.
We calibrated the data using the OVRO software package MIR, which was modified for the SMA. The images were CLEANed using the NRAO software package AIPS, and the resultant angular resolution was (160 pc 65 pc) at a position angle (P.A.) of with natural weighting. We made channel maps with 42 channel binning, which corresponds to a velocity resolution of 29.6 km s-1. The typical rms noise level of the channel maps was 70.4 mJy beam-1, which corresponds to T K. The half-power width of the primary beam at 345 GHz is (1.5 kpc). We did not detect any continuum emission at the rms noise level attained of 18 mJy beam-1.
3 RESULTS
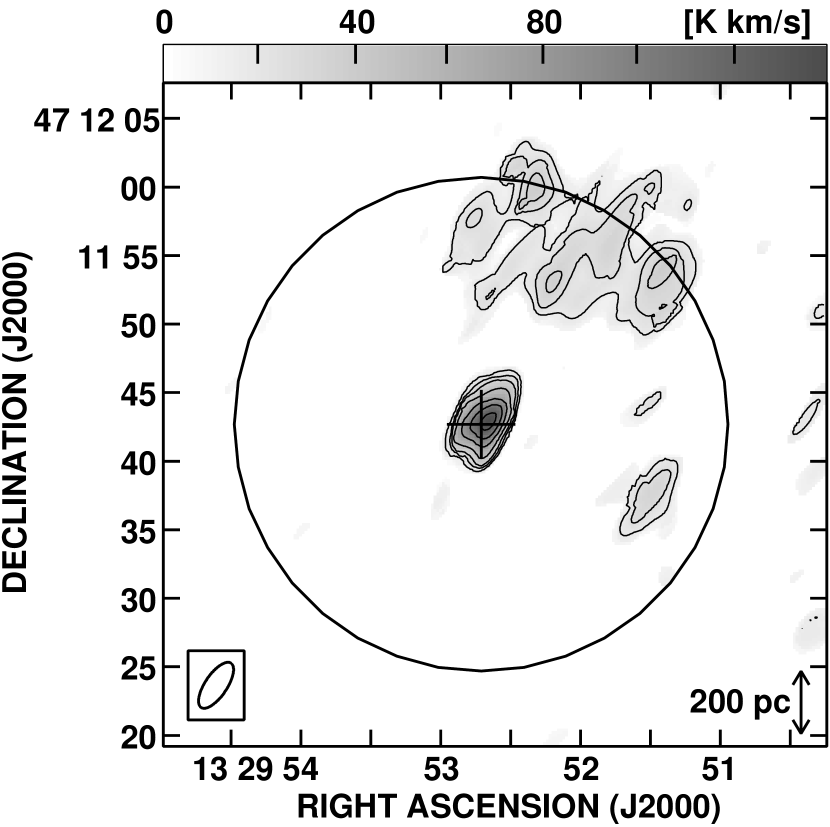
Channel and integrated intensity maps in 12CO(J = 3 – 2) as shown in Figures 1 and 2 show a strong peak at the nucleus at redshifted velocities (with respect to the systemic velocity of 472 km s-1; Scoville & Young, 1983; Tully, 1974). The highest velocity of the compact nuclear emission is km s-1 (as can be seen also in the position-velocity diagram of Fig. 3), comparable with the highest velocity seen in the redshifted wing of the 12CO(J = 3 – 2) spectrum taken with the JCMT (Matsushita et al., 1999). Our maps also show weak emission from the spiral arm to the northwest of the nucleus (hereafter, the northwestern arm) at blueshifted velocities. The spiral arm to the south-east (hereafter, the southeastern arm) was not detected. The previously published single-dish 12CO(J = 3 – 2) maps (Wielebinski et al., 1999) also show the intensity asymmetry, which is stronger emission from the northwestern than from the southeastern arm.
The compact nuclear emission also appears at redshifted velocities in interferometric 12CO(J = 1 – 0) observations by Aalto et al. (1999) and Sakamoto et al. (1999). Similarly, interferometric 12CO(J = 2 – 1) observations by Scoville et al. (1998) also show predominantly redshifted emission, concentrated 1” west of the nucleus, but in addition relatively weak blueshifted emission east of the nucleus (see their Figs. 1 and 2). The integrated intensity of their blueshifted emission is only 18% of that of the redshifted emission, with a deconvolved size for the blueshifted emission of less than . In our map, the redshifted emission was detected at a peak integrated intensity of at a beam size of . Assuming the redshifted and blueshifted emission in J = 3 – 2 has the same intensity ratio as that in J = 2 – 1, the blueshifted emission is expected to have a signal-to-noise ratio of . We rule out the possibility that the systemic velocity of the circumnuclear molecular gas is different from that of the host galaxy (472 km s-1). Interferometric HCN(J = 1 – 0) observations by Kohno et al. (1996) show a compact nuclear component with comparable bright redshifted and blueshifted emission symmetrically placed either side of the nucleus, interpreted as an approximately edge-on rotating disk or torus.
The missing flux in our map was estimated by comparing our data with previous single-dish observations. The flux within the central and region in our 12CO(J = 3 – 2) map (corrected for primary beam attenuation) is 13.8 K km s-1 (228 Jy beam-1 km s-1) and 8.8 K km s-1 (499 Jy beam-1 km s-1) respectively. The single-dish flux are 43.12.0 K km s-1 within (Matsushita et al., 1999) and 477 K km s-1 within (Dumke et al., 2001). We therefore recovered only 32% and 19% of the single-dish flux for the central and respectively, suggesting that there exists extended 12CO(J = 3 – 2) emission in the central region. Indeed, the single-dish 12CO(J = 3 – 2) maps show very similar image with the single-dish J = 2 – 1 or 1 – 0 maps, namely, even J = 3 – 2 emission is rich in extended structures (Wielebinski et al., 1999; Dumke et al., 2001), which support our result. The missing flux of is, however, larger than that in the past extragalactic 12CO(J = 1 – 0) observations of (e.g., Sakamoto et al., 1999). The possibility of calibration errors in single-dish data should be low, because the above values are consistent with each other, and also consistent with the independent HHT ( K km s-1; Mauersberger et al., 1999) and the CSO (48.3 K km s-1 with beam; Bash et al., 1990) observations. An underestimate of the absolute flux in our data is possible, but this would suggest more extreme conditions at the central region of M51 (see the next paragraph and section).
We compared the intensities of the nuclear molecular gas components using our 12CO(J = 3 – 2) data with the interferometric J = 1 – 0 data (Sakamoto et al., 1999). First, we convolved our J = 3 – 2 image to the same resolution as that in J = 1 – 0 (). The J = 3 – 2 and 1 – 0 line intensities at the nucleus averaged over this beam size (170 pc 140 pc) are K km s-1 and K km s-1, respectively (temperatures are in the Rayleigh-Jeans approximation, and the uncertainties are ). The J = 3 – 2 line is therefore stronger than the J = 1 – 0 line, with a 12CO(J = 3 – 2)/(J = 1 – 0) intensity ratio, , of . This line ratio may be a lower limit, as the J = 1 – 0 data have shorter baselines than the J = 3 – 2 data. To remedy this, we truncated the inner -plane of the J = 1 – 0 data to match that in the J = 3 – 2 data, and recomputed the line intensities following the above method. The resultant at the nucleus averaged over this beam size ( or 160 pc 110 pc) is , where the larger uncertainty reflects the noisier J = 1 – 0 image due to the inner truncation. In the following discussion, we adopt of , keeping in mind that this is probably a lower limit.
We made position-velocity (PV) diagrams along and perpendicular to the axis of the radio continuum jet (P.A. of ) from the nucleus (Fig. 3). To compute the magnitude of the velocity gradient, we first searched for the strongest peak (exceeding ) within a 5” radius of the nucleus at each velocity bin (width of 14.8 km s-1) in the PV diagram. We then applied a linear fit to these peaks weighted by their respective intensities. In this way, we inferred a linear velocity gradient perpendicular to the jet axis of km s-1 pc-1, and parallel to the jet axis of km s-1 pc-1. The sense of the velocity gradient perpendicular to the jet (Fig. 3a) is the same as that found in the past interferometric observations (Kohno et al., 1996; Scoville et al., 1998); the magnitude of the velocity gradient of 1.39 km s-1 pc-1 is comparable with that estimated from the interferometric HCN(J = 1 – 0) observations of km s-1 pc-1 (Matsushita et al., 1998). This velocity gradient is attributed to a nearly edge-on rotating molecular disk or torus around the nucleus. The velocity gradient along the jet has not been previously discussed, but can also be seen in the channel/velocity maps in both CO J = 1 – 0 and 2 – 1 (see Fig. 2 of Scoville et al. 1998 and Fig. 1q of Sakamoto et al. 1999). Based on these arguments, we believe the existence of a velocity gradient parallel in addition to that perpendicular to the radio jet to be real, although we note that the circumnuclear emission is poorly resolved and hence the actual magnitude of the velocity gradients may need to be revised when observations at higher angular resolutions become available.
4 DISCUSSION
The within an pc radius of the nucleus of M51 is , more than twice as high as the ratios measured by single-dish telescopes at lower spatial resolutions; line ratios observed with the beam sizes of ( pc) are (Matsushita et al., 1999; Mauersberger et al., 1999; Wielebinski et al., 1999). The physical properties of the circumnuclear molecular gas must therefore be considerably different from that in the disk of the galaxy. We estimated the physical conditions of the circumnuclear molecular gas using the Large-Velocity-Gradient (LVG) approximation (Goldreich & Kwan, 1974; Scoville & Solomon, 1974) assuming a one-zone model. The collision rates for CO in the temperature range K were taken from Flower & Launay (1985) and K from McKee et al. (1982). The velocity gradient is estimated to be about 1.39 km s-1 pc-1 (Sect. 3). This value is consistent with the gradient caused by the internal turbulence ( km s-1 pc-1; for a more detailed discussion, see Matsushita et al., 1998). Using the ‘standard’ relative abundance [12CO]/[H2] , we find the H2 number density cm-3 and the kinetic temperature K, with the uncertainties reflecting the uncertainty in . Even for an order of magnitude lower relative abundance or an order of magnitude higher velocity gradient, this model gives cm-3 and K. We therefore conclude that the circumnuclear molecular gas is denser and warmer than the molecular gas in the galactic disk. This is consistent with the results of the interferometric 13CO and HCN J = 1 – 0 observations, which also suggest dense ( cm-3) and warm ( K) molecular gas based on LVG calculations (Matsushita et al., 1998, 1999).
There are several possible reasons for the rather extreme conditions of the molecular gas. One is interaction with the radio jet. Molecular outflows from star forming regions in our Galaxy show greater than unity (e.g., Richardson et al., 1985; Hirano & Taniguchi, 2001), similar to that in the center of M51. The strongest 12CO(J = 3 – 2) emission in our channel maps comes from north-west of the nucleus (484 km s-1 in Fig 1), and this also is a region with high [N II]/H intensity ratio (). The high [N II]/H ratio suggests that relativistic particle heating is dominant (Cecil, 1988), which suggests an interaction between the jet and molecular gas. Recent high resolution H2O maser observations reveal that the masers are located close to the nucleus, and are possibly associated with the jet (Hagiwara et al., 2001). The velocity range of the H2O masers of km s-1 is similar to that of the redshifted nuclear emission in our data (see Fig. 1 and 3), which also supports the idea that the molecular gas is interacting with or entrained by the jet. Shock/compression by supernova (SN) explosions is another possibility, since shocked molecular gas around SN remnants in our Galaxy also shows high intensity ratios (e.g., Arikawa et al., 1999).
The linear velocity gradient along the jet axis is an interesting phenomenon, and it is worth considering what may cause this gradient. We first calculate the mass, momentum, and kinetic energy of the molecular gas within the velocity range of 515 – 615 km s-1, which is away from the systemic velocity. The CO-to-H2 conversion factor can be estimated using the LVG approximation mentioned above, and the result is cm-2 (K km s-1)-1. The mass is calculated using this conversion factor and the intensities of molecular gas. In each channel map within the velocity range, the velocity of the molecular gas is defined as the velocity difference from the systemic velocity, and we assume that the molecular gas is moving along the line of sight. Thus the estimated values are lower limits. Adding all channel map information, we estimated the mass, momentum, and kinetic energy as M⊙, g cm s-1, and erg, respectively.
Using these values, we discuss the possible causes of the velocity gradient along the jet axis. One is that the molecular gas away from the systemic velocity is entrained by the jet, namely, relativistic particles. The minimum energy of the jet is erg (Crane & van der Hulst, 1992), and the momentum is g cm s-1, if we assume that the velocity of the relativistic particles is 90% of the speed of light. Crane & van der Hulst (1992) estimated the energy of the jet assuming the total energy of the jet plasma is 100 times larger than that of electrons. This number can be larger, but it should be smaller than the mass ratio of proton and electron of about 1800. The actual geometry of the jet and the molecular gas is unclear, but should be similar if molecular gas is entrained by the jet. Therefore the energy of the jet may be similar to that of the molecular gas, but the momentum is several orders of magnitude different. This problem is also seen in the study of young stellar objects, and still under discussion (e.g., Richer et al., 2000). Another possibility is that since the momentum and energy can be transferred from one to another by interaction. If those of the molecular gas along the jet are continuously input by the jet via interaction, the momentum and energy differences between the molecular gas and the jet can be explained. Indeed, the high [N II]/H ratio (an evidence of relativistic heating) and the H2O masers (an evidence of shocked molecular gas) are observed, as mentioned above. These observations support the idea that the energy and momentum of the molecular gas along the jet are transferred from the radio jet via interaction.
There are several possible explanations to create the velocity gradient along the jet without considering interaction with the radio jet. Supernova (SN) explosions can be one of the possible causes, based on the similarity of as mentioned above. However, SNe are needed to explain the energy of the molecular gas, if we assume that one SN releases erg and that the energy transfer efficiency is at most 20% (McCray & Kafatos, 1987). Alternatively, the velocity gradient along the jet may be due to a warped disk around the AGN (e.g., Schinnerer et al., 2000). In this case, not all the gas is on a plane of a molecular gas disk. Thus, even if most of the gas show velocity gradient perpendicular to the jet, some of the gas show velocity gradient along the jet. Future SMA observations with higher spatial resolution will provide more detailed information about the molecular gas around the AGN.
References
- Aalto et al. (1999) Aalto, S., Hüttemeister, S., Scoville, N. Z., & Thaddeus, P. 1999, ApJ, 522, 165
- Antonucci & Miller (1985) Antonucci, R. R. J., & Miller, J. S. 1985, ApJ, 297, 621
- Arikawa et al. (1999) Arikawa, Y., Tatematsu, K., Sekimoto, Y., & Takahashi, T. 1999, PASJ, 51, L7
- Bash et al. (1990) Bash, F., Jaffe, D. T., & Wall, W. F. 1990, in Windows on Galaxies, ed. G. Fabbiano, J. S. Gallagher, & A. Renzini (Dordrecht: Kluwer), 227
- Cecil (1988) Cecil, G. 1988, ApJ, 329, 38
- Crane & van der Hulst (1992) Crane, P. C., & van der Hulst, J. M. 1992, AJ, 103, 1146
- Dumke et al. (2001) Dumke, M., Nieten, Ch., Thuma, G., Wielebinski, R., & Walsh, W. 2001, A&A, 373, 853
- Feldmeier et al. (1997) Feldmeier, J. J., Ciardullo, R., & Jacoby, G. H. 1997, ApJ, 479, 231
- Flower & Launay (1985) Flower, D. R., & Launay, J. M. 1985, MNRAS, 214, 271
- Ford et al. (1985) Ford, H. C., Crane, P. C., Jacoby, G. H., Lawrie, D. G., & van der Hulst, J. M. 1985, ApJ, 293, 132
- Goldreich & Kwan (1974) Goldreich, P., & Kwan, J. 1974, ApJ, 189, 441
- Hagiwara et al. (2001) Hagiwara, Y., Henkel, C., Menten, K. M., & Nakai, N. 2001, ApJ, 560, L37
- Helfer & Blitz (1995) Helfer, T. T., & Blitz, L. 1995, ApJ, 450, 90
- Hirano & Taniguchi (2001) Hirano, N., & Taniguchi, Y. 2001, ApJ, 550, L219
- Ho et al. (1997) Ho, L. C., Filippenko, A. V., & Sargent, W. L. W. 1997, ApJS, 112, 315
- Ho et al. (2004) Ho, P. T. P., Moran, J. M., & Lo, F. 2004, ApJ, in this volume
- Jackson et al. (1993) Jackson, J. M., Paglione, T. A. D., Ishizuki, S., & Nguyen-Q-Rieu 1993, ApJ, 418, L13
- Kohno et al. (1996) Kohno, K., Kawabe, R., Tosaki T., & Okumura S. K. 1996, ApJ, 461, L29
- Kohno et al. (2001) Kohno, K., et al. 2001, in ASP Conf. Ser. 249, The Central Kiloparsec of Starbursts and AGN: The La Palma Connection, ed. J. H. Knapen, J. E. Beckman, I. Shlosman, & T. J. Mahoney (San Francisco: ASP), 672
- Matsushita et al. (1998) Matsushita, S., Kohno, K., Vila-Vilaró, B., Tosaki, T., & Kawabe, R., 1998, ApJ, 495, 267
- Matsushita et al. (1999) Matsushita, S., Kohno, K., Vila-Vilaró, B., Tosaki, T., & Kawabe, R. 1999, Adv. Space Res., 23, 1015
- Mauersberger et al. (1999) Mauersberger, R., Henkel, C., Walsh, W., & Schulz, A. 1999, A&A, 341, 256
- McCray & Kafatos (1987) McCray, R., & Kafatos, M. 1987, ApJ, 317, 190
- McKee et al. (1982) McKee, C. F., Storey, J. W. V., Watson, D. W., & Green, S. 1982, ApJ, 259, 647
- Richardson et al. (1985) Richardson, K. J., White, G. J., Avery, L. W., Lesurf, J. C. G., & Harten, R. H. 1985, ApJ, 290, 637
- Richer et al. (2000) Richer, J. S., Shepherd, D. S., Cabrit, S., Bachiller, R., & Churchwell, E. 2000, in Protostars and Planets IV, ed. V. Mannings, A. P. Boss, & S. S. Russell (Tucson: University of Arizona Press), 867
- Sakamoto et al. (1999) Sakamoto, K., Okumura, S. K., Ishizuki, S., & Scoville, N. Z. 1999, ApJS, 124, 403
- Schinnerer et al. (2000) Schinnerer, E., Eckart, A., Tacconi, L. J., Genzel, R., & Downes, D. 2000, ApJ, 533, 850
- Scoville & Solomon (1974) Scoville, N. Z., & Solomon, P. M. 1974, ApJ, 187, L67
- Scoville & Young (1983) Scoville, N., & Young, J. S. 1983, ApJ, 265, 148
- Scoville et al. (1998) Scoville, N. Z., Yun, M. S., Armus, L., & Ford, H. 1998, ApJ, 493, L63
- Tacconi et al. (1994) Tacconi, L. J., Genzel, R., Bleitz, M., Cameron, M., Harris, A. I., & Madden, S. 1994, ApJ, 426, L77
- Terashima & Wilson (2001) Terashima, Y., & Wilson, A. S. 2001, ApJ, 560, 139
- Tully (1974) Tully, R. B. 1974, ApJS, 27, 437
- Wielebinski et al. (1999) Wielebinski, R., Dumke, M., & Nieten, Ch. 1999, A&A, 347, 634