11email: pere.blay@uv.es
INTEGRAL observations of the peculiar BeX System
SAX J2103.5+4545
We present an INTEGRAL data analysis of the X-ray transient SAX J2103.5+4545 during two outbursts detected in December 2002. The INTEGRAL coordinates and error circle agree with the position of the recently proposed optical counterpart. A power-law plus cut-off model provided a good fit to the 4–150 keV spectrum yielding a photon index of 1.00.1, a cut-off energy keV and a folding energy keV. The X-ray luminosity in the 4-150 keV energy range was found to be 6.0 erg s-1, assuming a distance of 6.5 kpc. This luminosity, together with the derived photon index, indicate that the source is in a bright state. A 354.90.5 second pulse period is measured. This value is significantly smaller than previous measurements, indicating a long-term spin-up episode.
Key Words.:
acretion – binaries:close – stars:Be – pulsars: individuals:SAX J2103.5+4545 – X-rays:binaries1 Introduction
SAX J2103.5+4545 was discovered with BeppoSAX in 1997 when the source underwent a bright outburst (Hulleman et al. hulleman98 (1998)). The source was found to be an X-ray pulsar with a 358.61 second pulse period. An absorbed power-law of index 1.27 was the best fit to the spectra. Two more active phases are reported in the literature, in October 1999 and March 2001 (Baykal et al. 2000, 2002). Pulse arrival time analysis allowed the determination of the orbital parameters of the system. The orbital period was calculated to be 12.680.25 days and the eccentricity 0.40.2 (Baykal et al. 2000). The distance to the source was estimated to be 3 kpc. A bright state, with a luminosity of the order of 1036 erg s-1 and strong orbital modulation, and a faint state, with a luminosity of the order of 1034 erg s-1 and weak orbital modulation, were found (Baykal et al. 2002). Because of its spectral properties and the presence of pulsations, this source was tentatively classified as a high-mass X-ray binary system (HMXRB). The presence of pulsations pointed to a neutron star as the source of the X-ray emission, while its transient nature, showing orbital modulation, suggested a possible BeX system. In a BeX system a strongly magnetized neutron star orbits a Be star. The pulsed X-ray emission results as a consequence of the misalignment of the magnetic axis and the rotation axis and is produced by the accretion of matter, driven by the magnetic field lines, onto the poles of the compact companion of the system. The Be star shows a dense envelope with a disk-like geometry, from which the compact companion accretes matter. Recurrent and moderate ( erg s-1) increases of the X-ray flux modulated with the orbital period are known as type I outbursts.
Recently, Reig et al. (reig04 (2004)) has reported the first optical and infrared observations of this system leading to the identification of the optical counterpart with a B0V star.
The INTErnational Gamma Ray Astrophysics Laboratory (INTEGRAL), is an ESA mission dedicated to high-energy astrophysics. During November-December 2002, within the Performance and Verification phase (PV), the Cygnus X-1 region was intensively monitored with the aim to check the performance of all the instruments and subsystems on board INTEGRAL, and to perform the first background studies. In this work we present an spectral, timing and spatial analysis of the X-ray transient pulsar SAX J2103.5+4545 using observations from this period. Previous related work can be found in Lutovinov et al. (luto03 (2003)) and Del Santo et al. (santo03 (2003)), who showed preliminary results from the first detections of SAX J2103.5+4545 during the PV phase and the first two Galactic Plane scans, respectively. The capabilities of the INTEGRAL mission to perform a detailed study of this kind of sources are shown.
2 Observations and Data Analysis
There are three coded-mask high-energy instruments on board INTEGRAL. The gamma-ray imager (IBIS), is composed of two detector layers: ISGRI on top, which is sensitive to -ray photons between 20 keV and 1 MeV (although the efficiency drops to 50% at 150 keV) and PICsIT, which is optimised to detect higher energy photons (up to 10 MeV). IBIS yields an angular resolution of 12 arc-minutes (Ubertini et al. ibispaper (2003)). SPI is a gamma-ray spectrometer that operates in the energy range 20 keV to 8 MeV (Vedrene et al. spipaper (2003)). JEMX operates in the X-ray range 3–30 keV and it is composed of two twin telescopes with a sensitive geometric area of 500 cm2 per unit (Lund et al. jemxpaper (2003)). An Optical Monitoring Camera (OMC) gives support to the high-energy instruments in the optical V band (Mass-Hese et al. omcpaper (2003)). All the instruments are co-aligned, hence, strictly simultaneous multi-wavelength observations of high-energy sources in a very wide energy range can be performed for the first time. A detailed description of the mission can be found in Winkler et al. (integral (2003)).
From December 8 up to December 29, 2002 (INTEGRAL revolutions 19 to 25), SAX J2103.5+4545 was detected by all instruments on board INTEGRAL. The total on-source time was approximately 500 ks for ISGRI, 730 ks for SPI and 20 ks for JEMX. Images, spectra, and light curves were obtained from these three instruments by using the Integral Science Data Center (ISDC) official software release (OSA version 3.0). An outline of the software analysis methods for INTEGRAL data can be found in Goldwurm et al. (isgrisoft (2003)), Diehl et al. (spisoft (2003)) and Wetergaard et al. (jemxsoft (2003)).
2.1 Imaging
ISGRI detected the source in a total of 280 pointings. Since each pointing had an integration time of around 30 minutes, the total ISGRI observing time was around 500 ks. However, only those detections with a detection level above 8 were included in the analysis. Thus, the total time used in our analysis amounts to about 108 ks.
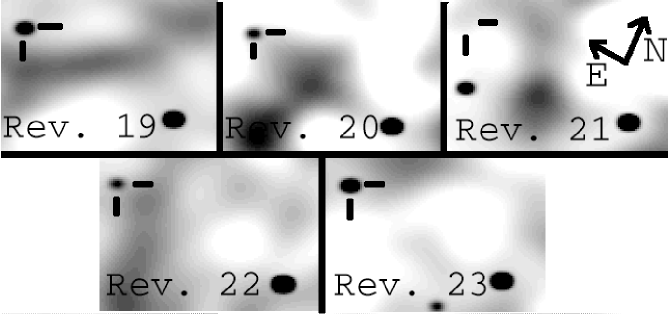
Even though the source was inside the SPI field of view during all December 2002, except during revolution 24 (when the satellite moved into an empty region to perform background measurements), the averaging of data over one revolution, gave significant flux values only for revolutions 19, 20, and 23. Figure 1 depicts the evolution of the significance of the detection of SAX J2103.5+4545 with SPI. Flux maxima are modulated with the orbital period of the system.
JEMX only gives positive detections of the source (even forcing the software to find significant flux at the source position) for 10 pointings, spread over revolutions 23 and 25. This is due to the small field of view of JEMX and the dithering pattern used.
| Instrument | Mean MJD | Mean Flux |
| phot cm-2 s-1 keV-1 | ||
| JEMX | 52630.71 | 0.000880.00002 |
| (5-20keV) | 52636.69 | 0.000210.00001 |
| ISGRI | 52618.73 | 0.000370.00004 |
| (20-40 keV) | 52630.71 | 0.000250.00002 |
| 52636.69 | 0.000090.00001 | |
| SPI | 52618.73 | 0.0000510.000016 |
| (40-100 keV) | 52621.72 | 0.0000050.000019 |
| 52630.71 | 0.0000670.000010 |
| Instrument | Rev. | Energy Range | Flux () | ||
|---|---|---|---|---|---|
| (keV) | erg cm-2 s-1 | powerlaw | bremsstrahlung | ||
| JEMX | 23 | 4-25 | 5.6 | 0.99 | – |
| ISGRI | 19 | 25-70 | 3.5 | 1.3 | 1.2 |
| 23 | 20-150 | 5.3 | 1.1 | 1.1 | |
| 25 | 25-70 | 1.8 | 1.4 | 1.3 | |
| SPI | 19 | 20-150 | 7.4 | 1.1 | – |
| 23 | 20-150 | 8.3 | 1.3 | – |
Best ISGRI position is R.A.=21h 03m 31s and DEC=45o 45’ 00”, with 1 arcmin error radius. Best JEMX source location is R.A.=21h 03m 36.7s and DEC=45o 45’ 02.7”, with an error radius of 30 arcsec. These values represent a considerable improvement with respect to the 2 arcmin uncertainty radius of the BeppoSAX Wide Field Camera.
2.2 Timing
In revolution 19 (December 8-12, 2002, MJD 52617.39–52620.06), ISGRI data showed the peak of an outburst. The source was active during previous revolutions but not detected because it was quite marginal in the field of view (FOV) and the observing mode was set to staring, i.e. pointing continuously to the same direction. The detection of SAX 2103.5+4545 extends to revolution number 20, although the detection level is too low. Another outburst peak was detected at the end of revolution 22 and in revolution number 23 (December 20-23, 2002, MJD 52629.36–52632.05), but this time the source was well inside the FOV. In about a dozen pointings, it was inside the fully coded FOV (FCFOV) of ISGRI. During revolution 24 (December 23-26, 2002, MJD 52632.34-52635.00), the satellite moved again away from the source, and only at the end of this revolution (December 26, 2003) and during revolution 25 (December 26-29, 2002, MJD between 52635.37 and 52638.00), the source appears again. Table 1 gives a summary of the detections for all three high-energy instruments.
The peaks of the two type-I outbursts detected take place in revolution 19 and 23, i.e., they are separated by about 12 days, which corresponds to the value of the orbital period of the system (Fig. 1). The source lies below the detection level of the instruments between outbursts. This is the typical behaviour of a type I outburst seen in most BeX-ray binaries.
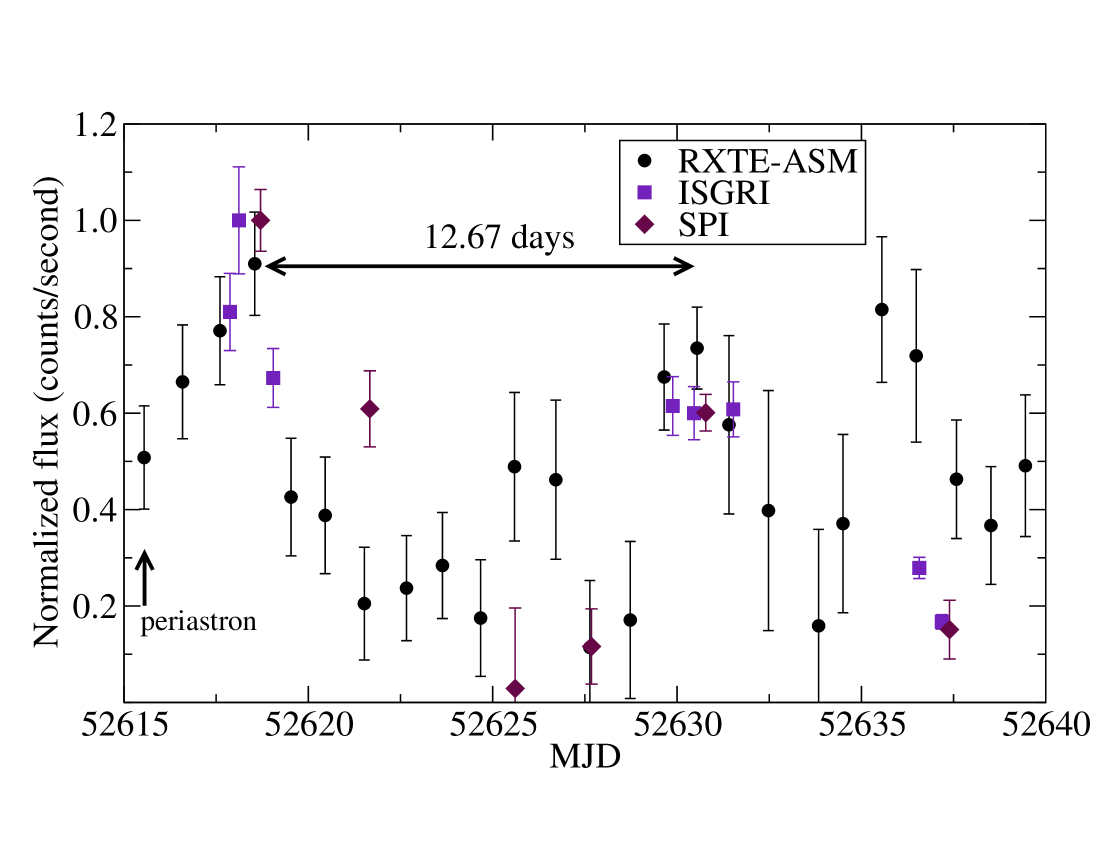
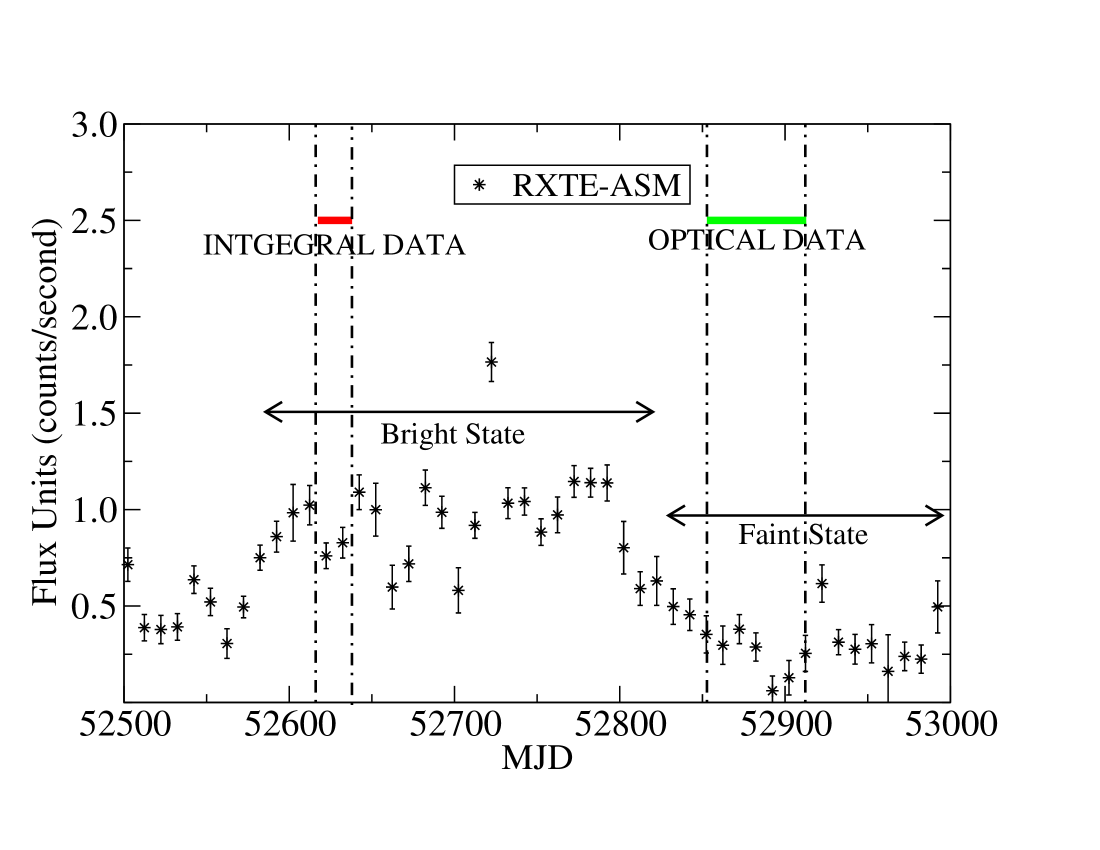
In Fig. 2 one-day averaged fluxes from RXTE-ASM (2-12 keV), ISGRI (20-40 keV) and SPI (20-40 keV) are shown, with normalized units in counts per second. INTEGRAL detections coincide with peaks in the orbital-modulated RXTE-ASM light curve. A careful look at the maxima of the outbursts shows that the second outburst is weaker than the previous one. Note also the emission that takes place after apastron passage (around MJD 52626 and around MJD 52637).
2.3 Pulse Period
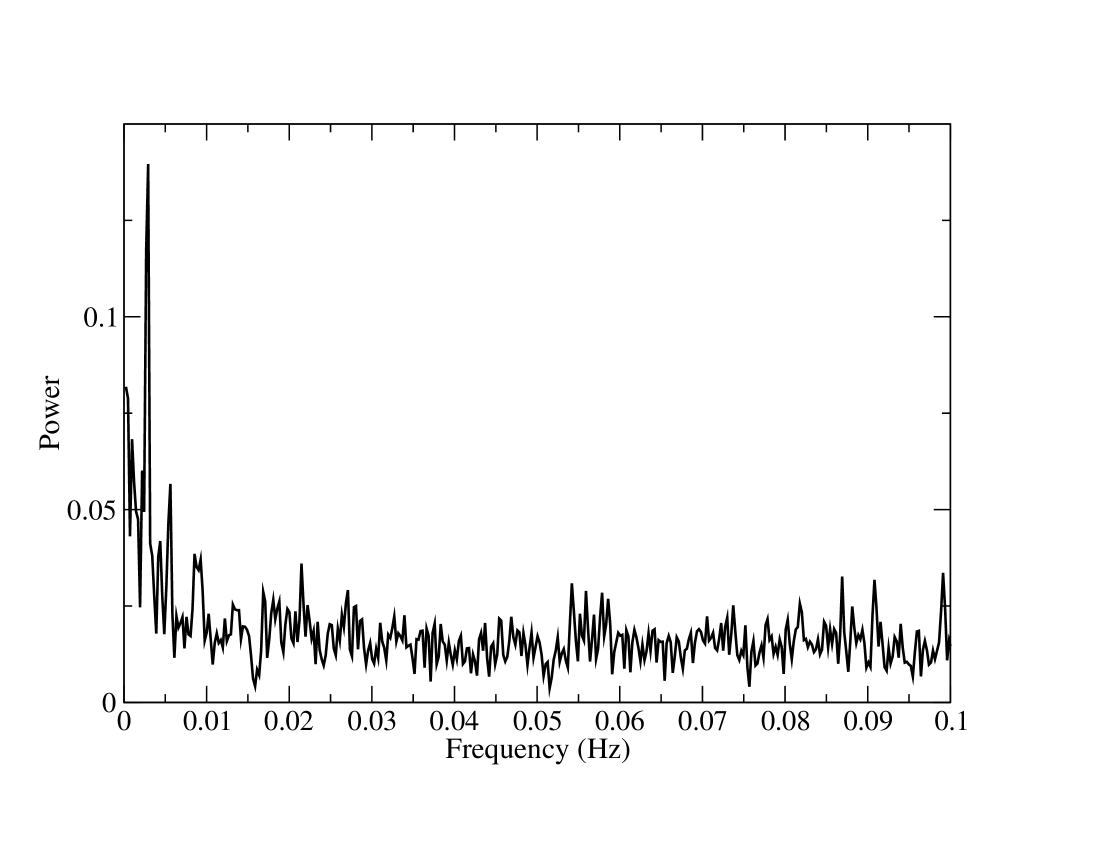
Pulse period analysis is hindered by the low S/N. ISGRI light curve extraction in sub-science window time-scales does not give very good results for off-axis and weak sources. Thus only data from pointings in revolution 23 for which the source was in the FCFOV were used. That makes a total of 17 pointings. An average power spectrum is shown in Fig. 3. This power spectrum was obtained by averaging the Fast Fourier transformed light curves of each pointing. The maximum power is found for the frequency 0.00281 Hz, consistent with the known pulse period of the system.
Once we ensured the presence of pulsations we carried out an epoch folding analysis of the entire 1-s binned light curve of revolution 23. The time-span of these observations is almost 2 days. The resulting pulse period is 354.90.5 seconds, in excellent agreement with that reported by Inam et al. (2004) of 354.794 seconds. Correction to the solar barycentre was not carried out as this correction is much smaller ( s) than the quoted error.
2.4 Spectral Analysis
For ISGRI and JEMX, spectra extraction works on a per-pointing basis, hence all our spectra were extracted for individual pointings and later on summed up to build averages. In addition, ISGRI can provide reliable spectra only when the source is inside the fully coded field of view (FCFOV). For SPI and for a source like SAX J2103.5+4545, to achive a S/N of 10, we need typically about 300 science windows, namely, a total integration time of around 550 ks. With these constraints the number of ”good” spectra reduces to 22 (17 from ISGRI, 1 from SPI and 4 from JEMX). For SPI up to 2 can be obtained (averaged over a revolution and for revolutions 19 and 23) but to increase S/N we have used only the averaged spectrum for all December 2002. A summary of spectra extraction and flux values for a single power-law fit is presented in Table 2.
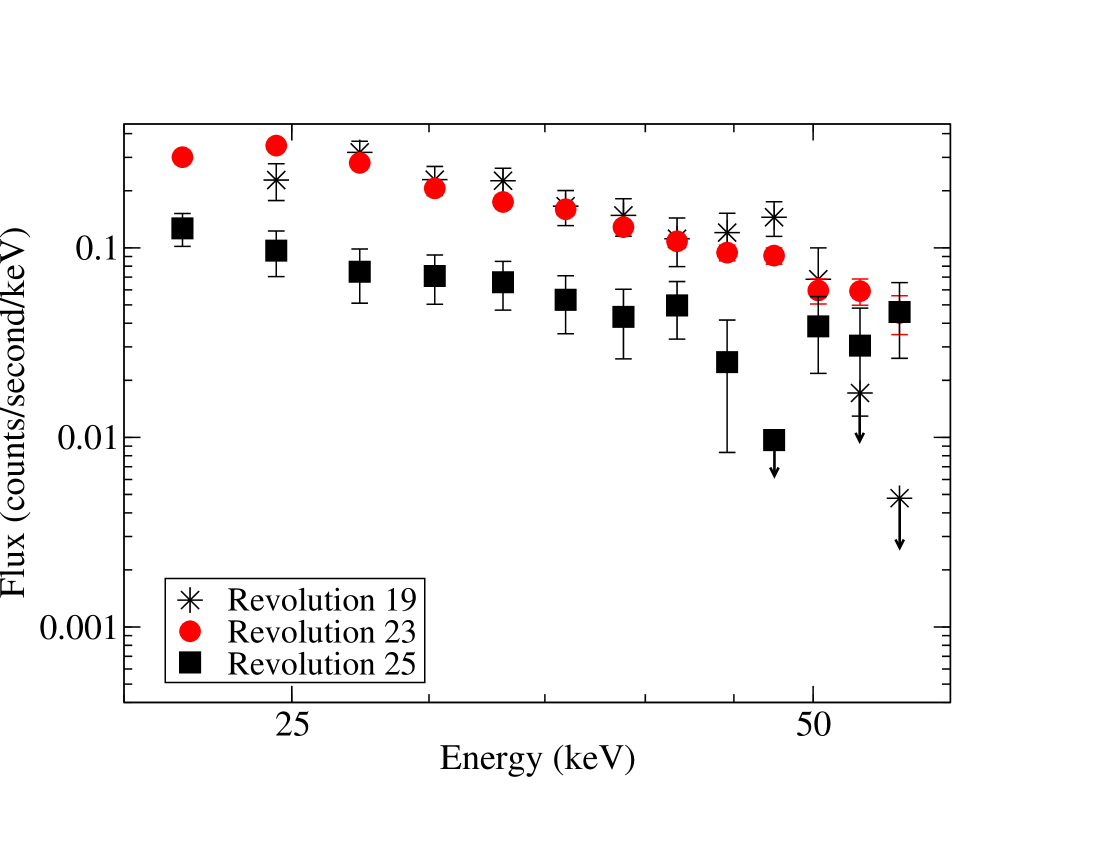
In order to search for medium-term spectral variability (days) we obtained mean ISGRI spectra for revolutions 19, 23 and 25 (see Fig. 4 and Table 2). However, no significant changes were observed, within the errors. These spectra were equally well fitted to a power law and bremsstrahlung models with photon index =2.50.1 and keV, respectively. A decrease in the 20-50 keV flux from revolution 23 to revolution 25 is apparent, though. We also searched for short-term spectral variability (hours) by fitting a power-law model to each pointing of revolution 23 for which we could extract an spectrum (FCFOV observations). The photon spectral index remained constant, within the errors. A mean 20-100 keV flux of 5.310-10 erg cm2 s-1 was found. Table 3 gives the evolution of the power-law index during revolution 23.
| MJD | DOF | ||
|---|---|---|---|
| 52629.91931 | 2.4 0.3 | 1.27 | 25 |
| 52630.13241 | 2.3 0.3 | 1.24 | 25 |
| 52630.15902 | 2.6 0.3 | 0.72 | 25 |
| 52630.18565 | 1.9 0.5 | 1.14 | 25 |
| 52630.21228 | 1.9 0.3 | 1.70 | 25 |
| 52630.37240 | 2.1 0.5 | 1.35 | 25 |
| 52630.39909 | 2.2 0.2 | 1.52 | 25 |
| 52630.42570 | 2.5 0.3 | 0.96 | 25 |
| 52630.45233 | 2.2 0.3 | 0.89 | 25 |
| 52631.25349 | 2.4 0.5 | 1.08 | 25 |
| 52631.46663 | 2.6 0.4 | 1.03 | 25 |
| 52631.49325 | 2.4 0.4 | 0.99 | 25 |
| 52631.51988 | 2.3 0.4 | 1.13 | 25 |
| 52631.54651 | 2.2 0.3 | 1.37 | 25 |
| 52631.79678 | 2.5 0.4 | 1.01 | 25 |
| 52631.82341 | 2.6 0.4 | 1.43 | 25 |
| 52631.85004 | 2.3 0.4 | 1.30 | 25 |
A 4-150 keV combined spectrum of all three instruments is shown in Fig. 5, where the mean ISGRI and JEMX spectra of revolution 23 and the mean SPI spectrum of the entire PV phase are shown. The spectrum was fitted with a power law plus an exponential cut-off, i.e., the photon flux density adopts the form, , where is a normalisation constant. No absorption was included because previous reported values of the hydrogen column density, namely ( cm-2), do not have any effect above 4 keV. The resulting best-fit parameters are , and keV, consistent with previous published values (Baykal et al. 2002; Inam et al. inam04 (2004)). The 4-150 keV X-ray flux, erg cm-2 s-1 and the spectral photon index of indicate that the source was in a bright state.
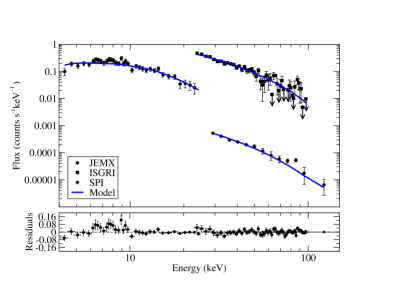
There seems to be some excess emission between 6 and 10 keV. The modest signal-to-noise of the data together with the moderate energy resolution of the instrument prevent us from identifying it as an iron line feature or absorption edge. Nevertheless, although the presence of a iron line has been reported in the past (Baykal et al. baykal02 (2002)) the soft escess is likely to be an artifact of the reduction process. Sources in the outer field of view of JEMX are more strongly affected by vigneting correction and error estimation since they only illuminate a small fraction of the detector. This applies to SAX J2103.5+4545, with the closest angular distance to on-axis position being 2 degrees.
3 Discussion
We have carried out a timing and spectral analysis of the two outbursts that the Be/X-ray binary SAX J2103.5+4545 underwent during the INTEGRAL Performance and Verification phase in December 2002. The excellent imaging capabilities of INTEGRAL allowed us to reduce the uncertainty in the position of the source by a factor of . The INTEGRAL location of the X/-ray source agree with the position of the recently proposed optical counterpart (Reig et al. reig04 (2004)).
No spectral variability on time scales of hours/days has been observed in the INTEGRAL data of SAX J2103.5+4545. In contrast, the source is quite rich in temporal variability. In the short term (seconds), X-ray pulsations with a pulse period of 354.9 s are clearly detected. This value of the pulse period contrasts with that measured by Baykal et al. (2002) of 358.6 s and indicates a long-term spin-up of the neutron star. In this respect, it is illustrative to compare our results with the quasi simultaneous RXTE and XMM observations (and contemporaneous to the INTEGRAL observations) of Inam et al. (2004). They found a pulse period of 354.8 s, in excellent agreement with the one we obtained. Although a short spin-down phase was found by Baykal et al. (2002), it seems that the source has been continuously accelerating by the in-falling accretion of matter. The change in pulse period would be compatible with a continuous spin-up of 2.510-13 Hz s-1 since 1999. Nevertheless, the spin-up is known to be linked to the accretion process, and hence, it is discontinuous and depends on the dynamics of the system, including both the neutron star orbit and the Be star dense envelope. Unlike most BeX systems (Corbet 1986), SAX J2103.5+4545 does not rotate at the equilibrium period (Reig et al. reig04 (2004)).
In the medium term (days), the X-ray behaviour of SAX J2103.5+4545 is characterised by regular increases of the X-ray flux modulated with the orbital period (type I outbursts). The INTEGRAL observations coincided with two of these outbursts. Assuming a distance to the source of 6.50.9 kpc, (Reig et al. reig04 (2004)) the X-ray luminosity in the 4-150 keV energy range, amounts to 6.0 1036 erg s-1, which is typical of type I outbursts in BeX systems. The quoted error in the distance introduces a 30% of relative error in the luminosity determination.
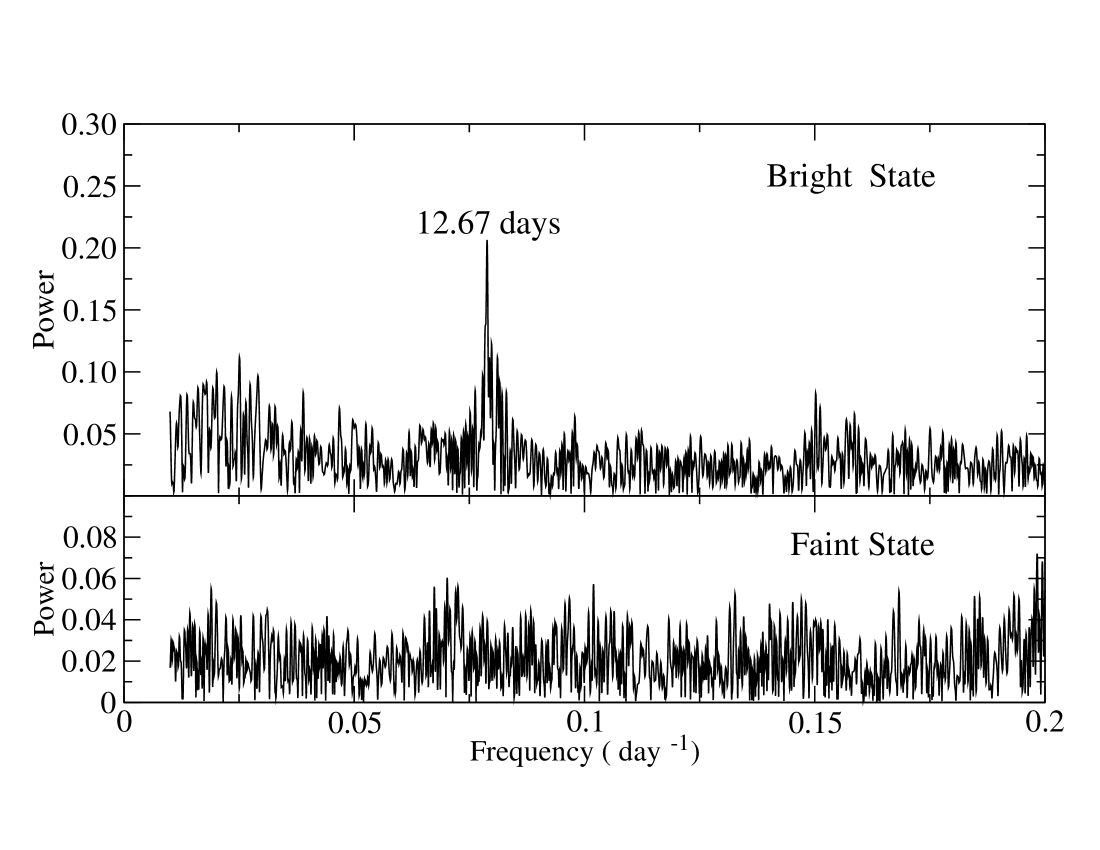
SAX J2103.5+4545 also displays longer-term X-ray variability (months), consisting of low and high-activity X-ray states. Type I outbursts are only seen during bright states (Fig. 6, see also Baykal et al. baykal02 (2002)). Given the short orbital period (12.7 days) the neutron star must exert substantial influence on the evolution of the circumstellar disk. In the optical band, this influence translates into a highly variable H line, exhibiting V/R asymmetry and reversing from emission into absorption on time scales of a few days (Reig et al. 2004). In the X-ray band, the influence of the neutron star on the Be star envelope might be at the origin of the lack of giant (type II) outbursts and the long-term activity. In the framework of the viscous decretion model (Okazaki & Negueruela oka01 (2001)) the scenario would then be as follows. The tidal interaction of the neutron star produces the truncation of the Be star envelope. The truncation radius in SAX J2103.5+4545 would be similar in size to the critical lobe radius at periastron. When the density and/or size of the Be star envelope are large enough, matter fills the critical lobe and is accreted onto the neutron star. The system is in the bright state. One periastron passage is not enough to exhaust the fuel from the disk. However, after several orbits the Be star’s disk weakens, the amount of matter available for accretion decreases and the system enters a faint state. Once the disk recovers the initial conditions the cycle starts again.
Although the number of optical observations of SAX J2103.5+4545 is scarce, the information available indicates a correlation between the long-term optical and X/-ray variability. The optical observations (August and September 2003) reported by Reig et al. (2004) coincided with the transition to an X-ray faint state (see Fig. 7). The H emission was low (equivalent width of ), even the H line appeared in absorption and the optical magnitudes were consistent with little circumstellar reddening. In contrast, the photon spectral index and the X-ray flux obtained from the spectral analysis of the INTEGRAL observations indicate that SAX J2103.5+4545 was in the bright state. Unfortunately, by the time of the INTEGRAL observations, the optical counterpart to SAX J2103.5+4545 was not included in the Optical Monitoring Camera catalogue and no optical data are available.
4 Conclusion
The BeX-ray binary SAX J2103.5+4545 has been observed with INTEGRAL. Our main results are: i) we have reduced to about 30 arc seconds the uncertainty in the position of the system. This new position agrees with the newly discovered optical counterpart, ii) we have obtained the first broad-band spectrum (4-150 keV) of SAX J2103.5+4545. Above 150 keV the flux is comparable to the sensitivity limits of the instruments. Further improvements in the software and/or in the response matrices, or longer exposure times, may allow to reach higher energies, iii) the value of the pulse period indicates a long-term spin-up episode and iv) the high-energy emission correlates with the optical activity state of the system.
Simultaneous observations in the optical/IR and X/-ray bands are needed to understand the connection between the changes in the Be star envelope and the behavior in the high-energy bands. In particular, simultaneous optical/X-ray observations of SAX J2103.5+4545 during the bright state would be very clarifying. This system, with the shortest orbital period known for an accretion-powered BeX binary, represents an excellent laboratory to test the current models for BeX systems.
Acknowledgements.
Part of this work was supported by project number ESP-2002-04124-C03-02 ”INTEGRAL. OPERACIONES C1”. P.R. acknowledges partial support from the programme Ramón y Cajal funded by the Spanish Ministery of Science and Technology and the University of Valencia, under grant ESP2002-04124-C03-01.References
- (1) Baykal, A., Stark, M.J. and Swank, J., 2000, ApJ, 544, L129
- (2) Baykal, A., Stark ,M.J. and Swank, J.,2002, ApJ, 569, 903
- (3) Corbet, R.D. 1986, MNRAS, 220, 1047
- (4) Del Santo, M., Rodriguez, J., Ubertini, P. et al, 2003, A&A, 411, L339
- (5) Diehl, R., Baby, N., Beckmann, V. et al, 2003, A&A, 411, L117
- (6) Goldwurm, A., David,, P., Foschini, L. et al, 2003, A&A, 411, L223
- (7) Gros, A., Goldwurm, A., Cadolle-Bel, M., Goldoni, P., Rodriguez, J., Foschini, L., Del Santo, M., Blay, P., 2003, A&A, 411, L179
- (8) Hulleman, F., in ’t Zand, J.J.M. and Heise, J., 1998, A&A, 337, L25
- (9) Inam, S.C., Baykal, A., Swank, J., and Stark, M.J. 2004, astro-ph/0402221
- (10) Lund, N., Budtz-J rgensen, C., Westergaard, N. J. et al, 2003, A&A, 411, L231
- (11) Lutovinov, A., Molkov, S. and Revnistev, M., 2003, AstL, 29, 713
- (12) Mas-Hesse, J.M., Gim nez, A., Culhane, J. L. et al, 2003 A&A, 411, L261
- (13) Okazaki, A. T. and Negueruela, I., 2001, A&A, 377, 161
- (14) Reig P. and Mavromatakis F., 2003, ATEL, 173
- (15) Reig, P., Negueruela, I., Fabregat, J., Chato, R., Blay, P. and Mavromatakis, F., 2004, A&A, in press.
- (16) Skinner, G. and Connell, P., 2003, A&A, 411, L123
- (17) Ubertini, P., Lebrun ,F., Di Cocco, G. et al, 2003, A&A, 411, L131
- (18) Vedrenne, G., Roques, J.-P., Sch nfelder, V. et al, 2003, A&A, 411, L63
- (19) Westergaard, N.J., Kretschmar, P., Oxborrow, C. A. et al, 2003, A&A, 411, L257
- (20) Winkler, C., Courvoisier, T. J.-L., Di Cocco, G. et al, 2003, A&A, 411, L1