Radio Emission from Early-type Galaxies and CMB Experiments
Abstract
We investigate the possible contribution from the emission of accretion flows around supermassive black holes in early type galaxies to current measurements of the Cosmic Microwave Background (CMB) at radio frequencies. We consider a range of luminosities suggested by targeted radio observations and accretion models and compute the residual contribution of these sources to the spectrum and bispectrum of the observed CMB maps. As for high–resolution CMB experiments, we find that the unresolved component of these sources could make up to of the observed CBI and BIMA power spectrum at . As a consequence, the inferred value could be biased high by up to . As for all sky experiments, we find that the contribution of accretion-flow sources to the WMAP bispectrum is at the 2-3 per cent level at most. At the flux limit that Planck will achieve, however, these sources may contribute up to 15 per cent of the bispectrum in the 60–100 GHz frequency range. Moreover, Planck should detect hundreds of these sources in the 30–300 GHz frequency window. These detections, possibly coupled with galaxy type confirmation from optical surveys, will allow number counts to put tighter constraints on early-type galaxies radio luminosity and accretion flows properties. These sources may also contribute up to the 30 per cent level to the residual radio sources power spectrum in future high–resolution SZ surveys (like ACT or APEX) reaching mJy flux limits.
keywords:
accretion – cosmology: cosmic microwave background – galaxies: elliptical – galaxies:nuclei – infrared:galaxies1 Introduction
Cosmic microwave background (CMB) experiments have been able to measure cosmological parameters to an unprecedented level of accuracy (Spergel et al. 2003). For this to be possible, however, the contribution to the primary signals must be disentangled from other astrophysical emissions at the observed frequencies. Therefore, foreground identification and removal is fundamental.
One of the major sources of contamination at small scales is constituted by point sources, and several studies have been carried out to estimate their contribution to CMB anisotropy experiments (Toffolatti et al. 1998; White & Majumdar 2004; Argüeso, González-Nuevo & Toffolatti 2003). Generally, source counts are determined in the radio band, through deep VLA surveys down to Jy levels at 1.41, 4.86 and 8.44 GHz. These counts are then extrapolated to the higher range of frequencies relevant for CMB experiments (Toffolatti et al. 1998; Toffolatti & et al. 1999; De Zotti et al. 2000; Gawiser & Smoot 1997). This extrapolation provides a reasonable estimate of the contribution from the “steep” and “flat” spectrum sources (with , and , such as compact radio galaxies and radio loud quasars), but it strongly under-represents an important contribution from a class of sources with inverted spectra (; e.g. De Zotti et al. 2000).
Inverted-spectrum sources, such as GHz peaked sources (GPS; O’Dea (1998); Guerra, Haarsma & Partridge (1998)), bright (flux Jy) and rare, are generally associated with bright active galaxies or quasars at high redshifts. Their contribution to the CMB experiments was studied by De Zotti et al. (2000). These sources, being bright and rare, are easily identified in the CMB maps, and removed.
There is however another class of inverted-spectrum sources, much fainter (flux mJy) but much more common, associated with emission from the nuclei of nearby galaxies. Radio continuum surveys (at 8 GHz) of elliptical and S0 galaxies have shown that the sources in radio–quiet galaxies tend to be extended but with a compact component with relatively flat or slowly rising radio spectra. Recent VLA studies at high radio frequencies (up to 43 GHz), although carried out only on a limited sample of objects, have shown that all of the observed compact cores have spectra rising up to GHz. These sources of radio emission are believed to result from the process of accretion of gas into the supermassive black holes likely ubiquitous in the centers of galaxies (Magorrian et al. 1998).
A popular model to describe the broadband spectral energy distribution from the accretion flows around these supermassive black holes is the advection-dominated accretion flow (ADAF) model (Rees et al. 1982; Narayan & Yi 1994). Within the context of this model, the foreground contribution to the CMB experiments, and in particular to the Planck Surveyor, was studied by Perna & Di Matteo (2000). In particular, they estimated the contribution of these sources both within the “standard” ADAF model, where the accretion rate is independent of the radius of the flow (implying that all the mass is accreted into the black hole (BH)), and within the context of the ADAF model with winds, where not all the mass is accreted by the BH, but some is lost into winds (Blandford & Begelman 1999; Narayan & Yi 1995a). In this case the radio emission is suppressed because winds remove mass from the inner regions of the flow, where the synchrotron radiation giving rise to the radio emission is produced. Detailed modeling has only been possible for a handful of sources so far, as it requires multi wavelength, high-resolution data. Observations have yielded somewhat mixed evidence: in some cases the emission is consistent with ADAFs with winds (i.e. suppressed radio emission; Di Matteo et al. 2000), while in others it is higher than the standard model with no wind (Di Matteo et al. 2001), probably because of extra power output by jets associated with the accretion flow.
While studies of this class of sources of radio emission so far have been limited by low number statistics, Perna & Di Matteo (2000) showed that CMB experiments with the future Planck surveyor mission can provide interesting constraints from a statistical point of view. At the same time, these sources can be an important contaminant to CMB maps.
In this paper, we compute the contribution of the emission from accretion flows in early-type galaxies to the current signal of CBI, BIMA, WMAP. We show that the signal from these unresolved sources is able to influence current limits on the power spectrum normalization . Finally, we make predictions on the power spectrum from residual sources in future high–resolution CMB experiments and on the bispectrum in all–sky experiments like Planck and WMAP.
2 Microwave emission from accretion flows in elliptical galaxies
As discussed above, there is evidence for the existence of supermassive massive black holes (BHs) at the center of galaxies. Inferred black hole masses appear to be proportional to the mass of the bulge component of their host galaxies. Therefore, central BH masses are expected to be much larger in elliptical than in spiral galaxies. Independently of the details of the model for the production of the radio/microwave emission, this radiation is expected to be some fraction of the accretion energy, which is proportional to the mass of the black hole. Therefore the contribution from the nuclei of the ellipticals is expected to dominate that from the nuclei of the spirals, which we neglect here. Similarly, among the population of ellipticals, the main contribution derives from the most massive galaxies. To make a conservative estimate of the emission from these galaxies, we consider only the bright end of the distribution, with . Studying a sample of nearly 9000 ellipticals in the Sloan Digital Sky Survey, Bernardi et al. (2003) estimated a comoving number density Mpc-3. The redshift evolution of their sample appeared consistent with the law (), found by Lin et al. (1999) in their sample of galaxies drawn from the Canadian Network for Observational Cosmology Field Galaxy Redshift Survey.
For a cosmological population of sources with intrinsic luminosity function and redshift evolution , the differential number counts are given by
| (1) |
where is the comoving volume. In a flat cosmology with a cosmological constant it is given by
| (2) |
where is the comoving distance,
| (3) |
We assume a cosmological model with , and km s-1 Mpc-1(Spergel et al. 2003). In Eq.(1), is derived by inverting the relation , where is the luminosity distance.
We will consider two models for the emission from accretion flows in
early-type galaxies (see figure
1): while these are computed on the basis of a
specific accretion model, they can be considered generally representative of the
typical range in luminosity and spectral shape that characterize these
sources. However, we should emphasize that, given the small sample of
observations so far, and the uncertainties in the specific model parameters
discussed below, our conclusions should be taken as indicative rather
than general and final. Tighter constraints (which will leave less
space for parameter variations) will be obtained with future, more
sensitive CMB experiments together with a detailed, individual study
of a larger sample of sources.
a) Model A:
This is the standard ADAF model (Narayan & Yi 1994),
where the accretion rate is a constant function of the radius within
the flow. In this model, the radio/microwave emission is due to
synchrotron emission from the inner regions of the accretion flow.
The emission at the self-absorbed synchrotron peak scales as , where (Narayan &
Yi 1995a); is the electron temperature, and the magnetic
field strength. The ADAF model depends on a number of microphysical
parameters (i.e. the flow viscosity, the ratio of gas to magnetic
pressure, the adiabatic index of the fluid, the fraction of turbulent
energy which goes into heating the electrons) as well as geometrical
parameters (i.e. the radial extent of the flow, the possible
transition from a hot state to a cool disk at some radius), as well as
on the BH mass and on the accretion rate . Whereas some constraints on
these parameters can be derived by multiwavelength observations and
broadband modeling of a given source, they cannot be well constrained
a priori and they can in principle vary from source to source.
Therefore, in a statistical study like ours, we can only adopt
“typical” values for all these parameters. In particular,
we use the ones adopted by Di
Matteo et al. (2000) for a BH of mass (as
typical of the bright end of the galaxy luminosity function that we
are considering here) and for an accretion rate in
Eddington units (note that the transition to an ADAF is believed (Narayan & Yi 1995b) to
occur at rates below ,
being the viscosity parameter of the flow).
The luminosity predicted by this model is shown by the upper line in
Figure 1. To allow for a spread in BH masses, accretion rates,
and parameters of the
flow around this typical value, we take the luminosity function
to be a log-gaussian with mean given by the curve displayed
in the figure, and a standard deviation . We adopt
; the predicted number counts are very little dependent
on the precise value of .
b) Model B:
The luminosity function for this model is calibrated on the sample of those sources for which the broadband energy distribution was best fit with an ADAF model with winds (Di Matteo et al. 2000). At frequencies in the range 30–100 GHz, the mean luminosity is roughly constant, and on the order of erg s-1 Hz-1 (see the dashed region in figure 1 which encompasses the range of those observations). Hence, for this model we assume the mean luminosity to be constant over the considered frequency range and take the luminosity function to be a log-gaussian with mean given by the above value, and a standard deviation .

Figure 2 shows the number counts predicted by the sources in Model A and B. These sources are typically fainter than the radio sources presented in Toffolatti et al. (1998), and therefore the number counts are dominated by the local population. As a consequence, the slope in figure 2 is very close to Euclidean down to low flux levels. Being faint, these sources are not likely to be individually detected. However, because of the steepness of their number counts, they may contribute significantly to the residual signal in CMB experiments, where their relevance with respect to the Toffolatti et al. (1998) type of sources becomes increasingly important as the detection flux limit of the survey is reduced. Moreover, because of the radio spectrum of these sources is inverted, they are less likely to be found at low frequencies, where most point sources catalogs are compiled, and therefore may be neglected in present data analysis. In the following, we will estimate the contribution of these accretion flow sources to current CMB experiments, and explore the consequences that the emission from these (mostly unresolved) point sources can have on the determination of the matter power spectrum normalization from these experiments.

3 Point sources and CMB experiments
Point sources are detected in CMB maps as high point-like fluctuations above the mean. Their detection depends on instrumental properties such as the beam size and the noise level, as well as on the characteristics of the competing sky signals. Assuming that all sources above a given flux limit are subtracted from the data, residual sources still contribute to the statistics of the map (Pierpaoli 2003). For Poisson–distributed sources, the residual power spectrum and bispectrum are constant for all scales and read:
| (4) |
| (5) |
where (with ) and .
The bispectrum is sometimes quoted as the adimensional quantity . If the sources are clustered, the power spectrum is increased by:
| (6) |
where the intensity and the are the Legendre expansion of the angular correlation function:
| (7) |
In order to compute the clustering term, we use the recent determination of the SDSS red sample angular correlation function (Budavári et al. 2003). This estimate should provide a conservative limit to the clustering contribution, since the red sample contains more galaxies than just ellipticals, and ellipticals are more clustered than other sources.
Finally, given a particular experiment it is useful to quote the (non–clustered) power spectrum as the noise per pixel caused by the residual point sources as:
| (8) |
where is the pixel dimension, typically assumed as the FWHM of the beam.
In the following, we will estimate the contribution of these sources to the current WMAP, CBI and BIMA signal.
The WMAP spectrum is clearly dominated by the primary CMB and, given the high flux cut (Jy), the observed bispectrum is likely to be dominated by other radio sources more luminous than elliptical galaxies at these frequencies. WMAP, however, presents the advantage of being an all–sky survey. Number counts of point sources which are confirmed to be elliptical galaxies by mean of other (optical and infrared) observations may give a hint on the typical radio emission of early–type galaxies.
CBI and BIMA, on the contrary, observed a small area of sky with high resolution and sensitivity. These experiments detected the CMB power spectrum at very high ’s, where the primary CMB is weak and the point source contribution may be dominant. Therefore, the contribution of the emission from accretion flows in early-type galaxies may be significant to the observed CBI and BIMA power spectrum. We will estimate the importance of this contribution and its consequences on the derived cosmological parameter estimation.
3.1 WMAP detected sources
The WMAP experiment (Bennett et al. 2003) detected 208 point sources with a flux in the V band. Among those sources, 29 have been identified as galaxies while 5 have no identification and could therefore be galaxies (Trushkin 2003). Hence at most there is a total of 34 sources which are candidate for harboring a source of emission from an accretion flow. This classification, however, does not distinguish elliptical galaxies from spirals. In order to determine how many of the WMAP sources could be elliptical emitting according to the model described here, we proceeded as follows. We selected the sources in Trushkin (2003) according to the following two criteria: i) we eliminated sources with measured redshift greater than , because if they were ellipticals emitting according to our models they would have an observed flux lower than 1 Jy; ii) we kept only sources with flat or inverted spectra. We then visually inspected the remaining sources in the 2MASS database, in order to select those which appear to be elliptical galaxies. We only found two sources of this kind. A comparison with the SDSS data (which currently covers about 10 per cent of the sky) finds only one elliptical galaxy among the WMAP sources. A total number of 2–3 ellipticals in the WMAP sample of detected sources seems a conservative estimate.
Model A predicts about 4.5 (8) sources above a flux Jy at 44 GHz, while model B would predict 0.15 (0.25) sources for the same flux cut. These predictions seem to favour model A, model B predictions being 4–6 away from observations. Current data therefore appears to suggest that the bulk of the elliptical galaxy population emits at 40 GHz more than the erg s-1 Hz-1 level assumed in model B.
Planck should reduce the source detection threshold of at least one order of magnitude with respect to WMAP, possibly allowing for the detections of hundreds of these sources. Moreover, SDSS at completion should observe about one quarter of the sky. By comparing these two data sets it will be possible to infer more conclusive statements on accretion models purely by means of radio number counts.
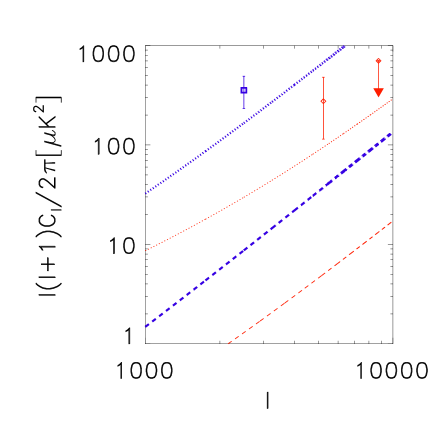
3.2 Current limits from CBI and BIMA
Recent results on the CMB power spectrum from high resolution CMB experiments around 30 GHz like CBI and BIMA have shown a rise in the high ’s which is interpreted as signature of the SZ power spectrum from galaxy clusters (Komatsu & Seljak 2002; Bond 2002). This interpretation allows to infer a value of the matter power spectrum (Readhead 2004). Residual radio point sources, however, are also likely to contribute to the observed power spectrum. We argue here that accretion flow sources may present a sizable contribution to the CBI and BIMA power spectra.
In CBI and BIMA individual point sources have been subtracted from the data when identified by means of other observations of the same sky area at much lower frequencies.
In the CBI case, point sources above the flux limit of 3.4 mJy in the NRAO VLA Sky Survey (NVSS) at 1.4 GHz have been subtracted from the data. A residual point source signal, compatible with the observed point source population above the flux cut, has been modeled in the data analysis. The population of sources considered in our work, however, is not likely to be well represented by the detected one, because our sources are typically very faint at such low frequencies. As a result, the observed population may be rather biased toward flat or falling spectra sources. The observed population, in fact, shows a less steep () than the one appropriate for the point sources considered here ( ), and a mean spectral index , while our sources have in the relevant frequency range of 1-10 GHz. We extrapolate the NVSS flux limit to 30 GHz using a conservative spectral index , and obtain for CBI mJy as a nominal flux limit for our sources.
In the case of BIMA, sources are detected with the VLA at 4.8 GHz with a flux limit of 150-175 Jy (Dawson et al. 2002). If radio sources have a flat or falling spectrum, then this procedure ensures the subtraction of sources at 30 GHz down to a very low flux limit. For this reason, the BIMA data analysis did not consider a possible contribution from residual point sources.
Because accretion flow sources present an inverted spectrum, we do expect a residual signal from them below the flux limit at 30 GHz. Considering the conservative case of a spectral index of 0.5, such limit is
Given the considerations above, we assumed that all sources above the mentioned flux limits at 30 GHz have been subtracted from CBI and BIMA data, but the residual signal has not been taken into account. We computed the power spectrum from residual point sources given the above mentioned flux limits (relative to the two experiments) and the two different models. We also took into account the sources correlation which contribute about 15–20 per cent. We then compared the residual power spectra with the CBI band power for and the BIMA ones at . Our results are presented in fig. 3. We find that, in the case of the emission at the level of model B for all sources, their contribution would be 2.4% for CBI, and 2.5% for BIMA while, in the case of model A the contribution would be 47% to CBI and 46% to BIMA. Since , in the latter case the unresolved signal from these sources could produce a bias of in the current determination of with this method (Komatsu & Seljak 2002). The real value of is still a very controversial issue, but the one inferred from SZ power spectrum is certainly in the high end of the considered range. A lower value would be in better agreement with determinations from cluster abundance (Pierpaoli et al. 2003), the WMAP results (Spergel et al. 2003) and some weak lensing experiments (Heymans et al. 2004).
| (GHz) | (Jy) | |||
|---|---|---|---|---|
| 30 | 1 | 7.0e-25 | 3.9e-26 | 6.4e-23 |
| 30 | 0.01 | 6.9e-28 | 3.9e-29 | 1.4e-26 |
| 30 | 0.001 | 1.9e-29 | 1.2e-30 | NA |
| 44 | 1 | 1.2e-25 | 4.3e-27 | 7.2e-24 |
| 44 | 0.01 | 1.1e-28 | 4.3e-30 | 1.4e-27 |
| 44 | 0.001 | 3.1e-30 | 1.3e-31 | NA |
| 100 | 1 | 3.2e-27 | 5.7e-29 | 9e-26 |
| 100 | 0.01 | 3.0e-30 | 5.7e-32 | 1.8e-29 |
| 100 | 0.001 | 7.5e-32 | 1.7e-33 | NA |
| 350 | 1 | 4.5e-27 | 2.8e-29 | 7e-26 |
| 350 | 0.01 | 3.9e-30 | 2.8e-32 | 4.e-28 |
| 350 | 0.001 | 8.3e-32 | 8.4e-34 | NA |
3.3 Residual signal in all–sky experiments
In this section we discuss the residual contribution from accretion flow sources to the bispectrum of WMAP and Planck.
In table 1 we report the bispectrum produced by residual sources for different flux cuts and normalizations, compared with the one implied by more standard radio and infrared (IR) population as in the model by Toffolatti et al. (1998) (see also Argüeso et al. (2003)) 111It should be kept in mind that these quoted values have been reduced by a factor 0.8 in order to match the WMAP observations (Argueso et al. 2003).. WMAP measured the bispectrum in Q (40 GHz) and V (61 GHz) bands, and found and respectively. For a nominal flux cut at accretion flow sources would imply in the V band for model A (B) and in the Q band, so they contribute at most at the ***25 per cent level in the V band, and 2 per cent in the Q band. Given the WMAP bispectrum errors bars, these numbers do not allows us to draw constraints on accretion flow sources from these data. The current flux limit from WMAP is so high ( Jy) that the contribution from these sources is sub dominant with respect to what is inferred by more standard radio/IR sources. The observed bispectrum in the current WMAP data is consistent with a residual signal produced by the population of point sources observed at fluxes Jy (Komatsu et al. 2003), which is not dominated by accretion flow sources, rather by quasars and active galaxies as in the Toffolatti et al. (1998) model (see fig. 2).
Because of the high sensitivity of Planck, point sources are expected to be detected down to a flux between 0.01 and 0.1 Jy. In table 1 we show the contribution of accretion flow sources to the Planck bispectrum. Their contribution at 100 GHz can be the one from the Toffolatti et al. (1998) radio/IR point sources population as computed in Argüeso et al. (2003). In addition, Planck will observe over a broad frequency range, allowing a better description of point sources properties and possible discrimination between accretion-flow sources and other sources.
3.4 Future high–resolution SZ surveys
Future high resolution SZ surveys in the 150–350 frequency range like ACT or APEX will allow to detect point sources down to a flux limit mJy. Because this point source population presents an emission that extends to very high frequencies (see fig. 1), it may give a significant contribution to the observed signal in future SZ surveys. Here we report the estimated pixel noise produced by residual sources for different flux cut and for a fiducial pixel of . Again we report our results for the two models shown in Figure 1. These two figures should roughly provide a lower and upper limit to the contribution coming from elliptical galaxies. Our results are summarized in table 2 together with the estimates of White & Majumdar (2004) for the population of currently observed radio sources. For the sake of comparison, here we neglected the contribution of clustering. Accretion flow sources may produce a noise that is % of the one produced by the population of observed sources.
At the same frequencies, infrared sources are currently predicted to produce a slightly higher signal than radio sources (White & Majumdar 2004). These IR estimates, however, may be biased high if part of the signal is due to lensing effect. Future experiments like SCUBA–2 and the Herschel Space Observatory will help in better characterizing the IR population.
| (GHz) | ||||
|---|---|---|---|---|
| 150 | 1 | 1.3 | 0.3 | 5 (4) |
| 150 | 5 | 2.2 | 0.5 | 9 (7) |
| 150 | 10 | 2.8 | 0.6 | 12 (9) |
| 150 | 50 | 2.9 | 0.9 | 20 (16) |
| 220 | 1 | 1.1 | 0.3 | 4 (3) |
| 220 | 5 | 2.0 | 0.4 | 7 (5) |
| 220 | 10 | 2.5 | 0.5 | 9 (7) |
| 220 | 50 | 2.6 | 0.7 | 16 (12) |
4 Conclusions
We investigated the possible contribution to current and future CMB experiments from the accretion flows around supermassive black holes believed to harbor the centers of galaxies. These sources are typically faint and numerous, therefore they are likely to be observed as a residual signal in CMB experiments. A comparison with the number counts of WMAP detected sources (and identified as elliptical galaxies) indicates that the bulk of the emission is probably higher that the erg/s/Hz assumed in our emission model B.
We have showed that the residual signal produced by the emission from these unresolved sources could significantly contribute to the CBI and BIMA observed power spectrum. More specifically, these sources could make up to of the observed signal at , therefore reducing the inferred value of by . As for all sky experiments, we showed that the residual signal in the WMAP maps with the current flux limit is likely to be dominated by other kinds of sources, with accretion-flow sources contributing at the 2-3 per cent level at most.
Planck will have a better sensitivity than WMAP and will allow to detect fainter sources reducing the flux limit by at least a factor of 10 and possibly detecting hundreds of early–type galaxies. We showed that the residual signal from accretion-flow sources may contribute up to the 15% to the bispectrum around 100 GHz. Unlike other radio sources, these sources typically show an inverted spectrum and are quite bright also in the infrared, up to about 300 GHz. This feature may facilitate their detection and discrimination with respect to the standard radio and infrared sources, especially with Planck that offers the potential of an all–sky experiment with a broad frequency coverage. A characterization of the Plank sources with the SDSS will allow to clearly distinguish between elliptical galaxies and other kinds of sources, allowing to put constraints on accretion flow models with radio number counts.
Future high–resolution CMB experiments like ACT and APEX operating in the 150–350 GHz range may also be affected by the emission from accretion flows in galaxies. The residual power spectrum is predicted to be about 25-30% of the one expected for currently observed radio point sources. At these frequencies, however, IR sources are likely to be dominant, unless their number count is biased high due to lensing effects. Future surveys with instruments like SCUBA–2 and Herschel will help in clarifying this issue.
ACKNOWLEDGMENTS
EP is an NSF-ADVANCE fellow (NSF-0340648) also supported by NASA grant NAG5-11489. The authors wish to thank Luigi Toffolatti for providing his data on number counts; Colin Borys, Francisco Argueso and Tiziana Di Matteo, Idit Zehavi and Tamas Budavari, Zeljko Ivezic for useful conversations; Luigi Danese and Gianfranco De Zotti for useful feedback on the manuscript.
References
- Argüeso, González-Nuevo, & Toffolatti (2003) Argüeso F., González-Nuevo J., Toffolatti L., 2003, ApJ, 598, 86
- Bennett, Hill, Hinshaw, Nolta, Odegard, Page, Spergel, Weiland, Wright, Halpern, Jarosik, Kogut, Limon, Meyer, Tucker, & Wollack (2003) Bennett C. L., Hill R. S., Hinshaw G., Nolta M. R., Odegard N., Page L., Spergel D. N., Weiland J. L., et al., 2003, ApJs, 148, 97
- Bernardi, Sheth, Annis, Burles, Eisenstein, Finkbeiner, Hogg, Lupton, Schlegel, SubbaRao, Bahcall, Blakeslee, Brinkmann, Castander, Connolly, Csabai, Doi, Fukugita, Frieman, Heckman, Hennessy, Ivezić, Knapp, Lamb, McKay, Munn, Nichol, Okamura, Schneider, Thakar, & York (2003) Bernardi M., Sheth R. K., Annis J., Burles S., Eisenstein D. J., Finkbeiner D. P., Hogg D. W., Lupton R. H., et al., 2003, AJ, 125, 1849
- Blandford & Begelman (1999) Blandford R. D., Begelman M. C., 1999, MNRAS, 303, L1
- Bond (2002) Bond J. R. et al., 2002, astro–ph/0205386
- Budavári et al. (2003) Budavári, T. et al., 2003, ApJ, 595, 59
- Dawson, Holzapfel, Carlstrom, Joy, LaRoque, Miller, & Nagai (2002) Dawson K. S., Holzapfel W. L., Carlstrom J. E., Joy M., LaRoque S. J., Miller A. D., Nagai D., 2002, ApJ, 581, 86
- De Zotti, Granato, Silva, Maino, & Danese (2000) De Zotti G., Granato G. L., Silva L., Maino D., Danese L., 2000, A&A, 354, 467
- Di Matteo, Quataert, Allen, Narayan, & Fabian (2000) Di Matteo T., Quataert E., Allen S. W., Narayan R., Fabian A. C., 2000, MNRAS, 311, 507
- Di Matteo et al. (2001) Di Matteo, T.et al., 2001, ApJ, 550, 19
- Gawiser & Smoot (1997) Gawiser E., Smoot G. F., 1997, ApJl, 480, L1+
- Guerra, Haarsma, & Partridge (1998) Guerra E. J., Haarsma D. B., Partridge R. B., 1998, Bulletin of the American Astronomical Society, 30, 1307
- Heymans, Brown, Heavens, Meisenheimer, Taylor, & Wolf (2004) Heymans C., Brown M., Heavens A., Meisenheimer K., Taylor A., Wolf C., 2004, MNRAS, 347, 895
- Komatsu, Kogut, Nolta, Bennett, Halpern, Hinshaw, Jarosik, Limon, Meyer, Page, Spergel, Tucker, Verde, Wollack, & Wright (2003) Komatsu E., Kogut A., Nolta M. R., Bennett C. L., Halpern M., Hinshaw G., Jarosik N., Limon M., et al., 2003, ApJs, 148, 119
- Komatsu & Seljak (2002) Komatsu E., Seljak U., 2002, MNRAS, 336, 1256
- Lin, Yee, Carlberg, Morris, Sawicki, Patton, Wirth, & Shepherd (1999) Lin H., Yee H. K. C., Carlberg R. G., Morris S. L., Sawicki M., Patton D. R., Wirth G., Shepherd C. W., 1999, ApJ, 518, 533
- Magorrian, Tremaine, Richstone, Bender, Bower, Dressler, Faber, Gebhardt, Green, Grillmair, Kormendy, & Lauer (1998) Magorrian J., Tremaine S., Richstone D., Bender R., Bower G., Dressler A., Faber S. M., Gebhardt K., et al., 1998, AJ, 115, 2285
- Narayan & Yi (1994) Narayan R., Yi I., 1994, ApJ, 428, L13
- Narayan & Yi (1995) —, 1995, ApJ, 444, 231
- (20) —, 1995, ApJ, 452, 710
- O’Dea (1998) O’Dea C. P., 1998, PASP, 110, 493
- Perna & Di Matteo (2000) Perna R., Di Matteo T., 2000, ApJ, 542, 68
- Pierpaoli (2003) Pierpaoli E., 2003, ApJ, 589, 58
- Pierpaoli, Borgani, Scott, & White (2003) Pierpaoli E., Borgani S., Scott D., White M., 2003, MNRAS, 342, 163
- Readhead (2004) Readhead A. C. S. et. al., 2004, astro–ph/0402359
- Rees, Phinney, Begelman, & Blandford (1982) Rees M. J., Phinney E. S., Begelman M. C., Blandford R. D., 1982, Nat, 295, 17
- Spergel, Verde, Peiris, Komatsu, Nolta, Bennett, Halpern, Hinshaw, Jarosik, Kogut, Limon, Meyer, Page, Tucker, Weiland, Wollack, & Wright (2003) Spergel D. N., Verde L., Peiris H. V., Komatsu E., Nolta M. R., Bennett C. L., Halpern M., Hinshaw G., et al., 2003, ApJS, 148, 175
- Toffolatti, Argueso Gomez, de Zotti, Mazzei, Franceschini, Danese, & Burigana (1998) Toffolatti L., Argueso Gomez F., de Zotti G., Mazzei P., Franceschini A., Danese L., Burigana C., 1998, MNRAS, 297, 117
- Toffolatti & et al. (1999) Toffolatti L., et al., 1999, in ASP Conf. Ser. 181: Microwave Foregrounds, pp. 153–+
- Trushkin (2003) Trushkin S., 2003, Bull.Spec.Astrophys.Obs., 55, 90
- White & Majumdar (2004) White M., Majumdar S., 2004, ApJ, 602, 565