The isolated elliptical NGC 4555 observed with Chandra
Abstract
We present analysis of a Chandra observation of the elliptical galaxy NGC 4555. The galaxy lies in a very low density environment, either isolated from all galaxies of similar mass or on the outskirts of a group. Despite this, NGC 4555 has a large gaseous halo, extending to 60 kpc. We find the mean gas temperature to be 0.95 keV and the Iron abundance to be 0.5. We model the surface brightness, temperature and abundance distribution of the halo and use these results to estimate parameters such as the entropy and cooling time of the gas, and the total gravitational mass of the galaxy. In contrast to recent results showing that moderate luminosity ellipticals contain relatively small quantities of dark matter, our results show that NGC 4555 has a massive dark halo and large mass-to-light ratio (56.8 / at 50 kpc, 42.7 at 5, 1 errors). We discuss this disparity and consider possible mechanisms by which galaxies might reduce their dark matter content.
keywords:
galaxies: individual: NGC 4555 – X-rays: Galaxies – galaxies: elliptical and lenticular, cD1 Introduction
The majority of galaxies are found in groups and clusters (Tully, 1987), and this is particularly true of elliptical galaxies. The morphology-density and morphology-radius relations show that elliptical galaxies are most common in the cores of clusters and groups (Dressler, 1980; Melnick & Sargent, 1977). In a hierarchical model of structure formation, this can be explained as a product of the processes which form ellipticals. The merger hypothesis (Toomre & Toomre, 1972) suggests that the product of the merger of two spiral galaxies will be an elliptical galaxy. If this is the case, then galaxy groups are the most likely location of elliptical formation, as these systems have high galaxy densities but relatively low velocity dispersions. The merger of groups to form larger galaxy clusters naturally leads to a large population of elliptical galaxies in the most massive systems.
Given this model of elliptical galaxy formation, it is perhaps unsurprising that the best known elliptical galaxies are found in galaxy groups and clusters. Most clusters and many groups are dominated by a giant elliptical (or cD) galaxy which lies at the bottom of the cluster potential well. X-ray observations have shown these objects to be surrounded by haloes of highly luminous gas (Forman et al., 1985; Trinchieri et al., 1986). The clusters and groups often have their own haloes of hot X-ray emitting gas (Kellogg et al., 1975), and models of galaxies in the cores of such systems suggest that the galaxy halo is probably enhanced by inflow of gas from the surrounding intra-cluster medium (Mathews & Brighenti, 2003). Because of their high X-ray luminosities, these galaxies are the most easily observed in X-rays, and most detailed analyses of elliptical galaxies focus on them (e.g. Buote et al., 2003; Sakelliou et al., 2002; Jones et al., 2002).
However, the location of these galaxies in a dense environment, surrounded by a reservoir of high temperature gas means that their intrinsic properties must always be in doubt. In particular, the question of whether elliptical galaxies produce the observed haloes of X-ray emitting gas through stellar mass loss or accretion from their surroundings is very difficult to answer. It would be greatly simplified if galaxies with little or no surrounding intra-cluster medium (ICM) could be observed. The importance of this issue has recently increased, owing to reports that some ellipticals may contain very little dark matter or may lack dark matter haloes entirely (Romanowsky et al., 2003). This could provide an explanation for the long known issue of the large degree of scatter in the : relation for elliptical galaxies - galaxies with dark matter haloes have sufficient mass to prevent the escape of hot gas and/or accrete more, while those which lack dark matter do not. It is therefore important to observe ellipticals which do not lie at the heart of a large group or cluster potential well in order to answer the question of whether ordinary elliptical galaxies can possess significant quantities of hot gas, without the aid of aa surrounding deep potential well.
As part of a sample of isolated elliptical galaxies, we have used Chandra to observe NGC 4555, a fairly luminous elliptical galaxy (log /=10.78) at a distance of 90 Mpc. We find that this elliptical, which we show is not the dominant galaxy of any group or cluster, has a sizeable X-ray halo. The hot gas in this halo can be used to characterise the dark matter halo surrounding the galaxy. Throughout the paper we assume =75 and normalise optical B-band luminosities to the B-band luminosity of the sun, =5.2 . Abundances are measured relative to the ratios of Grevesse & Sauval (1998), which differ from the older abundance ratios of Anders & Grevesse (1989) in that the solar abundance of Fe is a factor of 1.4 lower. Details of the location and scale of NGC 4555 are given in Table 1.
| R.A. (J2000) | 12 35 41.2 |
|---|---|
| Dec. (J2000) | +26 31 23 |
| Redshift | 0.022 |
| Distance (=75) | 90.33 Mpc |
| 1 arcmin = | 26.3 kpc |
| radius | 19.0 kpc |
In Section 2 we give details of the observation and our data reduction techniques, and Section 3 contains the results of our analysis. Section 4 consists of a discussion of these results, with particular reference to the issue of dark matter in early-type galaxies, and Section 5 summarizes our results and conclusions.
2 Observation and data reduction
NGC 4445 was observed with the ACIS instrument during Chandra Cycle 3, Obs ID 2884. A detailed summary of the Chandra mission and instrumentation can be found in (Weisskopf et al., 2002). The S3 chip was placed at the focus of the telescope in order to take advantage of the enhanced sensitivity of the back illuminated CCDs at low energies. The instrument operated in faint mode, and observed the target for just over 30 ksec. The raw data was reprocessed using ciao v3.0.1 and bad pixels and events with ASCA grades 1, 5 and 7 were removed. The data were corrected to the appropriate gain map, and a correction was made to account for the time dependence of the gain using the technique described by Vikhlinin222http://hea-www.harvard.edu/ alexey/acis/tgain/. A background light curve was produced. Some minor background flares were identified and removed, with all periods where the count rate deviated from the mean by more than 3 being excluded. The effective exposure of the observation after cleaning was 23.3 ksec.
Background images and spectra were generated using the blank sky data described by Markevitch333http://asc.harvard.edu/cal/. The data were cleaned to match the background, and appropriate responses were created using the ciao tasks mkwarf and mkrmf. As the ACIS instruments are affected by absorption by material accumulated on the optical blocking filter, we applied a correction to the responses. When fitting spectra we generally held the absorption fixed at the measured galactic value of 1.36. Point sources were identified using the ciao wavdetect tool with a signal threshold of 10. We chose to use only the S3 chip for our analysis, as the galaxy emission should be entirely contained on S3. This choice of signal threshold means that the detection algorithm should identify 1 false source in the field of view. Once identified, point sources were removed from the data, using regions of twice the radius given by the detection routine.
3 Results
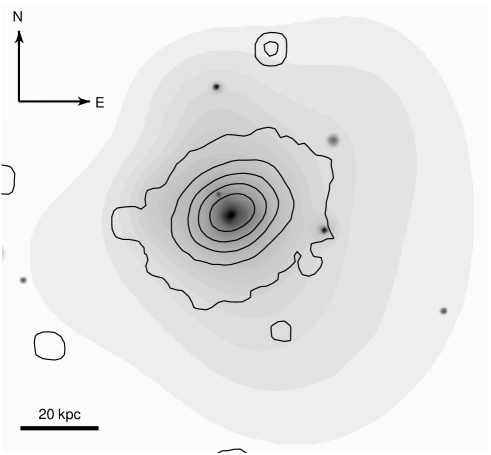
We initially prepared adaptively smoothed images of the galaxy, using the ciao task csmooth. The data were smoothed to show features with a signal to noise ratio of 3 to 5. A scaled background image was smoothed and removed from the data and correction for the variations in exposure across the chip were made. Figure 1 shows the result of the smoothing with optical contours from the Digitized Sky Survey overlaid. From this image, it is clear that the X-ray emission extends well beyond the stellar body of the galaxy, perhaps as far as 60 kpc in some directions.
3.1 Two-dimensional surface brightness modeling
In order to model the X-ray surface brightness distribution of NGC 4555 we prepared source and background images in a 0.3-3.0 keV band, with point sources removed. The energy band was chosen to focus on soft emission and improve the signal-to-noise of the source. Images were binned to a pixel size of 1 ′′. An appropriate exposure map was also generated, and we used the ciao sherpa package to perform the fitting. As the source image has many pixels containing few counts (or none), we use the Cash statistic (Cash, 1979) when fitting. This statistic only provides a relative measure of the goodness of fit, so that while it allows us to improve fits and find the best solution for a particular model, it does not provide an absolute measure of the fit quality. We therefore judge whether fits are satisfactory (or otherwise) by inspection of azimuthally averaged radial profiles and residual images. However, the fits are two dimensional, and so we can determine parameters such as the ellipticity of the halo.

We performed fits using a beta model, de Vaucouleurs model, and combinations of the two with a central point source. When combining the de Vaucouleurs and beta models, the de Vaucouleurs model core radius, axis ratio and position angle were all fixed at the optically determined values (rc=16.11′′, p.a.=35∘, axis ratio=1.26), so that the de Vaucouleurs component would model a discrete source contribution distributed in the same way as the stellar population. We found that the beta model provided an adequate fit to the data and inspection of the residual images and azimuthally averaged radial profiles did not suggest that more complex models improved the fit. We therefore adopt our best beta model fit to describe the surface brightness distribution. The fitted parameters and given in Table 2. Figure 2 shows an azimuthally averaged radial profile with the fitted model.
| rcore (′′) | pos. angle (∘) | axis ratio | |
|---|---|---|---|
| 1.64 | 0.5770.009 | 26.77 | 1.12 |
3.2 Spectral modeling

As an initial step we chose to fit the integrated spectrum of the entire galaxy halo. The spectrum was extracted from a circular region centred on the peak of the emission, with radius 150′′ (65 kpc). After removal of regions corresponding to point sources were removed, source and background spectra were extracted, appropriate responses created and corrected, and the source spectrum grouped to 20 counts per bin. The spectra were fitted using xspec v11.1.0, ignoring energies lower than 0.4 and greater than 8.0 keV. The spectrum was fitted fairly successfully with a model consisting of a 7 keV bremsstrahlung component, and a hot plasma component, modelled using either the MEKAL (Liedahl et al., 1995; Kaastra & Mewe, 1993) or APEC (Smith et al., 2001) codes. The bremsstrahlung component was intended to model emission from unresolved point sources. Both bremsstrahlung and power law models have been successfully used in this role in previous studies (Irwin et al., 2003, 2000). Results of these fits are given in Table 3.
| MEKAL | APEC | APEC+APEC | |
| kT | 0.910.04 | 0.950.04 | 0.82 |
|---|---|---|---|
| kT2 | - | - | 1.36 |
| Zavg | 0.18 | 0.24 | 0.52 |
| Si | 0.52 | 0.58 | 1.12 |
| Fe | 0.41 | 0.50 | 1.06 |
| red. | 1.093 | 1.056 | 1.040 |
| d.o.f. | 162 | 162 | 160 |
| Flux | 4.86 | 4.75 | 4.54 |
| 0.186 | 0.147 | 0.126 | |
| 4.75 | 4.64 | 4.43 |
Although the abundances are rather poorly constrained, freeing Fe and particularly Si greatly improves the fits. A MEKAL + bremsstrahlung model with all metals in solar ratios has a reduced of 1.196 for 164 degrees of freedom, a significantly poorer fit. Assuming the abundances given by the APEC fit, we estimate the masses of Iron and Silicon in the central 65 kpc of the halo to be MFe=1.49105 and MSi=1.83105 respectively. This gives an Iron-mass-to-light ratio of only 2.410-6 /, considerably lower than the values found for galaxy clusters (Finoguenov et al., 2000), or even the values suggested for small galaxy groups (4.510-4, Renzini et al., 1993). It seems reasonable to expect that this relatively small quantity of Iron could be produced by the stellar population of the galaxy without external enrichment.
We also attempted to fit the spectrum with more complex models, including a two-temperature plasma with bremsstrahlung or power law, cooling flow models and multi-temperature models. None of these produced a statistically significant improvement in the fit. However, inspection of the spectrum showed that the use of a two-temperature plasma model produced a slightly better fit to the high energy side of the 1 keV Iron peak, and we therefore record this fit in Table 3. Fitting a single temperature model to spectra from gas with multiple temperature components around 1 keV is known to produce residuals on both sides of the Iron peak (Buote & Fabian, 1998; Buote, 2000), so this apparent improvement in fit probably indicates that NGC 4555 has a multi-temperature halo. It is notable that the measured abundances for this fit are considerably higher that those found for the single temperature plasma fits, again agreeing with previous studies comparing single- and two-temperature fits of multi-temperature gas. However, the abundances are rather poorly constrained. To examine whether the large errors in the bins above 3 keV might be responsible for this lack of precision, we rebinned the spectrum above 3 keV to have at least 20 counts per bin after background subtraction. Unfortunately this does not improve the situation; the errors on temperature and abundance are even larger, and the fit has a reduced of 1.103 (for 85 d.o.f.), not a significant improvement on our previous fits.
We have sufficient detected counts from the galaxy to allow us to split the halo into four bins and fit spectra from these individually. We use elliptical annuli with axis ratio and position angle taken from the best fitting surface brightness model. The angular sizes of the bins are 0-20′′, 20-45′′, 45-90′′ and 90-150′′, with distances measured on the semi-minor axis. The spectra and associated responses and background spectra were prepared as described above and fitted individually. These spectra were not of the quality required to fit individual metal lines, so we used MEKAL models with bremsstrahlung components added if necessary. Figure 4 shows the fitted temperature and abundance in each bin. In each bin we hold the hydrogen column fixed at the galactic value. Only the central bin was improved by the addition of a bremsstrahlung component, which contributes 16 per cent of the emission in this bin. A bremsstrahlung contribution is not ruled out in the other bins, but provides no significant improvement in the fit. We also note that inclusion of such a component does not significantly affect the fitted temperature of the MEKAL component. Fit quality in the central bin is good, reduced =0.87 for 29 degrees of freedom. Fit quality in the outer bins is considerably poorer, with reduced 1.3 in bins 2 and 3 and 1.13 in the outermost bin. We tried numerous models including MEKAL and APEC plasmas, power law and bremsstrahlung components, and multi-temperature components such as CEMEKL and MKCFLOW. None produced any significant improvement over a single temperature plasma, and we therefore use the parameters determined by these models as the best fit. We also tested our background subtraction, using a local background extracted from a source-free region of the S3 chip. Bins 1 and 2 showed no significant change in fit statistic or model parameters when using the local background. The best fit models for bins 3 and 4 had larger errors on temperature and abundance but were consistent with the fits performed using the blank-sky background data. Fit statistics for these bins were also slightly altered, presumably owing to the poorer statistics of the local background data, which is the likely cause of the larger error regions. We conclude from this that our use of the blank-sky background data is justified and gives accurate results.
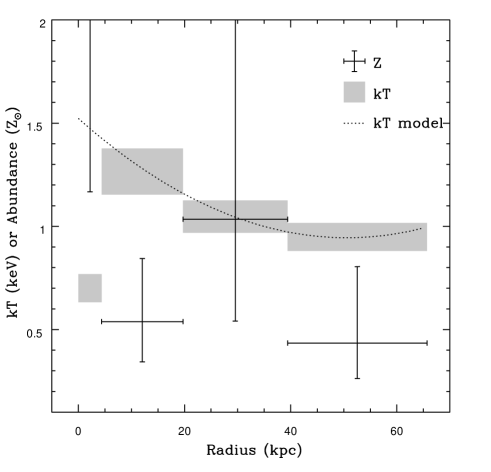
Figure 4 shows that temperature rises from the outer parts toward the core, but turns over and falls in the core. This suggests that radiative cooling in the dense core of the galaxy halo is effective, and has significantly reduced the mean temperature of the gas. The abundance in each bin is more poorly defined, but appears to show a general decrease with increasing radius. This is consistent with enrichment of the galaxy halo by metals lost from the stellar population through stellar winds and supernovae.
3.3 Mass, Entropy and cooling time
Given the surface brightness and temperature modelling of the halo of NGC 4555, it is possible to estimate three dimensional properties such as mass, entropy and cooling time. The density profile of the gas can be estimated from the measured profiles and then normalised to reproduce the X-ray luminosity of the galaxy, determined from our best fitting APEC model. Given the density profile we can use the well known equation for hydrostatic equilibrium,
| (1) |
to calculate the total mass within a given radius. From as density and total mass, we can calculate parameters such as gas fraction, cooling time and entropy where entropy is defined to be
| (2) |
We estimate the errors on the derived values using a monte-carlo technique. The known errors on the temperature and surface brightness models, and on other factors such as the total luminosity, are used to randomly vary the input parameters. We then generate 10000 realisations of the derived parameters profiles, and use these to calculate the 1 error on each parameter at any given radius.
The only issue which arises in these calculations is the question of how well we can model the temperature profile, which declines sharply in the galaxy core. The central bin has no effect on the value of the parameters at larger radii and increases the complexity of the required model, and we therefore choose to exclude the central temperature bin, and model the temperature profile as if there were no central cooling. The remaining three bins can be well described with a quadratic, which is shown as a dotted line in Figure 4. Based on this model of the temperature we calculate the parameters shown in Figure 5.
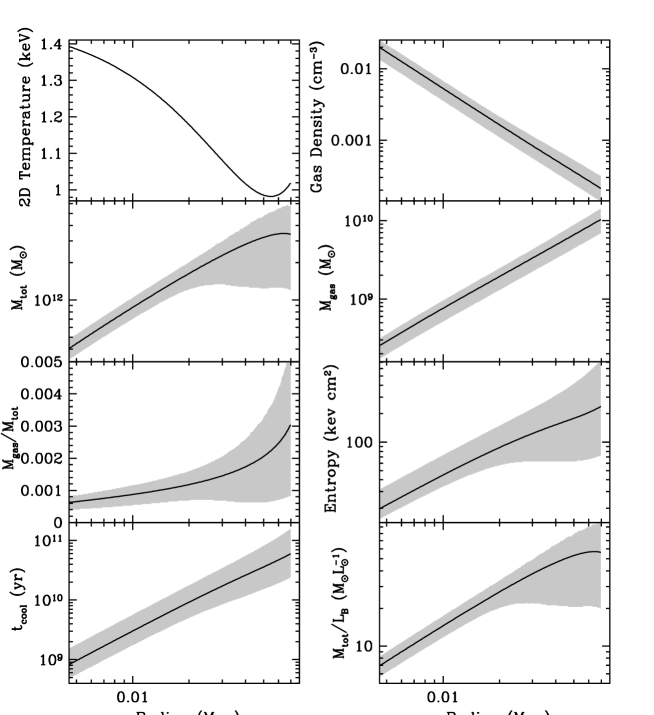
In order to calculate the mass-to-light ratio, we use the H band near infra-red surface brightness profile of Gavazzi et al. (2000). This profile is made up of a bulge component described by a de Vaucouleurs profile, with =4.01′′, and an exponential disk with =17.42′′. We assume that these measurements hold for the B band optical light, and normalise the profile to the B band luminosity, with a bulge-to-disk ratio of 0.33. We note that the mass-to-light ratio at the inner limit of the plot is 9, a little higher than the value of 5-8 generally assumed for the mass-to-light ratio of the stars alone.
The outer limit of the plots is determined by the radius to which we can measure the temperature, and the inner limit by the radius of the innermost temperature bin. The inner limit is chosen to exclude the 5 kpc radius region in which we know our temperature model to be wrong. We also note that both the temperature and surface brightness model profiles were determined using the semi-minor axis as the radius descriptor. The profiles shown in Figure 5 should therefore be considered to show properties which are azimuthally averaged around ellipses whose position and ellipticity are determined by the best fitting surface brightness model, with the radial scale indicating the semi-minor axis.
3.4 Point sources
As described in Section 2, we used the ciao wavdetect tool to identify point sources in the field of view. Several sources are found to lie within the extended emission surrounding NGC 4555, but only two lie within optical extent of the galaxy, defined by the ellipse. Of these, one is coincident with the galaxy core. Surface brightness fitting of the galaxy X-ray halo (see Section 3.1) does not show strong evidence for a central point source, and we conclude that the identification from wavdetect actually corresponds only to the peak of the galaxy halo, not to a separate source.
The remaining source lies 15′′ NE of the galaxy centre, and does not correspond to any feature visible in the DSS optical or 2MASS infra-red images. There are no objects listed at its position in NED. We extracted a count rate for the source, in the full Chandra band and in a 0.5-2.0 keV band. Background subtraction was carried out using a region immediately surrounding the source, and should therefore account for contamination by the galaxy halo. Based on the background subtracted count rate we estimated the flux and luminosity of the source assuming a bremsstrahlung model with kT=5 keV, and a power law model with =1.96, typical of high luminosity point sources in other galaxies (Irwin et al., 2003). The results are given in Table 4.
| R.A. | 12:35:41.74 |
|---|---|
| R.A. error (′′) | 0.127 |
| Dec. | +26:31:35.2 |
| Dec. error (′′) | 0.123 |
| Counts (0.1-12.0 keV) | 15.04 |
| Counts (0.5-2.0 keV) | 15.76 |
| Flux (BR, ) | 2.71910-15 |
| Flux (PL, ) | 2.76810-15 |
If this source is in fact part of the NGC 4555 system and is actually a single object rather than an unresolved cluster of sources, then it is extremely luminous, log 39.43 . We can estimate the probability of finding a background source with the measured flux within the ellipse based on the sources found in the Chandra deep field south (Tozzi et al., 2001). The ellipse has an area of 3.6210-4 square degrees, which means that we would expect to find 0.02 sources with the observed (or greater) flux in that area. Assuming that the background distribution of sources is the same as the Chandra deep field, this suggests that the source is probably part of NGC 4555, and must therefore be classed either as an ultra-luminous X-ray source (ULX), or considered to be an unresolved cluster of sources.
4 Discussion
4.1 Environment
NGC 4555 was selected as part of a sample of isolated ellipticals, extracted from the Lyon-Meudon Extragalactic Data Archive444http://leda.univ-lyon1.fr (LEDA). Sample galaxies were selected using the following criteria:
-
1.
Morphological type , i.e. early-type galaxies.
-
2.
Virgocentric flow corrected velocity .
-
3.
Apparent B-band magnitude .
-
4.
Galaxy not listed as a member of a Lyon Galaxy Group (LGG, Garcia, 1993).
The restrictions on apparent magnitude and recession velocity were imposed to minimise the effect of incompleteness in the catalogue. The LEDA catalogue is known to be 90 per cent complete at (Amendola et al., 1997), so our sample should be close to 100 per cent statistically complete. The selection process produced 330 galaxies which could be considered as potential candidates. These were compared to the rest of the catalogue and accepted as being isolated if they had no neighbours which were:
-
1.
within 700in recession velocity,
-
2.
within 0.67 Mpc in the plane of the sky,
-
3.
less than 2 magnitudes fainter in .
The criteria were imposed to ensure that the galaxies did not lie in groups or clusters, and to ensure that any neighbouring galaxies were too small to have had any significant effect on their evolution or properties.
To check the results of this process, all candidate galaxies were compared to the NASA Extragalactic Database (NED) and the Digitised Sky Survey (DSS). A NED search of the area within 0.67 Mpc of each candidate identifies galaxies not listed in LEDA. We also examine DSS images of this region for galaxies of similar brightness to the target which are not listed in either catalogue. The process produced 40 candidate isolated elliptical galaxies, of which NGC 4555 is one.
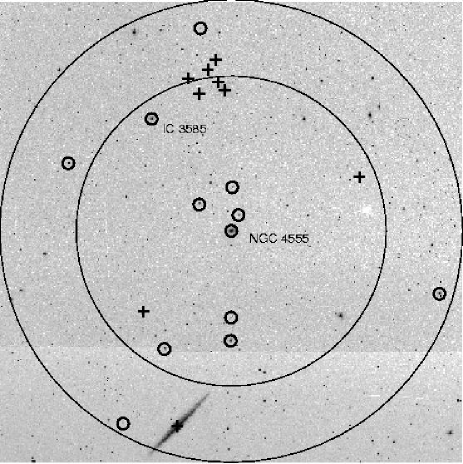
Although NGC 4555 meets the criteria described above, it does have a number of galaxies relatively close to it. We have therefore examined the surrounding galaxy population in order to determine whether NGC 4555 is on the outskirts of a group or cluster. Figure 6 shows a DSS image of the region surrounding NGC 4555, which is marked in the centre of the image. Scale is shown by the two large circles, which have radii of 0.67 and 1 Mpc. All galaxies listed in NED within 1 Mpc which have measured recession velocities are marked on the plot. Crosses indicate galaxies 700 away from NGC 4555, circles those within this velocity range. All galaxies marked by circles have apparent magnitudes at least 2 magnitudes fainter than NGC 4555, with the exception of IC 3585, a nearby S0 galaxy which NED shows to be 600 kpc and 687 from NGC 4555. It is only 1.5 magnitudes fainter than our target, and so would appear to violate our isolation criteria. However, the velocities available from NED have not necessarily been corrected in the same way, so the LEDA velocities should provide the more accurate measure of relative distance. Using the LEDA Virgocentric flow corrected velocities, the difference between the two galaxies is 758 , putting IC 3585 just outside our chosen velocity limit.

Figure 7 shows histograms of the local velocity field within 1 Mpc of NGC 4555. In the upper panel we show galaxies found in NED, which were required only to have a measured redshift. In the lower panel we show galaxies found in LEDA, which were required to have a measured redshift and apparent magnitude. We have marked galaxies whose magnitudes indicate that they have a B-band luminosity in excess of 1010 . The remaining galaxies have . NGC 4555 is represented in each plot by the shaded region at lowest recession velocity.
Although the plots do suggest some sort of extended structure, it is clear that the galaxies in this region do not form a relaxed group. Similarly, it is clear that NGC 4555 is separated from the other galaxies of significant mass (for which is a proxy) by significant distance and velocity difference. It seems possible that NGC 4555 is part of a small filament of galaxies, or that it (with some small companions) is falling into a very poor group to the north. It is very unlikely that NGC 4555 is the dominant galaxy of a virialised group, and it therefore must be assumed that it does not lie in the centre of a massive group-scale dark matter halo.
NGC 4555 does not appear in the sample of “very isolated early-type galaxies” defined by Stocke et al. (2004). This sample is drawn from the Karachentseva (1973) isolated galaxy catalogue, which was compiled by examining images of the environment of all bright ( 15.7) galaxies in the Zwicky et al. (1968) catalogue. Galaxies were classified as isolated if they had no companion within 20 galaxy diameters, where a companion was defined as any galaxy with angular diameter within a factor of 4 of that of the candidate. Stocke et al have further cleaned the resulting sample by examining the Palomar Observatory Sky Survey (POSS) plates to confirm isolation, and performing deeper imaging around a number of the galaxies. This should lead to a sample with few galaxies falsely identified as isolated, but will rule out NGC 4555 because of similarly sized galaxies nearby which are in fact distinct from it in redshift space. It is possible that NGC 4555 is ruled out by the presence of NGC 4565, the large edge on spiral galaxy at the lower edge of Figure 6, which has a recession velocity 5000 smaller than NGC 4555.
We also note that NGC 4555 has been identified as a member of a galaxy group by two previous studies. Mahtessian (1998) suggest that it is part of a triplet with IC 3582 (which is fainter than our magnitude cut off) and NGC 4556 (which has a recession velocity 800 than that of NGC 4555). Ramella et al. (2002) use a friends of friends algorithm to search for associations in the Updated Zwicky Catalog (Falco et al., 1999) and Southern Sky Redshift Survey (da Costa et al., 1998) galaxy catalogues. They suggest that NGC 4555 is part of a group of 7 objects with a range of recession velocities (6615-7819 ). They calculate the group velocity dispersion to be 568 and from this estimate the virial radius (1.64 Mpc), total mass (3.71014 ) and mass-to-light ratio (1740 /). These values seem rather large for a system so poor in galaxies, and are particularly surprising given the lack of a group X-ray halo. From the mass-temperature relation of clusters and groups (Sanderson & Ponman, 2003) we would estimate that a system of this mass would have an X-ray temperature of kT8 keV, and it seems unlikely that such a large dark matter potential could have failed to accrete some gas during its formation. We therefore consider it likely that the identification of NGC 4555 and its neighbours as a collapsed group is faulty, and that they at best form a loose association, not dominated by a single large dark matter halo.
4.2 Comparison with other systems
As mentioned in Section 1, recent studies of the velocity dispersion profiles of some “ordinary” ellipticals have shown them to have lower mass-to-light ratios than were expected (Romanowsky et al., 2003). This suggests that the dark matter content of these galaxies is minimal, at least within the radius to which the measurements extend (5). The profiles are incompatible with the dark matter profiles predicted by simulations of structure formation in a cold dark matter dominated universe, leading to the conclusion that either the haloes take the predicted form but have much lower masses than expected (the results are consistent with zero dark mass), or that the dark matter halo takes a very different form, perhaps with most of the mass at larger radii. Four elliptical galaxies, NGC 821, NGC 3379, NGC 4494 and NGC 4697, have been shown to have this unexpected lack of dark matter. Of these, three are in small groups and are the brightest elliptical in each system. NGC 821 is a rather more isolated system, not part of any known group or cluster. All of the galaxies are relatively X-ray faint, undetected (or only marginally detected, in the case of NGC 4697) by ROSAT, and two have been shown to possess relatively small amounts of X-ray emitting gas (Irwin et al., 2000; O’Sullivan & Ponman, 2004). This lack of a sizeable X-ray halo could be a consequence of the lack of dark matter in these galaxies, as the stellar mass alone would be insufficient to retain a large gaseous halo.
For comparison with NGC 4555, we use the mass-to-light ratios at 5 for NGC 4494, NGC 3379 and NGC 821, quoted by Romanowsky et al. (2003). An overall mass-to-light ratio for NGC 4697 of M/L=11/ was found by Méndez et al. (2001), but this is for a radius of 3. For NGC 4555 itself we have three different measurements of , one overall value, which assumes a de Vaucouleurs profile, and the effective radii of bulge and disk components from Gavazzi et al. (2000), who decompose the surface brightness profile of the galaxy into two components. Their result is rather confusing, as their profiles assign only 33 per cent of the H band light of the galaxy to the bulge component, which would suggest that NGC 4555 is a misclassified S0. However, NGC 4555 is classified as an elliptical in both NED and LEDA, and in fact Gavazzi et al. list its morphological type as elliptical. We therefore believe that the overall effective radius probably gives the best indication of the scale of the galaxy, but quote mass-to-light ratios at three radii. The ratios are listed in Table 5. Using the overall effective radius, it is clear that NGC 4555 has a considerably larger mass-to-light ratio than the three other ellipticals. The Gavazzi et al disk component effective radius produces a similar result, and only if the bulge component is used do we find comparable figures. We assume that this is a poor measure of the true scale of the NGC 4555, and that the galaxy has a larger mass-to-light ratio than the three Romanowsky et al. ellipticals.late
| Galaxy | Radius | M/L |
|---|---|---|
| (′′) | (/) | |
| NGC 821 | 5=250 | 13-17 |
| NGC 3379 | 5=175 | 5-8 |
| NGC 4494 | 5=245 | 5-7 |
| NGC 4555 | 5=80.6 | 43.6 |
| 5=20.1 | 13.8 | |
| 5=87.1 | 46.4 |
Another class of elliptical galaxies which should be compared with NGC 4555 are the fossil groups. These are systems in which all the major galaxies of a group collapse at an early epoch, merging to form a single giant elliptical embedded in a group scale dark matter and X-ray halo (Ponman & Bertram, 1993). Because these systems appear as a single elliptical with no neighbouring galaxies of similar size, our optical selection criteria would likely identify them as candidate isolated ellipticals. Fossil groups can be identified by four main features (Jones et al., 2003). These are: 1) They have an X-ray luminosity typical for a galaxy group ( ), 2) Their X-ray halo is highly extended, 3) The dominant elliptical is at least 2 magnitudes brighter than the other group galaxies, and 4) The dominant elliptical is surrounded by a halo of faint galaxies, the unmerged members of the galaxy group. Criteria 3 and 4 can be refined in that a luminosity function of the galaxies in the fossil group will have only one galaxy with optical luminosity greater than L∗, the luminosity of this galaxy will be significantly higher than would be expected from the luminosity functions of other groups, but the tail of dwarf galaxies will be relatively similar to that of other galaxy groups (see in particular Fig. 7, Jones et al., 2000). NGC 4555 fails the first of these criteria in that its X-ray luminosity is only 4.4-4.7 (model dependent). The extension of the halo of NGC 4555 is also smaller than any known fossil group. The one possible exception is NGC 6482, a fossil group observed with Chandra, whose halo extends off the ACIS-S detector and so is as yet poorly characterised as regards extent (Khosroshahi et al., 2004). The optical luminosity and isolation of NGC 4555 has been dealt with in Section 4.1, and from this the galaxy appears to be isolated enough to meet condition 3 for fossil group status. Testing condition 4 is more difficult, as we do not have redshifts for the faint galaxies around NGC 4555. However, we extracted the positions of all galaxies without redshift listed in NED within 0.444∘ of NGC 4555 (equivalent to 0.7 Mpc at the distance assumed, 90.33 Mpc) and plotted a radial profile of surface number density of galaxies around our isolated elliptical. If NGC 4555 were a fossil group we might expect to see higher number densities around it, caused by the surrounding halo of fainter group members. We note that the galaxies listed have magnitudes as faint as 19.5 mag. and we are therefore likely to be missing some of the faintest galaxies which have not been identified and listed in NED. However, we find no evidence of an overdensity of faint galaxies around NGC 4555 and it seems unlikely that the inclusion of a small number of fainter objects could change this result. This combination of environmental and X-ray properties argues strongly against NGC 4555 being a fossil group.
It is also possible to compare our results with other X-ray mass estimates from the literature. A number of early-type galaxies have mass estimates available, but the requirement for high quality data means that the majority of these galaxies are highly luminous and reside in the cores of groups and clusters. Techniques similar to ours have been used to produce mass profiles of galaxies such as NGC 507 (Paolillo et al., 2003), NGC 1399 and NGC 1404 (Paolillo et al., 2002), NGC 2563, NGC 4325 and NGC 2300 (Mushotzky et al., 2003), NGC 4472, NGC 4636 and NGC 5044 (Mathews & Brighenti, 2003, and references therein). However, these are all group or cluster dominant galaxies, with the exception of NGC 4472, which dominates a subclump in the Virgo cluster, and NGC 1404, which has a truncated halo, probably caused by interaction with Fornax cluster gas. Using an alternate technique, Loewenstein & White (1999) determined constraints on mass and mass-to-light ratio for a sample of 30 galaxies for which global temperature measurements are available, but more detailed density and temperature profiles are not. The authors find that the relation between X-ray temperature and optical velocity dispersion determined from the sample of Davis & White (1996) implies a fairly constant mass-to-light ratio within 6 of 23 /. Once again, however, the sample of galaxies used is heavily weighted toward those ellipticals which dominate groups and clusters - 20 of the 30 galaxies listed by Davis & White are group or cluster dominant ellipticals, and a further 3 should probably be excluded – M32, a dwarf elliptical interacting with M31, NGC 4406, undergoing strong interaction with the Virgo ICM, and NGC 4472 which is mentioned above. It is also worth noting that of the remaining 7 galaxies, 6 are located in either the Virgo or Fornax clusters, and could have had their dark matter halos altered by interactions with their environment.
A third technique for determining the presence of dark matter from X-ray observations has been demonstrated in a series of papers studying NGC 1332, NGC 3923 and NGC 720 (Buote et al., 2002; Buote & Canizares, 1998, 1997, 1996, 1994). These galaxies have non-spherical stellar and X-ray distributions, and the authors employ geometric arguments to show the need for a dark matter component to explain their ellipticity and the relative position angles of the gas and stars. They are able to model the dark halo and produce strong constraints on the total mass and mass-to-light ratio, under the assumptions of hydrostatic equilibrium and that rotation has a minimal influence on the potential. These models suggest that NGC 720 has a mass-to-light ratio of 19 / at 3, NGC 3923 has M/L=17-32 / at 47 kpc, and NGC 1332 has M/L31-143 / within 46 kpc. However, these galaxies are all group dominant ellipticals, and while the groups are not as X-ray luminous as objects such as NGC 5044, they are gravitationally bound systems, as confirmed by the group-scale X-ray haloes around NGC 720 and NGC 3923 (Mulchaey et al., 2003). The mass-to-light ratios for these galaxies are in general agreement with those found by the other methods described above, suggesting that at the radii of interest to us (5-6), most ellipticals for which X-ray estimates are available have mass-to-light ratios of at least 20 /, and in some cases considerably higher. At larger radii, the mass-to-light ratio can rise considerably higher, above 100/, indicating the influence of the group or cluster dark matter halo.
The results of these X-ray mass studies show that dark matter is present in and around the galaxies observed. This is an important result, but the fact that these galaxies are almost all in the cores of much larger systems must raise the issue of whether the dark matter profiles derived for them are really describing the galaxy, the group halo, or some combination of the two. The galaxies for which individual mass profiles or determinations are available can tell us a great deal about ellipticals at the centres of larger structures, but we cannot know what the influence of their environment is. There are a small number of objects in the Loewenstein & White (1999) study which might be individually useful, but unfortunately the technique used applies to the full sample of galaxies and does not provide mass-to-light ratios for each elliptical. We therefore conclude that while we can compare our results for NGC 4555 to these X-ray mass estimates, we must do so cautiously, considering that we may be comparing systems of quite different scale and content.
Two conclusions might be drawn from these comparisons. Firstly, as we have already demonstrated, NGC 4555 is not in the core of a virialised group, and is therefore not surrounded by a group or cluster scale dark matter potential. Its observed properties therefore confirm that elliptical galaxies can possess dark matter haloes of their own, regardless of their environment. The mass of dark matter seems to be comparable to that found for ellipticals in he cores of groups and clusters. It is to be expected that at larger radii, group and cluster dominant ellipticals would have considerably higher mass-to-light ratios that NGC 4555, and it would be interesting to extend our mass profile further to investigate this. The low dark matter content found in the three ellipticals studied by Romanowsky et al. show that while ellipticals can possess dark haloes, not all of them do. This raises an important question; what determines whether elliptical galaxies have dark matter haloes?
One possibility is that all elliptical galaxies are formed with dark matter haloes, but some later lose them through interactions with other galaxies. Close interactions between galaxies can cause tidal stripping of the dark matter halo (Mathews & Brighenti, 1997) as well as gas and stars. Simulations of interactions among multiple galaxies in a compact group suggest that a large amount of the dark matter may in fact be dispersed, forming a common halo but not bound to any particular galaxy (Barnes, 1989). The simulations also show that the dominant galaxy of the group retains a sizeable dark matter halo, but it is possible that there are circumstances in which this would not be the case. NGC 4494, NGC 3379 and NGC 4697, all of which are the most luminous and presumably most massive elliptical in their groups, might have lost their dark matter in this way.
NGC 821 is more difficult to explain as a product of tidal stripping. The galaxy is relatively isolated, not a member of any group or cluster, and in fact meets the isolation criteria described in Section 4.1. As it has no massive neighbours and does not appear to be part of a larger structure, there is little chance that it has suffered tidal stripping. Another method of removing its dark matter halo, or forming such a galaxy without a halo, therefore appears to be required.
Whereas we can compare the mass and mass-to-light ratio of NGC 4555 with the galaxies studied by Romanowsky et al. , comparison of the gas mass and gas fraction with other systems is hampered by the lack of detailed studies of bright ellipticals outside the cores of groups and clusters. As mentioned previously, almost all elliptical galaxies for which mass and gas mass profiles have been calculated are the dominant galaxies of larger structures. Their properties are likely to be affected by the surrounding potential, and models of galaxies embedded in a dense intra-group medium show that the galaxy can accrete gas from its environment (Brighenti & Mathews, 1999), thereby changing its gas fraction. An alternative is to compare NGC 4555 to a sample of poor groups. These have gas temperatures similar to that we observe in NGC 4555, and sufficient numbers have been studied to make samples reliable. We use the 0.3-1.3 keV sample of Sanderson et al. (2003) which contains two elliptical galaxies but is dominated by poor groups.
For an accurate comparison, it is necessary to compare properties at a common radius, relative to the overall size of the system. This is usually done using (where is a good approximation of the virial radius). Unfortunately we do not have a measured value of for NGC 4555 and we cannot calculate one based on our three dimensional models, as the temperature model is not accurate beyond the outer radius we have used. Based on the Sanderson et al. groups, a typical for a system of this temperature might be 500 kpc. If we adopt this value, we see that while the 0.3-1.3 keV poor groups have gas fractions of 1 per cent at 0.1, NGC 4555 has a gas fraction a factor of 5 lower. This result is of course dependent on the value of chosen. The Sanderson et al. systems have values of ranging from 200-800 kpc, but even if we assume a larger ( and therefore measure gas fraction at a larger radius) we still find that NGC 4555 has a gas fraction considerably lower than that of poor groups.
5 Summary and conclusions
We have used Chandra to observe the relatively isolated early-type galaxy NGC 4555. An examination of its environment suggests that the galaxy is not a member of a virialised group, though it may be part of a loose association or filament of galaxies. It is unlikely that the galaxy is in the core of a larger, group-scale dark matter potential, as is the case with many of the early-type galaxies whose X-ray properties have been studied in more detail. Despite the lack of a surrounding group potential, we find that the galaxy possesses an extended gaseous halo with a temperature of kT0.95 keV and Fe abundance 0.5.
We measure the surface brightness distribution of the gaseous halo and find that it is reasonably well described by a single beta model, supporting the spectral results which suggest that emission from gas dominates over emission from point sources. We also measure the temperature and abundance profiles and find evidence for a central cooling region, though confirmation of this would require fitting a multi-temperature model which at present we have insufficient counts to do. Assuming the gaseous halo to be in hydrostatic equilibrium, we use these measurements to estimate the gas mass, entropy, cooling time, total gravitating mass and mass-to-light ratio of the system. We find a mass-to-light ratio of 42.7 / at 5, demonstrating that dark matter makes up an important part of the galaxy mass budget.
A recent optical study of the dark matter content of three ellipticals by Romanowsky et al. (2003) shows a quite different result. All three galaxies have very low dark matter content, and two are consistent with having no dark matter at all, at least out to 5. At least one of these galaxies (NGC 4494) is X-ray faint, and two of them are members of galaxy groups. We suggest that the X-ray luminosity of early-type galaxies, which is dependent on the size of X-ray halo which they can maintain, may be an indicator of their possession, or lack of, a dark matter halo. This raises the question of how galaxies could lose (or gain) an extensive dark matter halo, and how we might distinguish between different processes which could affect such haloes. This is clearly a question which deserves further consideration, and it seems likely that both improved models and further observations of early-type galaxies will be required before it can be answered.
Acknowledgments
We are grateful to S. Helsdon for the use of his 3-d gas properties
software and J. Kempner for the use of his Chandra reduction software.
We are also indebted to D. Forbes for his help in the early stages of the
project, and to an anonymous referee for their efforts to improve the
paper. This research has made use of the NASA/IPAC Extragalactic Database
(NED) and Digitised Sky Survey (DSS). This research was supported in part
by NASA grants NAG5-10071 and GO2-3186X.
References
- Amendola et al. (1997) Amendola L., Di Nella H., Montuori M., Sylos Labini F., 1997, Fractals, 5, 635
- Anders & Grevesse (1989) Anders E., Grevesse N., 1989, Geo. et Cosmo. Acta, 53, 197
- Barnes (1989) Barnes J. E., 1989, Nature, 338, 123
- Brighenti & Mathews (1999) Brighenti F., Mathews W. G., 1999, ApJ, 512, 65
- Buote & Fabian (1998) Buote D., Fabian A., 1998, MNRAS, 296, 977
- Buote (2000) Buote D. A., 2000, MNRAS, 311, 176
- Buote & Canizares (1994) Buote D. A., Canizares C. R., 1994, ApJ, 427, 86
- Buote & Canizares (1996) Buote D. A., Canizares C. R., 1996, ApJ, 457, 177
- Buote & Canizares (1997) Buote D. A., Canizares C. R., 1997, ApJ, 474, 650
- Buote & Canizares (1998) Buote D. A., Canizares C. R., 1998, MNRAS, 298, 811
- Buote et al. (2002) Buote D. A., Jeltema T. E., Canizares C. R., Garmire G. P., 2002, ApJ, 577, 183
- Buote et al. (2003) Buote D. A., Lewis A. D., Brighenti F., Mathews W. G., 2003, ApJ, 594, 741
- Cash (1979) Cash W., 1979, ApJ, 228, 939
- da Costa et al. (1998) da Costa L. N., Willmer C. N. A., Pellegrini P. S., Chaves O. L., Rité C., Maia M. A. G., Geller M. J., Latham D. W., Kurtz M. J., Huchra J. P., Ramella M., Fairall A. P., Smith C., Lípari S., 1998, AJ, 116, 1
- Davis & White (1996) Davis D. S., White R. E. I., 1996, ApJ, 470, L35
- Dressler (1980) Dressler A., 1980, ApJ, 236, 351
- Falco et al. (1999) Falco E. E., Kurtz M. J., Geller M. J., Huchra J. P., Peters J., Berlind P., Mink D. J., Tokarz S. P., Elwell B., 1999, PASP, 111, 438
- Finoguenov et al. (2000) Finoguenov A., David L. P., Ponman T. J., 2000, ApJ, 544, 188
- Forman et al. (1985) Forman W., Jones C., Tucker W., 1985, ApJ, 293, 102
- Garcia (1993) Garcia A. M., 1993, A&AS, 100, 47
- Gavazzi et al. (2000) Gavazzi G., Franzetti P., Scodeggio M., Boselli A., Pierini D., 2000, A&A, 361, 863
- Grevesse & Sauval (1998) Grevesse N., Sauval A. J., 1998, Space Sci. Rev., 85, 161
- Irwin et al. (2003) Irwin J. A., Athey A. E., Bregman J. N., 2003, ApJ, 587, 356
- Irwin et al. (2000) Irwin J. A., Sarazin C. L., Bregman J. N., 2000, ApJ, 544, 293
- Jones et al. (2002) Jones C., Forman W., Vikhlinin A., Markevitch M., David L., Warmflash A., Murray S., Nulsen P. E. J., 2002, ApJ, 567, L115
- Jones et al. (2000) Jones L., Ponman T., Forbes D., 2000, MNRAS, 312, 139
- Jones et al. (2003) Jones L. R., Ponman T. J., Horton A., Babul A., Ebeling H., Burke D. J., 2003, MNRAS, 343, 627
- Kaastra & Mewe (1993) Kaastra J., Mewe R., 1993, A&AS, 97, 443
- Karachentseva (1973) Karachentseva V. E., 1973, Soobshcheniya Spetsial’noj Astrofizicheskoj Observatorii, 8, 3
- Kellogg et al. (1975) Kellogg E., Baldwin J. R., Koch D., 1975, ApJ, 199, 299
- Khosroshahi et al. (2004) Khosroshahi H. G., Jones L. R., Ponman T. J., 2004, MNRAS, 349, 1240
- Liedahl et al. (1995) Liedahl D. A., Osterheld A. L., Goldstein W. H., 1995, ApJ, 438, L115
- Loewenstein & White (1999) Loewenstein M., White R. E., 1999, ApJ, 518, 50
- Méndez et al. (2001) Méndez R. H., Riffeser A., Kudritzki R.-P., Matthias M., Freeman K. C., Arnaboldi M., Capaccioli M., Gerhard O. E., 2001, ApJ, 563, 135
- Mahtessian (1998) Mahtessian A. P., 1998, Astrofizika, 41, 255
- Mathews & Brighenti (1997) Mathews W. G., Brighenti F., 1997, ApJ, 493, L9
- Mathews & Brighenti (2003) Mathews W. G., Brighenti F., 2003, ARA&A, 41, 191
- Melnick & Sargent (1977) Melnick J., Sargent W. L. W., 1977, ApJ, 215, 401
- Mulchaey et al. (2003) Mulchaey J. S., Davis D. S., Mushotzky R. F., Burstein D., 2003, ApJS, 145, 39
- Mulchaey & Zabludoff (1999) Mulchaey J. S., Zabludoff A. I., 1999, ApJ, 514, 133
- Mushotzky et al. (2003) Mushotzky R., Figueroa-Feliciano E., Loewenstein M., Snowden S. L., 2003, in Mulchaey J. S., Dressler A., Oemler A., eds, Carnegie Observatories Astrophysics Series, Vol. 3: Clusters of Galaxies: Probes of Cosmological Structure and Galaxy Evolution Groups and the Entropy Floor- XMM-Newton Observations of Two Groups. Cambridge: Cambridge Univ. Press
- O’Sullivan & Ponman (2004) O’Sullivan E., Ponman T. J., 2004, MNRAS, 349, 535
- Paolillo et al. (2002) Paolillo M., Fabbiano G., Peres G., Kim D.-W., 2002, ApJ, 565, 883
- Paolillo et al. (2003) Paolillo M., Fabbiano G., Peres G., Kim D.-W., 2003, ApJ, 586, 850
- Ponman et al. (1994) Ponman T. J., Allan D. J., Jones L. R., Merrifield M., McHardy I. M., Lehto H. J., Luppino G. A., 1994, Nature, 369, 462
- Ponman & Bertram (1993) Ponman T. J., Bertram D., 1993, Nature, 363, 51
- Ramella et al. (2002) Ramella M., Geller M. J., Pisani A., da Costa L. N., 2002, AJ, 123, 2976
- Renzini et al. (1993) Renzini A., Ciotti L., D’Ercole A., Pellegrini S., 1993, ApJ, 419, 52
- Romanowsky et al. (2003) Romanowsky A. J., Douglas N. G., Arnaboldi M., Kuijken K., Merrifield M. R., Napolitano N. R., Capaccioli M., Freeman K. C., 2003, Science, 301, 1696
- Sakelliou et al. (2002) Sakelliou I., Peterson J. R., Tamura T., Paerels F. B. S., Kaastra J. S., Belsole E., Böhringer H., Branduardi-Raymont G., Ferrigno C., den Herder J. W., Kennea J., Mushotzky R. F., Vestrand W. T., Worrall D. M., 2002, A&A, 391, 903
- Sanderson & Ponman (2003) Sanderson A. J. R., Ponman T. J., 2003, MNRAS, 345, 1241
- Sanderson et al. (2003) Sanderson A. J. R., Ponman T. J., Finoguenov A., Lloyd-Davies E. J., Markevitch M., 2003, MNRAS, accepted
- Smith et al. (2001) Smith R. K., Brickhouse N. S., Liedahl D. A., Raymond J. C., 2001, ApJ, 556, L91
- Stocke et al. (2004) Stocke J. T., Keeney B. A., Lewis A. D., Epps H. W., Schild R. E., 2004, AJ, in press
- Toomre & Toomre (1972) Toomre A., Toomre J., 1972, ApJ, 178, 623
- Tozzi et al. (2001) Tozzi P., Rosati P., Nonino M., Bergeron J., Borgani S., Gilli R., Gilmozzi R., Hasinger G., Grogin N., Kewley L., Koekemoer A., Norman C., Schreier E., Szokoly G., Wang J. X., Zheng W., Zirm A., Giacconi R., 2001, ApJ, 562, 42
- Trinchieri et al. (1986) Trinchieri G., Fabbiano G., Canizares C. R., 1986, ApJ, 310, 637
- Tully (1987) Tully R. B., 1987, ApJ, 321, 280
- Weisskopf et al. (2002) Weisskopf M. C., Brinkman B., Canizares C., Garmire G., Murray S., Van Speybroeck L. P., 2002, PASP, 114, 1
- Zwicky et al. (1968) Zwicky F., Herzog E., Wild P., 1968, Catalogue of galaxies and of clusters of galaxies. Pasadena: California Institute of Technology (CIT), 1961-1968