Extended Molecular Gas in the Nearby Starburst Galaxy Maffei 2
Abstract
We present a fully-sampled map of the CO emission in the nearby starburst galaxy Maffei 2 obtained at the Five College Radio Astronomy Observatory. The map reveals previously known strong CO emission in the central starburst region as well as an extended asymmetric distribution with bright CO lines at the ends of the bar and in a feature at the north-east edge of the molecular disk. This northern feature, proposed previously to be an interacting companion galaxy, could be a dwarf irregular galaxy, although the CO data are also consistent with the feature being simply an extension of one of the spiral arms. We estimate the total molecular gas mass of Maffei 2 to be or of its dynamical mass. Adopting the recently determined lower value for the CO-to-H2 conversion factor in the central region, our data lead to the surprising result that the largest concentrations of molecular gas in Maffei 2 lie at the bar ends and in the putative dwarf companion rather than in the central starburst. A gravitational stability analysis reveals that the extended disk of Maffei 2 lies above the critical density for star formation; however, whether the central region is also gravitationally unstable depends both on the details of the rotation curve and the precise value of the CO-to-H2 conversion factor in this region.
1 Introduction
Maffei 2 is a nearby barred spiral galaxy (Hubble-type: SBb(s) pec; Hurt et al., 1993a; Buta & McCall, 1999) which is a member of the IC342/Maffei group of galaxies located in the Zone of Avoidance behind the Galactic plane (Krismer, Tully, & Gioia, 1995). Strong infrared (Rickard & Harvey, 1983; Hurt et al., 1993a), Brackett line (Ho, Beck, & Turner, 1990), and radio continuum emission (Seaquist, Pfund, & Bignell, 1976; Hurt, Turner, & Ho, 1996) indicate that the central region is undergoing a starburst. Originally thought to be at a distance of 5 Mpc (Spinrad et al., 1973), a recent study places Maffei 2 somewhat closer at Mpc (Fingerhut et al. (2002), corrected to a true distance modulus of 18.5 for the LMC). The star formation rate in Maffei 2 is close to that of other well-studied, nearby starbursting spirals such as NGC 253 and M83 (Turner & Ho, 1994), but its unfortunate location () has left it poorly studied compared to its counterparts. Though well-mapped in HI (Hurt et al., 1996) and infrared (Hurt et al., 1993a; Buta & McCall, 1999), previous CO observations have concentrated on the nuclear region, rather than the galaxy as a whole (CO : Weliachew, Casoli, & Combes, 1988; Ishiguro et al., 1989; higher CO transitions: Sargent et al., 1985; Hurt et al., 1993b; Israel & Baas, 2003). While the early study of Rickard, Turner, & Palmer (1977) observed several positions along the major axis, the full two-dimensional distribution of the molecular gas in Maffei 2 has not been previously observed.
Due to its high visual obscuration, the morphology of Maffei 2 was only established fairly recently. Originally identified as a spiral galaxy by Spinrad et al. (1971) and later classified as an Sbc II by Spinrad et al. (1973), evidence for a bar was not confirmed until a later high-resolution HI study (Hurt, Turner, & Ho, 1988). Its Hubble type was revised by Hurt et al. (1993a) to SBb(s) pec after infrared observations revealed asymmetric spiral arms, misaligned bar halves, and an anomalous third spiral arm that appeared to lead the galaxy. This third “arm” was interpretated by Hurt et al. (1993a) as a possible tidal tail connecting Maffei 2 with an interacting dwarf galaxy. However, Buta & McCall (1999) identify this feature as part of a trailing spiral arm and even identify a counterpart spiral arm on the opposite side of the galaxy in their deep optical images. An HI and 21 cm continuum study by Hurt et al. (1996) showed similar features to the infrared data, as well as revealing a central hole in the atomic gas distribution. Differences in the systemic velocity between the central regions and the disk were interpreted to be indicative of tidal disruption (Hurt et al., 1996).
Previous CO observations of the central region of Maffei 2 have shown that the molecular gas is strongly concentrated towards the inner arcminute of the galaxy (Rickard et al., 1977; Weliachew et al., 1988). Aperture synthesis observations of this central region have identified features such as a molecular bar and an expanding nuclear ring (Ishiguro et al., 1989). Although Rickard et al. (1977) provide an estimate of the total molecular gas mass from their major-axis data, a confirmation of the amount of molecular gas from a full two-dimensional map is necessary to compare Maffei 2 to other nearby starburst galaxies. The possibility that Maffei 2 is undergoing tidal disruption adds further motivation to obtaining a complete molecular gas map of this system.
In this paper, we present a completely sampled map of the 12CO line to study the distribution of star-forming regions and the molecular gas content of the inner disk of Maffei 2. The observations and data reduction are discussed in §2. The CO emission map is presented in §3, and the molecular gas mass is calculated and compared to other nearby starburst galaxies in §4. We perform a disk stability analysis in §5 and the paper is summarized in §6.
2 Observations and Data Reduction
Maffei 2 was observed with the SEQUOIA (Second Quabbin Optical Imaging Array) single-sideband instrument at the Five College Radio Astronomy Observatory (FCRAO) 14 m telescope (half-power beamwidth ) using the “on the fly” (OTF) mapping mode. SEQUOIA has 32 pixels arranged in a dual-polarized 4 4 array; however, only 16 of these pixels are available for extragalactic or Galactic Center observations which require a wider spectrometer bandwidth of 320 MHz (5 MHz/channel). The OTF maps were obtained on 2002 February 25 and 26. Each of the 16 pixels was examined individually to check for bad baselines; data from one bad pixel were excluded from the first day’s data, and data from three bad pixels were excluded from the second day’s data. In total, 11 complete maps of Maffei 2 were obtained covering . The amount of on-source time varied with position in the map, but most points had between 3 and 4 hours of integration time. Pointing and focus checks were done immediately before, once during, and immediately following the source observations on each day. Typical system temperatures were 500-700 K at an elevation of . Contamination in the off position towards R Cas from local absorption at 0 km s-1 and Perseus arm absorption at km s-1 was removed from the spectra by interpolating across adjacent channels. The data were noise-weighted, flat-fielded (divided by the relative beam efficiency for each horn), and a first-order baseline removed from each spectrum before being written to a CLASS-format file for further analysis.
The 11 OTF maps of Maffei 2 were co-added to produce one spectrum at each observed location. All antenna temperatures were converted to main beam temperatures using the relation , where for the FCRAO telescope111http://donald.phast.umass.edu/ fcrao/observer/. The parameters of the spectra were found by fitting gaussians to the lines in CLASS. The typical rms noise in the reduced spectra was 0.025 K at a velocity resolution of 13 km s-1 (5 MHz). In the center, which contains the strongest emission, the peak brightness temperature was K. The integrated intensity, , was obtained from the gaussian fit to each spectrum. The uncertainty in the integrated intensity is (Wilson & Scoville, 1989), where is the velocity resolution (13 km s-1), is the rms noise, is the number of channels in the line, and is the number of channels in the baseline. Values for ranged from 0.4 to 1.4 K km s-1 for a range of line widths (full width half-maximum) from 13 to 190 km s-1; the relative uncertainties for each integrated intensity measurement range from 2% to 33% with a median value of 7%. The peak value of , found in the center spectrum, was K km s-1.
3 The Spatial Distribution of Molecular Gas in Maffei 2
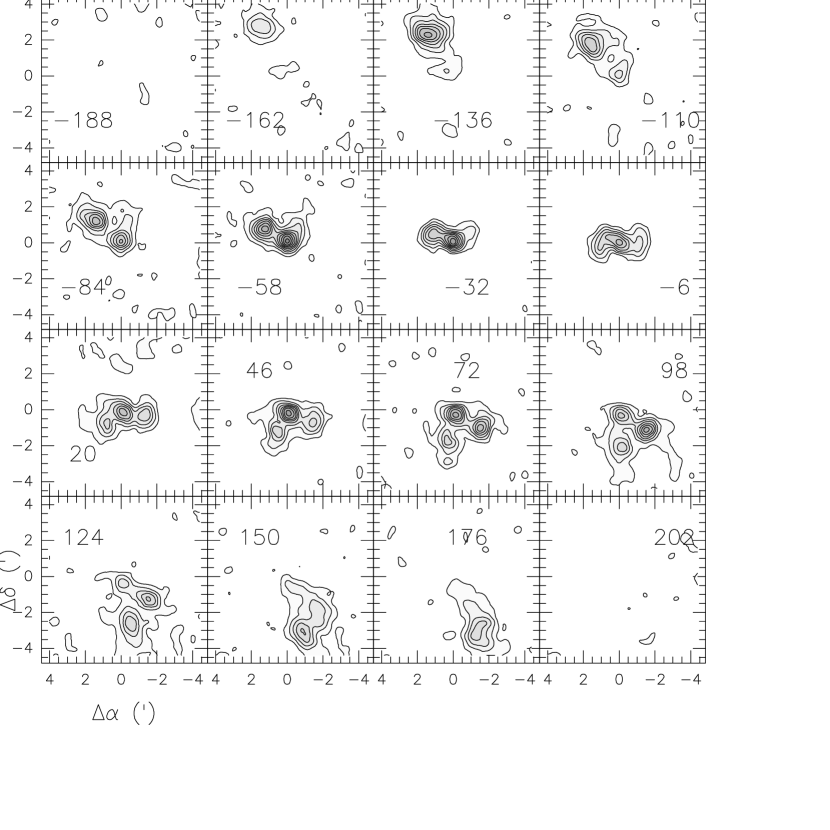
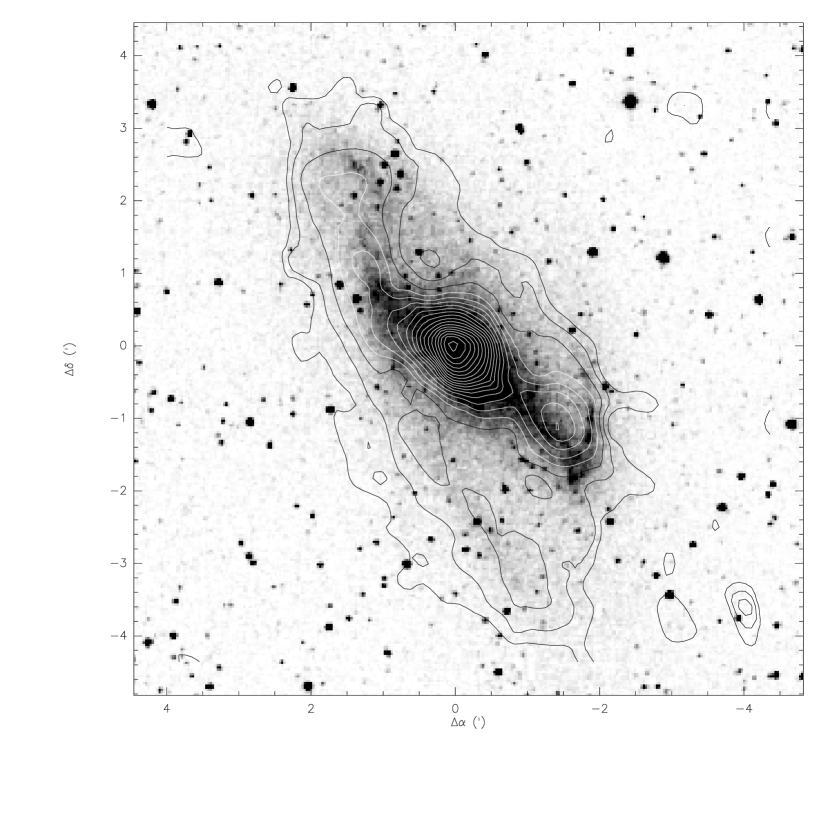
The distribution of the CO emission as a function of velocity in Maffei 2 is shown in Figure 1 and a contour plot of the integrated CO intensity, , overlaid on the 2MASS K-band image is shown in Figure 2. Note that Figure 2 does not show the full extent of Maffei 2, as Buta & McCall (1999) identified emission from the galaxy out to a radius of 12′. Indeed, even the CO extent of Maffei 2 may be somewhat bigger than shown here, as there are clear detections of CO emission along the southern edge of the map. The strongest peak by far is found in the central region, as expected from previous CO studies. The prominent central region contains 20% of the total CO flux of Maffei 2 within a region (760 pc) in apparent radius. The presence of a bar could indicate a galactic-wide funneling effect of molecular gas from the outer parts to the central region, perhaps fueling the intense starburst while decreasing the amount of star formation elsewhere (Sakamoto et al., 1999). The galaxy has a strong peak southwest of the nucleus which is distinct from the central emission. In comparing the CO map and the infrared image, it seems likely that this emission originates from the end of the bar and the start of a spiral arm. To the northeast, the CO emission extends smoothly along a well-defined bar. The different appearance of the CO emission in the northeast and southwest sides of the bar is the main source of asymmetry in the CO integrated intensity plot; a difference in the CO intensity in the two bar halves was also noted by Hurt et al. (1993a). Because of the high inclination of Maffei 2 and our relatively low angular resolution, distinct spiral arms are hard to trace in our CO map.
The northernmost extent of the CO emission raises some interesting questions about the morphology of Maffei 2. There is a bright spot in the 2MASS image inside the CO peak there, which suggests that the CO feature is real rather than due to higher noise levels in the outskirts of the map. The location of this infrared peak corresponds to features found in other wavelengths; in both IR (Hurt et al., 1993a) and 20 cm continuum (Hurt et al., 1996), this object was identified as a possible tidal feature, perhaps connecting to an interacting companion. Because there was no evidence for an independent kinematic signature in HI, the potential companion was proposed to be a dwarf elliptical galaxy, which would possess little or no atomic gas (Hurt et al., 1996). However, the CO emission seen at this position in our map calls this identification into question, as we would not expect a dwarf elliptical to show up in a survey of molecular gas. One possibility is that this potential companion is a dwarf irregular galaxy whose HI emission is too weak to produce an obviously independent kinematic signature. Alternatively, the CO, infrared, and 20 cm emission could arise from an extension of the spiral arm that starts from the southwest end of the bar (which would imply that the spiral arms are more similar in length than previously thought) or could even be part of an outer spiral arm, as suggested by deep optical images (Buta & McCall, 1999). From a morphological standpoint, it is not obvious which interpretation is more likely, although the evidence that Maffei 2 exhibits asymmetry at many wavelengths lends weight to a merger scenario.
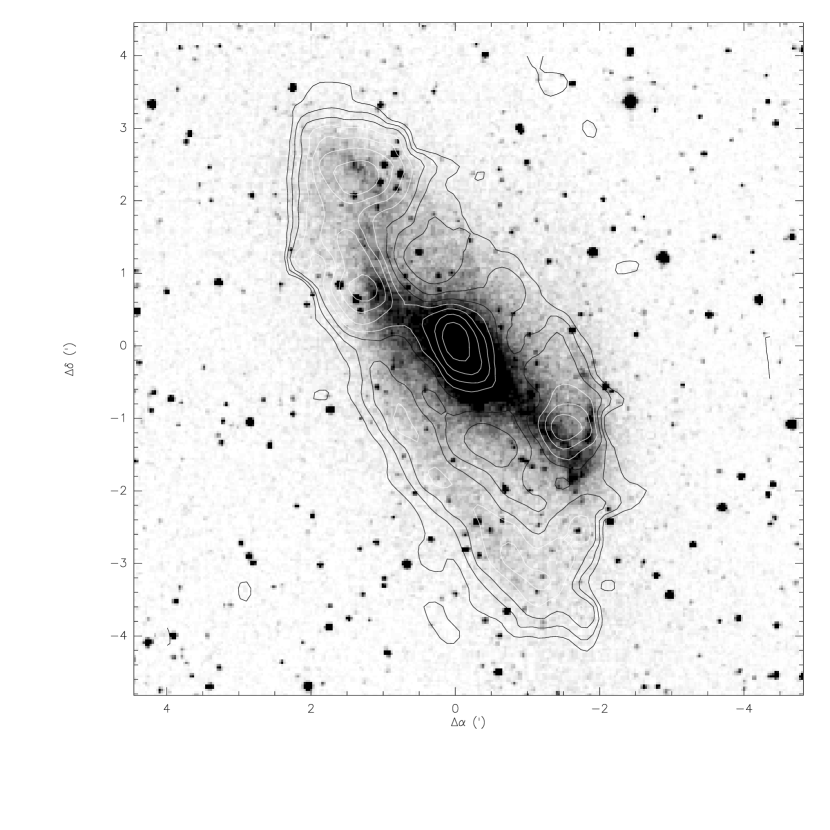
A somewhat different picture of the CO distribution can be found by comparing the map of peak brightness temperatures, , shown in Figure 3, with the integrated intensity map shown in Figure 2. There are several distinct differences in the plots of and . While the main peaks in the map are the central region, with a single spectrum integrated intensity of 86.6 K km s-1, and the southwest bar end, with a single spectrum integrated intensity of 35.8 K km s-1, in the map we find four sources with comparable temperatures: the nucleus, the two bar ends, and the northernmost peak. Most of the northeastern emission is negligible when integrating over velocity, as the lines in this region are narrow, with typical FWHM of km s-1, compared to km s-1 in the southwest. The galaxy appears less asymmetric in the map, as the peaks on each side of the nucleus are at almost the same level. The spiral arm starting from the northeast end of the bar is much easier to trace out in the map, as several bright spots appear to coincide with the infrared arm. However, the spiral arm originating from the southwest end of the bar is still not prominent in the map.
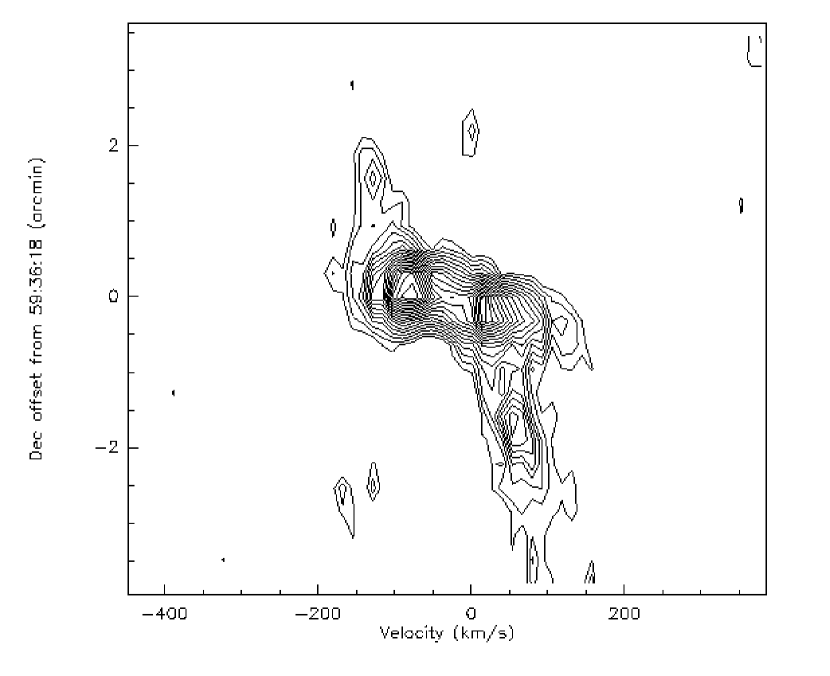
Although the central emission appears to originate from a single source in our map, two distinct nuclear components have been found in other studies with higher angular resolution (Ishiguro et al., 1989; Hurt et al., 1993b; Israel & Baas, 2003). Surprisingly, even with our large beam, we also are able to resolve these two sources using a position-velocity cut along the major axis of the galaxy (Figure 4). The two main peaks are separated by about 100 km s-1, although they appear at almost the same spatial location, which causes line-of-sight superposition in Figures 1-3. The position-velocity slices of the data of Israel & Baas (2003) in CO show similar peaks separated by 100 km s-1, 80 km s-1, and 70 km s-1, respectively, with the change in separation due mostly to increased angular resolution. We can use Figure 4 to estimate the systemic velocity of Maffei 2 by finding the average of the two central velocity peaks. With the two main peaks occurring at km s-1 and 20 km s-1, an average of these gives a systemic velocity km s-1, which is very close to the value adopted for most of the CO observations222 km s-1 corresponds to km s-1, assuming a solar motion of 16.5 km s-1 towards , . (Ishiguro et al., 1989; Hurt et al., 1993b; Israel & Baas, 2003). An average of the mean velocity at large spatial offsets gives km s-1, which is in reasonable agreement with the commonly adopted systemic velocity given our simple analysis.
4 The Molecular Gas Content of Maffei 2
The molecular mass at a single position in our map is given by
where is the CO-to-H2 conversion factor, is the mass of a hydrogen molecule, and the factor represents the area of a Gaussian beam of full-width half-maximum diameter . To find the mass of regions involving multiple spectra, we must account for oversampling in the map; this is done by finding the total sum , where each comes from one spectrum, and dividing the sum by the factor 1.133 , which accounts for the overlapping Gaussian beams. Using the commonly assumed Galactic value of cm-2 (K km s-1)-1 (Young & Scoville, 1991), our previously assumed distance of 3.47 Mpc, and our summed, sampling-corrected total flux of K km s-1 (where the uncertainty is simply calculated from the measurement uncertainties of the individual spectra in the map), we find the total molecular gas mass of Maffei 2 to be . This value is uncertain by about a factor of 2 due primarily to uncertainties in the CO-to-H2 conversion factor. For comparison, the H2 mass of the Milky Way is estimated to be (Scoville & Sanders, 1987). Assuming the dynamical mass of Maffei 2 to be (Hurt et al., 1996), molecular hydrogen gas represents 3.6% of the total mass of Maffei 2. Adding in the total HI mass from Hurt et al. (1996) and correcting for the new distance, we obtain a total gas mass . The total hydrogen gas content is thus about 4.8% of the dynamical mass of the galaxy, surprisingly typical of the values found for SBb galaxies (Young & Knezek, 1989) given the starburst nature of the central region of Maffei 2. Note that gas mass to dynamical mass ratios depend linearly on the rather uncertain value for the distance to Maffei 2.
It is unlikely that adopting a standard conversion factor for the entire disk of Maffei 2 will result in an accurate assessment of the molecular content. Many studies have found that the CO-to-H2 factor can be lower in the nuclei of galaxies by up to a factor of 10 from the value found in the disk (our Galaxy: Sodroski et al., 1995; Oka et al., 1998; Dahmen et al., 1998; other galaxies: Israel & Baas, 2001, 2003). A recent paper by Israel & Baas (2003) describes a similar result for the nucleus of Maffei 2 and derives a value of . Their analysis indicates that we may overestimate the amount of gas in the central region by about a factor of ten if we assume a Galactic conversion factor across the galaxy. Therefore, we adopt their value to calculate the amount of H2 in the central region. With this assumption, we find a central molecular mass of out to a radius of about 760 pc. We assume that a constant conversion factor across the disk will give a good estimate of the amount of H2, and use the Galactic factor to find the molecular mass outside of the nucleus. Combining the results from these two regions, we find a revised total molecular mass of . This value is still well within uncertainties of our first estimate; the significant difference comes in our analysis of the gas content of the nucleus. Hurt & Turner (1991) estimated the dynamical mass inside the central R pc to be ; our value for the molecular gas mass in a region of approximately the same size, using the smaller conversion factor, is . Without using a modified value for , our observations would lead to in the central region, an unphysical result which does not reflect the presence of stars in the galactic center.
The nucleus of Maffei 2 has been studied well in CO, and provides a good check to our data. We first convert the values of previous authors to the new distance estimate of 3.47 Mpc and the nuclear conversion factor found by Israel & Baas (2003). Ishiguro et al. (1989) found the nuclear molecular bar (a region 700 pc 140 pc in size) to have a mass of , and Weliachew et al. (1988) found the molecular mass inside the central 550 pc, a significantly smaller region than ours, to be . Our higher mass value is likely due to the larger region we studied. An interesting result is found by comparing our data to the data of Rickard et al. (1977). Although they used a larger beam than ours ( versus our ), the peak values (in units of T) for the nucleus are almost the same. For a point source, we would expect the intensity measured by their beam to be times our value. The fact that their intensity is comparable to ours means that either the nuclear emission does not arise from a point source, or emission from the disk is significant, or both. It has been confirmed in several studies that the nuclear emission arises from two distinct components (Ishiguro et al., 1989; Hurt et al., 1993b; Israel & Baas, 2003), and our position-velocity slice shows similar structure (see Figure 4). Larger-scale high resolution studies would be necessary, however, to determine the relative contributions of emission from the nucleus and the surrounding disk.
The strong off-center flux peak located southwest of the nucleus has a molecular mass of (using the Galactic conversion factor), which is % of the total molecular mass. We found the virial mass of this region using the formula , where is the velocity width of the line in km s-1, and pc is the deconvolved diameter of the area in pc. Our value of indicates that we are not observing a gravitationally bound region. The final region we studied was the possible interacting companion galaxy, seen as the northernmost peak of emission in the temperature contour plot (Figure 3). The amount of flux in that area corresponds to a mass of . The virial mass of this region (with pc), , is again significantly higher than the molecular gas mass. Considering our large beam, it is not surprising that we cannot resolve gravitationally bound objects. One surprising result, however, is that if the CO to H2 conversion factor is indeed significantly lower in the central region than the disk, then these off-center peaks have much larger concentrations of molecular gas than does the central starburst. If the end of the bar in Maffei 2 is subject to shock heating, then the standard CO-to-H2 conversion factor may also overestimate the molecular gas in this region (Dickman, Snell, & Schloerb, 1986). However, if the northern-most feature is in fact a dwarf irregular galaxy, it would likely have a sub-solar metallicity, in which case the standard conversion factor would actually result in an underestimate of the molecular gas content in this region (Wilson, 1995).
Table 1 compares the properties of Maffei 2 with two other nearby starburst spiral galaxies, M83 and IC342. We compare published results with our values calculated using the Galactic value of throughout Maffei 2, as this is the procedure that most authors use in their analysis. We also recalculate molecular gas mass estimates for M83 and IC342 using a common CO-to-H2 conversion factor.
M83, a nearly face-on SBc spiral with a pronounced bar, is somewhat larger than Maffei 2 in dynamical mass (Crosthwaite et al., 2002) and has a comparable star-formation rate (Turner & Ho, 1994). It was recently observed in the CO and CO lines using the OTF method at the NRAO 12 m telescope (Crosthwaite et al., 2002). The total mass of molecular gas found for M83 is , or about 5% of its dynamical mass, which is comparable to the value of 4% for Maffei 2. The two galaxies also follow the trend that later-type galaxies have a higher total gas content (Young & Knezek, 1989): Maffei 2 has 5% of its dynamical mass in gas form, while M83 has an impressive 14%. However, the relative contribution of the different phases of the interstellar medium in M83 is quite different from Maffei 2; the ratio of molecular gas to atomic by mass (a distance-independent ratio) is = 0.60 for M83, whereas Maffei 2 has a much higher value of 3.1. Although this is consistent with the findings that early-type spiral galaxies have a larger percentage of gas in molecular form (Young & Knezek, 1989), the difference does seem extreme. We note that the observed HI extent of Maffei 2 is slightly less than the optical extent in the band (Hurt et al., 1996; Buta & McCall, 1999), which is unusual for spiral galaxies that are not in massive galaxy clusters. Perhaps extended, low surface brightness HI emission is present in the outskirts of Maffei 2, where it would be difficult to separate from foreground Galactic HI emission. If so, this additional HI emission would act to reduce the ratio in Maffei 2.
IC 342, another nearby starburst of Hubble type Scd, has also been recently observed in CO (Crosthwaite et al., 2001). Adopting 3.3 Mpc for the distance to IC 342 (Saha et al., 2002), the dynamical mass of IC342 is (Crosthwaite et al., 2001). It has about twice as much atomic gas as molecular gas, resembling more closely the interstellar medium of M83 than Maffei 2. Although the latest-type spiral of the three galaxies, IC342 does not have the largest fraction of gas to overall mass, which is unexpected compared to previous results (Young & Knezek, 1989). More of the available H2 is found in the central regions of Maffei 2 and M83, although all three galaxies have distinct molecular bars.
5 Implications for Star Formation in Maffei 2
We have followed Kennicutt (1989) in analyzing the stability of the gas disk at different annular radii. Assuming a thin isothermal gas disk, the critical gas surface density is given by (Toomre, 1964; Cowie, 1981)
where is the velocity dispersion of the gas, is the epicyclic frequency, and is the stability constant. We adopt the values and as in the analysis of Kennicutt (1989). Wang & Silk (1994) have noted that the presence of a stellar disk increases the stability of the gas. Using their formalism, Martin & Kennicutt (2001) calculate that, where the stellar survace density is high, this formula may overestimate by up to a factor of three.
We calculated using the form of V(r) calculated in Hurt et al. (1996) and substituting into the relation
The velocity fit for the HI rotation curve is
where km s-1 at a radius of . (Our form differs from the one in Hurt et al. (1996) by a factor of 3 to let and to agree with the original form in Brandt & Scheer (1965).) The final equation we derived for the critical density, assuming a distance of 3.47 Mpc, is
We used the HI data from Hurt et al. (1996) to find the HI column density at different annuli (Figure 6 of their paper). was found by averaging the CO flux at elliptical annuli, using the parameters for inclination and position angle commonly assumed for Maffei 2 (; PA ). We added the molecular column density to to find a total column density N, where the factor 1.36 adds in the contribution from helium. In our analysis, we initially use the standard Galactic conversion factor for each radius; we subsequently investigate the effect of adopting a smaller conversion factor in the central starburst region.
Figure 5a shows a plot of the total gas surface density and the critical density versus radius. In the regions where , the disk should be unstable to gravitational perturbations and is likely to be actively forming stars. lies above the critical limit at every radius that CO is observed, out to about , or 4.7 kpc. The “hump” in the observed gas density curve between about and represents the region where the majority of the HI resides in a large ring outside of the central region. Molecular emission is negligible outside (4.7 kpc), where HI becomes the dominant contributor to the total gas surface density; as dips below the critical limit in this area, the disk should be stable and we would not expect to find much star formation. It is interesting that our values of all lie very close to the critical limit, to within a factor of , a tendency which has been found for other galactic disks (Kennicutt, 1989). Although the model we have used in calculating is somewhat simplified, it seems to reproduce the observed gas surface density quite well.
The new result for a modified conversion factor in the central region leads to a slightly different conclusion (see Figure 5b). The gas density in the center appears to be below the critical density, thus indicating that star formation should happen mainly outside the central region. This result clearly does not fit well with the observations that indicate Maffei 2 is undergoing a nuclear starburst. However, the rotation curve calculated by Hurt et al. (1996) was noted to be uncertain inside a radius of 100′′, which encompasses the majority of molecular gas, including the nucleus. Although it may be hard to fit a rotation curve to the central regions of the galaxy, where non-circular orbits may be dominant, a modified velocity fit in the center could rectify the stability analysis in this region. It is also possible that the central region is at a different inclination than the disk of the galaxy; such a warp could change the rotation curve enough to fit the gas density profile. Finally, the central region has the highest stellar surface density and thus is most likely to be overestimated in this region given our simple analysis (Wang & Silk, 1994).
However, we can explore the central dynamics somewhat further using recent observations. Israel & Baas (2003) use their high excitation CO observations to estimate the velocity gradient in the central region of Maffei 2. Correcting the observed value of 18 km s for the inclination of the galaxy, we find km skpc. Assuming that the rotation curve is linear, the critical density in the inner radius would be ; including the effect of stars would decrease the value of by perhaps a factor of three (Martin & Kennicutt, 2001). This critical density is much larger than the average gas surface density we find in the central region. However, we note that the molecular gas in the central region appears to reside in two kinematically-distinct peaks rather than in a single central source. One possible explanation for the observed central starburst is that there is a change in the rotation curve just past , where the gas collects and becomes gravitationally unstable. Such “twin peaks” have been found in other barred galaxies, and can be explained by orbit crowding near inner Lindblad resonances (Kenney et al., 1992). Even if there is no change in the rotation curve, the gas could attain sufficient surface densities to be unstable if it is concentrated into a few compact regions within this region. Such a model could easily be tested with existing millimeter interferometers.
6 Summary
A complete CO map of Maffei 2 reveals a total molecular mass of . The central starburst region produces a large fraction of the CO flux, but may not contain a similar portion of the molecular gas mass if the CO-to-H2 conversion factor is smaller in this region (Israel & Baas, 2003). The CO integrated intensity map is asymmetric, with the south-west portion of the bar much brighter than the north-east half; however, the distribution of the peak brightness temperature is much more symmetric. If the smaller conversion factor from the study of Israel & Baas (2003) is correct, our analysis leads to the surprising result that three CO peaks in the outer disk of Maffei 2 each contain more molecular gas than does the central starburst. A global comparison with two other nearby starburst galaxies reveals that Maffei 2 is rich in molecular gas, although its total gas content (atomic plus molecular) accounts for a smaller fraction of the dynamical mass in Maffei 2 than in M83 or IC 342.
We have examined the dynamical stability of the gas disk following the method in Kennicutt (1989). The results of the analysis depend heavily on the value of the CO-to-H2 conversion factor adopted for the central region. If we adopt the standard Galactic conversion factor across the disk of Maffei 2, then the gas surface density is greater than the critical density throughout the molecular disk. On the other hand, if a smaller value for the conversion factor is appropriate for the starburst nucleus, then the gas disk is found to be dynamically unstable and hence prone to star formation only in the large HI ring which lies from the center of the galaxy. However, we note that the rotation curve is poorly determined precisely for the central regions where the conflict between the stability analysis and the observed starburst is most apparent.
Both the CO integrated intensity and peak brightness temperature maps reveal extended emission to the north of Maffei 2 in the region of a possible tidal feature first identified in the infrared by Hurt et al. (1993a). The presence of CO emission suggests that this putative companion is more likely to be a dwarf irregular rather than a dwarf elliptical galaxy as suggested by Hurt et al. (1996). Although the CO data are also consistent with this emission originating in an extended spiral arm, the asymmetry observed in Maffei 2 at a variety of wavelengths lends support to the merger hypothesis.
References
- Brandt & Scheer (1965) Brandt, J. C. & Scheer, L. S. 1965, AJ, 70, 471
- Buta & McCall (1999) Buta, R. J. & McCall, M. L. 1999, ApJS, 124, 33
- Cowie (1981) Cowie, L. L. 1981, ApJ, 245, 66
- Crosthwaite et al. (2001) Crosthwaite, L. P., Turner, J. L., Hurt, R. L., Levine, D. A., Martin, R. N., & Ho, P. T. P. 2001, AJ, 122, 797
- Crosthwaite et al. (2002) Crosthwaite, L. P., Turner, J. L., Buchholz, L., Ho, P. T. P., & Martin, R. N. 2002, AJ, 123, 1892
- Dahmen et al. (1998) Dahmen, G., Huttemeister, S., Wilson, T. L., & Mauersberger, R. 1998, A&A, 331, 959
- Dickman et al. (1986) Dickman, R. L., Snell, R. L., & Schloerb, F. P., 1986, ApJ, 309, 326
- Fingerhut et al. (2002) Fingerhut, R. L., 2002, M.Sc. thesis, York University
- Ho et al. (1990) Ho, P. T. P., Beck, S. C., & Turner, J. L. 1990, ApJ, 349, 57
- Hurt & Turner (1991) Hurt, R. L. & Turner, J. L. 1991, ApJ, 377, 434
- Hurt et al. (1993a) Hurt, R. L., Merrill, K. M., Gatley, I., & Turner, J. L. 1993a, AJ, 105, 121
- Hurt et al. (1988) Hurt, R., Turner, J., & Ho, P. 1988, BAAS, 20, 1082
- Hurt et al. (1996) Hurt, R. L., Turner, J. L., & Ho, P. T. P. 1996, ApJ, 466, 135
- Hurt et al. (1993b) Hurt, R. L., Turner, J. L., Ho, P. T. P., & Martin, R. N. 1993b, ApJ, 404, 602
- Ishiguro et al. (1989) Ishiguro, M., et al. 1989, ApJ, 344, 763
- Israel & Baas (2001) Israel, F. P. & Baas, F. 2001, A&A, 371, 433
- Israel & Baas (2003) Israel, F. P. & Baas, F. 2003, A&A, 404, 495
- Kenney et al. (1992) Kenney, J. D. P., Wilson, C. D., Scoville, N. Z., Devereux, N. A., & Young, J. S. 1992, ApJ, 395, L79
- Kennicutt (1989) Kennicutt, R 1989, ApJ, 344, 685
- Krismer et al. (1995) Krismer, M., Tully, R. B., & Gioia, I. M. 1995, AJ, 110, 1584
- Martin & Kennicutt (2001) Martin, C. L., & Kennicutt, R. C., 2001, ApJ, 555, 301
- Oka et al. (1998) Oka, T., Hasegawa, T., Sato, F., Tsuboi, M., & Miyazaki, A. 1998, ApJS, 118, 455
- Rickard & Harvey (1983) Rickard, L. J. & Harvey, P. M. 1983, ApJ, 268, L7
- Rickard et al. (1977) Rickard, L. J., Turner, B. E., & Palmer, P. 1977, ApJ, 218, L51
- Saha et al. (2002) Saha, A., Claver, J., & Hoessel, J. G., 2002, AJ, 124, 839
- Sakamoto et al. (1999) Sakamoto, K., Okumura, S. K., Ishizuki, S., & Scoville, N. Z. 1999, ApJ, 525, 691
- Sargent et al. (1985) Sargent, A. I., Sutton, E. C., Masson, C. R., Lo, K. Y., & Phillips, T. G. 1985, ApJ, 289, 150
- Scoville & Sanders (1987) Scoville, N. Z. & Sanders, D. B. 1987, in ASSL Vol. 134: Interstellar Processes, 21
- Seaquist et al. (1976) Seaquist, E. R., Pfund, J., & Bignell, R. C. 1976, A&A, 48, 413
- Sodroski et al. (1995) Sodroski, T. J., et al. 1995, ApJ, 452, 262
- Spinrad et al. (1971) Spinrad, H., et al. 1971, ApJ, 163, L25
- Spinrad et al. (1973) Spinrad, H., Bahcall, J., Becklin, E. E., Gunn, J. E., Kristian, J., Neugebauer, G., Sargent, W. L. W., & Smith, H. 1973, ApJ, 180, 351
- Toomre (1964) Toomre, A. 1964, ApJ, 139, 1217
- Turner & Ho (1994) Turner, J. L. & Ho, P. T. P. 1994, ApJ, 421, 122
- Wang & Silk (1994) Wang, B. & Silk, J., 1994, ApJ, 427, 759
- Weliachew et al. (1988) Weliachew, L., Casoli, F., & Combes, F. 1988, A&A, 199, 29
- Wilson (1995) Wilson, C. D. 1995, ApJ, 448, L97
- Wilson & Scoville (1989) Wilson, C. D. & Scoville, N. 1989, ApJ, 347, 743
- Young & Knezek (1989) Young, J. S. & Knezek, P. M. 1989, ApJ, 347, L55
- Young & Scoville (1991) Young, J. S. & Scoville, N. Z. 1991, ARA&A, 29, 581
| Property | Maffei 2 | M83 | IC342 |
|---|---|---|---|
| Hubble-type | SBb | SBc | Scd |
| Distance (Mpc) | 3.47 | 4 | 3.3 |
| 3.1 | 0.6 | 0.5 | |
| 0.1 | 0.1 | 0.05 | |
| 0.04 | 0.05 | 0.02 | |
| 0.05 | 0.14 | 0.05 |