Two New X-ray/Optical/Radio Supernova Remnants in M31
Abstract
We compare a deep (37 ks) Chandra ACIS-S image of the M31 bulge to Local Group Survey narrow-band optical data and Very Large Array (VLA) radio data of the same region. Our precisely registered images reveal two new optical shells with X-ray counterparts. These shells have sizes, [S II]/H flux ratios, and X-ray spectral properties typical of supernova remnants (SNRs) with ages of 9 and 17 kyr. Analysis of complementary VLA data reveals the radio counterparts, further confirming that they are SNRs. We discuss and compare the properties and morphologies of these SNRs at the different wavelengths.
1 Introduction
The high-spatial resolution of the Chandra X-ray Observatory is allowing supernova remnants (SNRs) in M31 to be resolved at X-ray wavelengths for the first time (Kong et al., 2002a; Kong et al., 2003). These detections provide the first opportunity to perform resolved multi-wavelength studies of SNRs in M31. Studies of these extragalactic SNRs avoid several difficulties that hinder Galactic studies, such as unreliable distances, large angular sizes, and high Galactic absorption. Multi-wavelength studies of these SNRs allow reliable comparative size analyses for future determinations of supernova rates and open the door to detailed studies of supernova feedback in M31.
Optical emission-line surveys of M31 date back to Rubin et al. (1972), and X-ray surveys back to van Speybroeck et al. (1979). Without digital imaging to allow the subtraction of continuum emission from the emission-line images and without high spatial resolution X-ray data, reliable determination of counterparts was difficult for these early surveys. While optical surveys continued to catalog hundreds of SNRs in M31 (e.g. Braun & Walterbos, 1993; Magnier et al., 1995; Williams et al., 1995), ROSAT studies had little luck in discovering X-ray SNRs in M31 (Magnier et al., 1997).
Very recently, with deep Chandra and XMM images of M31, finding X-ray counterparts of optical SNRs has become more feasible. Kong et al. (2002a) found a previously-known optical SNR that was well-resolved in Chandra images. Later, Kong et al. (2003) found 2 previously-unclassified SNRs that were resolved in X-ray, optical, and radio images.
Herein we report the discovery of 2 more SNRs in M31, found by comparing narrow-band images from the Local Group Survey (LGS; Massey et al., 2001) to a precision-aligned, deep Chandra image. One object, CXOM31 J004248.9+412406 (r3-84), R.A.=00:42:48.97, Dec.=+41:24:06.9 (J2000), coincides with one of the two SNR candidates reported independently by Trudolyubov & Priedhorsky (2004) (XMMU J004249.1+412407). The second object, CXOM31 J004224.1+411733 (r2-57), R.A.=00:42:24.16, Dec.=+41:17:33.6 (J2000), also has the X-ray, optical, and radio properties of an SNR and has not been reported elsewhere. Section 2 describes the data and analysis techniques used. Section 3 discusses the X-ray, optical and radio properties of the SNRs, and section 4 provides a summary of our conclusions.
2 Data Analysis
2.1 Optical Data
We obtained the [O III], [S II], H and -band images of the LGS field 5 from the LGS website.111http://www.lowell.edu/massey/lgsurvey These images have already been properly flat-fielded and the geometric distortions removed so that the coordinates in the images are good to 0.25′′ on the FK5 system and the images at the different bandpasses are registered with one another. We therefore were easily able to subtract the -band continuum from the [O III] image and the -band continuum from the [S II] and H images in order to make the line-emitting sources stand out.
We performed a rough calibration of the LGS [O III] image by matching the [O III] fluxes of 10 planetary nebulae (PNe) with published [O III] fluxes (Ciardullo et al., 1989). This calibration provided a conversion factor of 5.5 erg cm-2 ct-1. We also roughly calibrated the H and [S II] images by matching the fluxes of the SNR DDB 1-15 (D’Odorico et al., 1980) to the fluxes measured in the calibrated data set of Williams et al. (1995) (H ; [S II] = 5.5 ). This calibration yielded conversion factors of 1.0 erg cm-2 ct-1 and 1.8 erg cm-2 ct-1 in H and [S II] respectively. Using these [O III], H, and [S II] factors, we converted the LGS count rates to units of .
2.2 X-ray Data
We also obtained a deep Chandra ACIS-S image centered on the M31 nucleus (ObsID 1575). This data set, obtained on 05-Oct-2001, had an exposure time of 37.7 ks, target R.A.=00:42:44.4, target Dec.=41:16:08.3, and a roll angle of 180.42 degrees. We created exposure maps for this image using the CIAO script merge_all,222http://cxc.harvard.edu/ciao/download/scripts/merge_all.tar and we found and measured positions for the sources in the image using the CIAO task wavdetect.333http://cxc.harvard.edu/ciao3.0/download/doc/detect_html_manual/Manual.html This processing identified sources in the image down to a flux limit of 8 10-16 assuming an absorbed power-law spectrum with slope 1.7 and cm2, or a (unabsorbed) luminosity limit of 7 1034 in M31, assuming a distance of 780 kpc (Stanek & Garnavich, 1998; Williams, 2003).
2.2.1 X-ray/optical Image Alignment
We aligned the coordinate system of the ACIS-S image with the LGS coordinate system by translating and adjusting the plate scale of the ACIS-S coordinate system so that 13 globular cluster sources had the same coordinates as the centroids of the respective globular clusters in the LGS -band image. This transformation, performed using the IRAF444IRAF is distributed by the National Optical Astronomy Observatory, which is operated by the Association of Universities for Research in Astronomy, Inc., under cooperative agreement with the National Science Foundation. task ccmap, had root-mean-square (rms) residuals of 0.16′′ in RA and 0.15′′ in DEC. These errors were added in quadrature to the position errors of the sources determined by wavdetect to determine the final position errors for X-ray sources on the LGS [O III] image.
2.2.2 X-ray spectra
We extracted energy spectra and the associated responses from the ACIS-S image with the CIAO task psextract555http://cxc.harvard.edu/ciao/ahelp/psextract.html and CALDB version 2.26, which automatically corrects for the degradation in the effective low-energy quantum efficiency of the ACIS detectors. The background spectra were extracted with an annulus region. Since we only have 43 counts (37 background-subtracted) for r2-57 and 37 counts (31 background-subtracted) for r3-84, we used two methods to fit the spectra from 0.3–5 keV.
We first binned the spectra with 5 counts per bin and employed -Gehrels statistics to find the best fit using the CIAO 3.0/Sherpa fitting package (Freeman et al., 2001). Errors were estimated using the Sherpa command projection,666http://cxc.harvard.edu/ciao/ahelp/projection.html which varies each parameter’s value independently along a grid of values to determine the 1 confidence intervals.
We fit the spectra with two single-component models with absorption: power-law and Raymond-Smith (RS). The power-law model is commonly a good fit to the continuum of X-ray spectra and has 3 free parameters: index, absorption column, and normalization. The RS model is often used to describe the spectra of SNRs. We applied this model with the abundance parameter fixed to solar and the redshift fixed to zero, leaving 3 free parameters: temperature, absorption column and normalization. Results are discussed in § 3.1.1 and shown in Figure 3. To verify the results, we then fit the unbinned spectra (background not subtracted) with Cash statistics (Cash, 1979).
We further investigated the nature of the X-ray sources by calculating the hardness ratios of the detected counts. These were calculated from counts extracted in 3 different energy bins. The soft bin (S) contains photons of energies 0.3–1 keV. The medium bin (M) contains photons of energies 1–2 keV. The hard bin (H) contains photons of energies 2–8 keV. The final background-subtracted hardness ratio equations were H1 = (M-S)/(H+M+S) and H2 = (H-M)/(H+M+S) (Prestwich et al., 2003). These hardness ratios are discussed in § 3.1.1.
Finally, we checked the results of the Chandra energy spectra with XMM-Newton archival data, since the effective area of XMM-Newton is much larger than that of Chandra. There are four XMM-Newton observations of the center of M31 with exposure times from 10–60 ks. Unfortunately, one of the SNRs (r2-57; see § 2.4) lies too close to the center of M31 to be resolved from the diffuse emission at the resolution of XMM-Newton; we therefore could not perform a reliable spectral fit for any XMM-Newton observation of this SNR.
The other SNR (r3-84; see § 2.4) is in the gap between CCD chips in two of the four XMM-Newton observations. We performed spectral analyses on the other two observations, taken on 29-Jun-2001 (ObsID=0109270101, target R.A.=00:42:43, target Dec.=41:15:46, P.A.=76.05 degrees, medium filter, and exposure=30.6 ks) and 06-Jan-2002 (ObsID=0112570101, target R.A.=00:42:43, target Dec.=41:15:46, P.A.=249.84 degrees, thin1 filter, and exposure=56.5 ks). We extracted the 0.3–5 keV spectra with the XMM-Newton SAS package v5.4.1; only EPIC-pn spectra were considered because of the higher sensitivity.
The spectra were binned to have at least 15 counts per spectral bin in order to allow the use of statistics. Background spectra were extracted from source free regions. The source contained 150 counts (84 background-subtracted) in the 27 ks observation and 314 counts (205 background-subtracted) in the 51 ks observation. Results are discussed in § 3.1.1, and shown in Figure 4.
2.2.3 X-ray PSF Tests
As both of the newly-discovered SNRs are several arcminutes off-axis in the Chandra data, there is a possibility that the larger off-axis point spread function (PSF) of Chandra could be misinterpreted as an extended source in the X-ray image. To test this possibility, we used the SNRs’ spectral fits to simulate their Chandra PSF at their location on the ACIS-S detector. The simulation was performed with the web-based PSF simulator ChaRT777http://cxc.harvard.edu/chart/.
PSF simulations containing about the same number of counts as the detections are shown next to the X-ray SNR detections in Figures 1 and 2. We also produced PSF simulations with 105 counts. Azimuthally averaged profiles of these simulations and of the SNR detections were measured in 1.5′′ annuli. tests of the detected SNRs’ profiles against the simulated PSFs (normalized to the surface brightness of the central 3′′ of the SNR detection) were calculated to assess whether the SNRs were resolved (results in § 3.1.3). The number of counts in each annulus ranged from 1–21 in the SNR detections. Profile errors were determined by Gehrels statistics (Gehrels, 1986) in annuli with 10 counts and by standard Poisson statistics in annuli containing 10 counts. Results are discussed in § 3.1.3.
2.3 Radio Data
The radio data was collected from a 20 cm VLA survey source list presented by Braun (1990) complemented by a recent 6 cm VLA B-array observation (Sjouwerman et al., 2004). We also retrieved 20 cm low resolution VLA C-array and 6 cm VLA D-array data from the NRAO archive. These data sets, albeit pointed to the center of M31 instead of directly at the SNRs, were the most sensitive data sets to search for arcsecond extended radio counterparts.
Sjouwerman et al. (2004) observed a field-of-view of about 8′ using the VLA at 6 cm for 22 hours on three days in June 2002, obtaining an angular resolution of 1.2′′ and the ability to detect angular structures up to about 35′′. The 20 cm (6 cm) archive VLA data with a field-of-view of about 30′ (8′) in diameter was taken during 20 (19) hours on three (four) days in August 1993 (July 1992), has an angular resolution of 13′′ (14′′) and is sensitive to angular structures up to about 15′ (5′). The data were all calibrated and imaged in NRAO’s AIPS package using the new VLARUN pipeline procedure with additional self-calibration for the 20 cm archive data as outlined in the AIPS Cookbook. The resulting rms noise in the images is 60 (15) Jy for the 20 cm (6 cm) archive data, and 6 Jy for the 6 cm Sjouwerman et al. (2004) data.
Finally, we retrieved 20 cm high resolution (1′′; A-array) VLA data from the NRAO archive to detect any compact components of these SNR candidates. These data consist of eleven pointings in the center and southern half of M31. The data were also calibrated and imaged with the VLARUN pipeline procedure. Images with an rms noise of 0.2 mJy were produced.
2.4 SNR Search
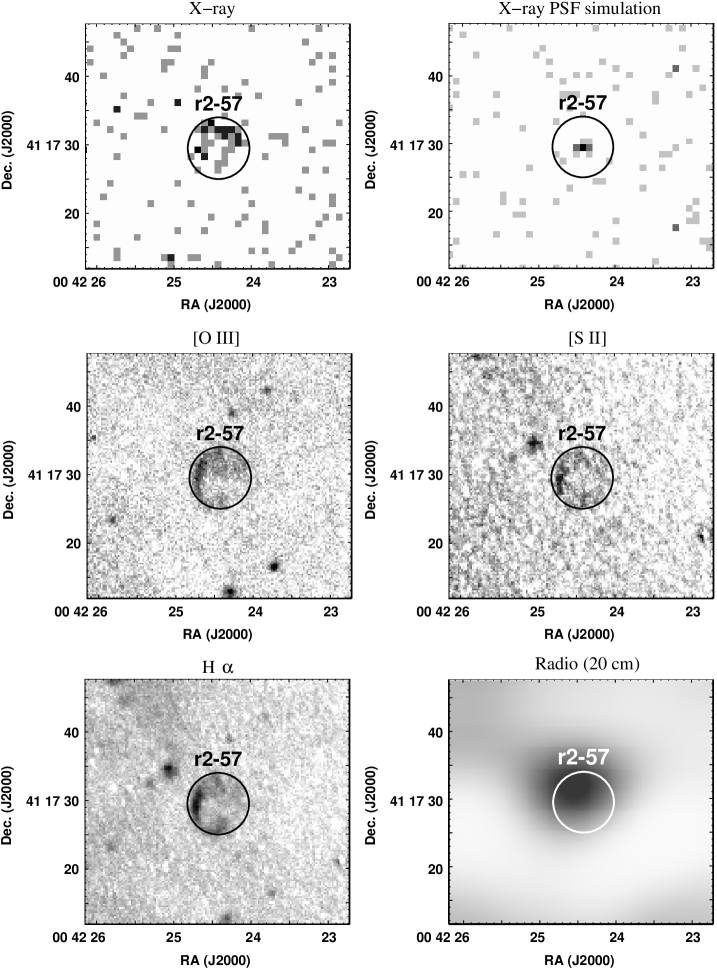
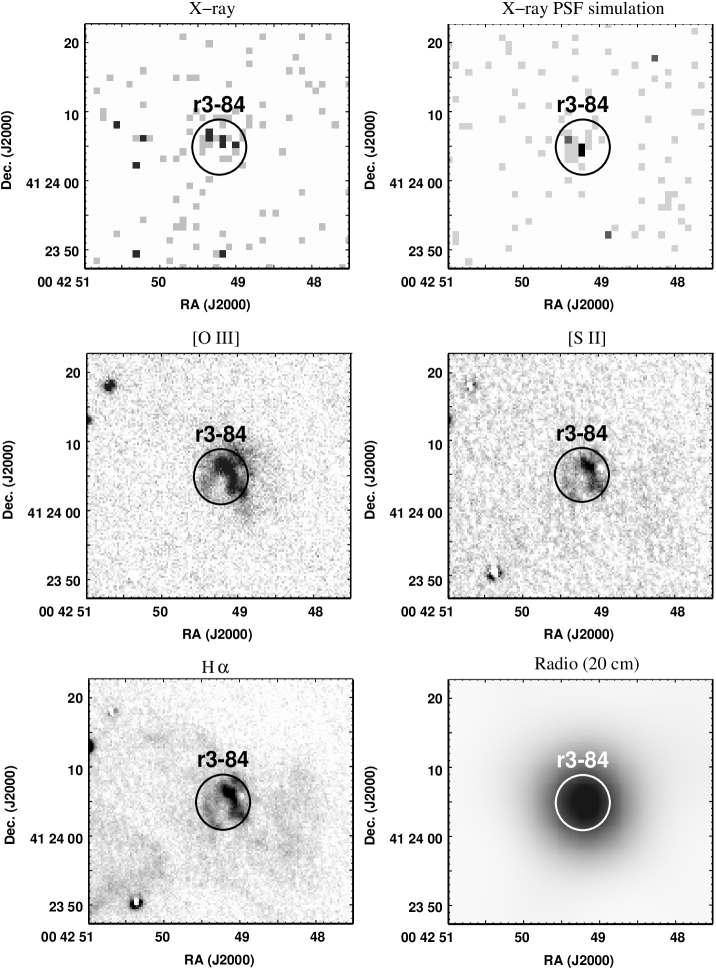
We visually searched the aligned [O III] image for shell structures with X-ray counterparts by placing 2′′ radius circles onto the [O III] image centered on the locations of all X-ray sources detected in the ACIS-S images. This search yielded 5 counterpart candidates, 3 of which have been cataloged as X-ray SNR and were previously discussed in Kong et al. (2002a); Kong et al. (2003). The X-ray images were then inspected at the locations of the two new SNRs. Figures 1 and 2 show the Chandra, H, [O III], [S II], and VLA (low resolution 20 cm) images of each new SNR. These 2 new matches showed previously-cataloged X-ray counterparts: CXOM31 J004224.1+411733 (r2-57) and CXOM31 J004248.9+412406 (r3-84) (Kong et al., 2002b).
Once the two new matches in optical and X-ray were found, radio counterparts were sought for in the list of Braun (1990). Indeed, r3-84 is listed as an extended source (source number 97). Source r2-57 is located near an area of diffuse emission and, although not listed in Braun (1990), is marginally visible in his Figure 3. We therefore also checked our recent 6 cm VLA data (Sjouwerman et al., 2004). The 6 cm data has only a limited field-of-view, with a full-width at half-maximum (FWHM) of 500′′, meaning that r3-84 is too far away from the field center (8′) to be visible. However we found a 10′′ extended 2 patch at the position of r2-57. This triggered a search in the VLA archive for more sensitive data for which we chose the sets discussed in § 2.3. The archive data does confirm a radio detection of r2-57, at 20 cm and at 6 cm, and yields an additional independent radio detection of r3-84 at 20 cm. No other radio matches were found in the literature.
3 Results
3.1 X-ray Properties
3.1.1 Spectral Properties
We were able to constrain the physical properties of both SNRs with their spectra from Chandra and XMM-Newton. Plots of the best fits using the RS model are provided in Figure 3 and 4.
For r2-57, the binned spectrum is well-fit by a power-law model with (1), cm-2 ( for 5 degrees of freedom (dof)) and 0.3–7 keV luminosity of 3.4 erg s-1. The spectrum is also fit well by an RS model with kT = 0.17 keV and = (8.93.2) cm-2 ( for 5 dof) and an absorption-corrected 0.3–7 keV luminosity of 4.3 erg s-1. Fits of the unbinned spectrum give similar results.
In the case of r3-84, a power-law model does not fit the binned spectrum with reasonable parameters; the photon index is 10 suggesting a soft X-ray source. On the other hand, the spectrum is well fit by an RS model with kT keV, = 4 cm-2 ( for 4 dof) and an absorption-corrected 0.3–7 keV luminosity of 2.3 erg s-1.
We checked our Chandra spectral results using the two XMM-Newton spectra of r3-84. These spectra were fit with several single-component models (with absorption) including power-law, RS, non-equilibrium ionization (NEI), and bremsstrahlung models. The NEI and bremsstrahlung models give acceptable fits. The (solar abundance) NEI model has for 19 dof with cm-2, kT keV, and ionization age s cm-3; the modeled unabsorbed 0.3–7 keV luminosity is erg s-1. The best-fitting single-component model is bremsstrahlung; it has for 20 dof with cm-2 and kT keV; the modeled unabsorbed 0.3–7 keV luminosity is (9.42.5) erg s-1.
The overall best-fitting model for the XMM spectra is an RS plus power-law888The single component RS model had , kT keV, and modeled unabsorbed 0.3–7 keV luminosity (73) erg s-1, but it had a poor (1.44 for 20 dof). (see Figure 4). It provides a good fit ( for 18 dof) with cm-2, kT, and power-law slope ; the modeled unabsorbed 0.3–7 keV luminosity is erg s-1. These results are consistent with the Chandra results as well as the temperature and luminosity ranges determined from fits to the XMM data by Trudolyubov & Priedhorsky (2004), but the temperature and luminosity are both significantly lower than those given by the NEI model fit. We use the Chandra temperature results, which are consistent with all of the XMM fits, to calculate age and density estimates in § 3.4.
While these spectral fits do not allow detailed modeling of the sources, they show that the X-ray spectra and luminosities are typical of X-ray SNRs. The softness of the spectra is confirmed by the hardness ratios. For r2-57, H1 = 0.50.2, and H2 = 0.40.1. For r3-84, H1 = 0.60.2, and H2 = 0.20.1; these ratios are typical of SNRs (Prestwich et al., 2003). Neither of these sources contain counts with energies higher than 2 keV, also consistent with typical X-ray SNRs.
3.1.2 Variability
The variability of these X-ray sources has been investigated by Kong et al. (2002b), who found r2-57 to have constant flux. On the other hand, r3-84 was classified as a variable source in their survey, inconsistent with our finding that this source is an SNR. We checked the variability of this source, and it is variable according to their criteria due to a low count rate in one detection. Further inspection of the detection with the low count rate shows that r3-84 is on the edge of the chip, so that some of the source flux could have missed the detector, calling into question the classification of this source as variable.
3.1.3 X-ray Sizes
In addition to the spectrophotometric properties of the SNRs, the Chandra data allow estimates of the SNRs’ sizes. The X-ray detection of r3-84 appears as a very faint shell structure 6′′ across. Though the structure appears to be this size in the detection, the Chandra PSF 8′ off axis (where this detection of r3-84 is located) has a FWHM of 4.1′′ according to our ChaRT simulation (see § 2.2.3). A comparison of the azimuthally averaged profile of our detection of r3-84 against the azimuthally averaged simulated PSF at the same location in the Chandra focal plane yields a of 9.2/4, leaving only a 5.6% chance that this object is a point source. The X-ray simulation, X-ray image, optical images, and radio image of the source are shown on the same scale, with circles of 8′′ diameter in Figure 2. The X-ray size is very similar to that of the optical (and the low resolution radio) counterpart.
The X-ray detection of r2-57 also appears as a very faint shell structure, but at 8.5′′ across and 4′ off-axis (where the ACIS-S point spread function is 1.4′′ according to our ChaRT simulation), this source is clearly resolved. The PSF simulation (see § 2.2.3) shows no similarity to the shell-like source detection; a comparison of the azimuthally averaged profile of our detection of r2-57 against the azimuthally averaged simulated PSF at the same location in the Chandra focal plane yields a of 28.1/4, leaving a probability of 10-5 that this object is a point source. The X-ray simulation, X-ray image, optical images, and radio image of the source are shown on the same scale, with circles of 9′′ diameter in Figure 1.
3.2 Optical Properties
The narrow-band LGS images provided estimates of the H, [S II], and [O III] luminosities of these SNR, as well as the SNR sizes. The relative strength of these emission lines is a well-known diagnostic for distinguishing shock-heated SNRs from photo-ionized H II regions and planetary nebulae (e.g. Levenson et al., 1995). In addition, the SNR sizes and structures help to constrain their ages (e.g. Kong et al., 2002a).
We measured the counts in the narrow-band images using an aperture of 4′′ radius centered on r3-84 and an aperture of 5′′ radius centered on r2-57. The measured H, [S II], and [O III] fluxes, in units of 10-14 erg cm2 s-1 were 1.0, 0.9, and 1.5 for r2-57, respectively, and 1.1, 0.9, and 1.7 for r3-84, respectively. These [S II]/H ratios of 0.9 are strong indications that these objects are SNRs. Typically, SNRs have [S II]/H, while the ratios of H II regions are lower (Levenson et al., 1995).
The [O III]/H ratio must be corrected for absorption because of the large difference in wavelength. We used the values from the X-ray spectral fits (see § 3.1.1) to estimate the reddening values of the SNRs (Predehl & Schmitt, 1995). These values were for r2-57 and for r3-84. Assuming a standard reddening law, for r2-57 and for r3-84, so that the absorption-corrected [O III]/H ratios are factors of 3.2 and 1.7 higher than the measured ratios, for r2-57 and r3-84, respectively. The [O III]/H ratios are therefore 5 and 3 for r2-57 and r3-84, respectively. Such ratios are slightly high, but not unprecedented for SNRs containing a variety of shock velocities 100 km s-1 (e.g. Vancura et al., 1992; Fesen et al., 1997; Mavromatakis et al., 2000).
Finally, we measured the sizes of r2-57 and r3-84 using the ruler option in the image viewing program ds9. The sizes were measured in all three bandpasses. The H sizes were 8.8′′ and 6.6′′ respectively. The [S II] sizes were 8.4′′ and 6.4′′ respectively, and the [O III] sizes were 8.8′′ and 6.2′′, respectively. Combining these measurements yields optical sizes of 8.70.2 (331 pc) and 6.40.2 (241 pc), respectively. These sizes were used to calculate our age and density estimates in § 3.4.
3.3 Radio Properties
Unfortunately the most sensitive radio data available has insufficient resolution and/or sensitivity to obtain more detailed morphologies than the deconvolved sizes.
The deconvolved size of r2-57 at 20 cm is 4.32.8, and 109 at 6 cm. Because r2-57 has been detected at two different wavelengths (20 and 6 cm) with similar ()-coverage, a radio spectral index could be obtained from the integrated flux densities, about 0.250.09 and 0.240.22 mJy at 20 and 6 cm, respectively. Unfortunately, a spectral index taken from such measurements would be unreliable considering the large errors. These large errors are attributable to the weakness of the signals as well as the (unreliable) correction factor for r2-57 at 6 cm due to loss of sensitivity near the half-power point of the antennas. Nevertheless, we conclude that the radio spectral index for r2-57 is not inconsistent with average spectral indices of SNRs.
In the 20 cm VLA archive data we measured an integrated flux density of 1.20.2 mJy and deconvolved size of 8.61.5 for r3-84. In the 20 cm high-resolution archival data, a point source of 0.8 mJy is seen coincident with the brightest region in the lower-resolution data. Because r3-84 is too far away from the phase center in the 6 cm data sets to be detected, we are unable to comment on a spectral index for this source.
3.4 Comparing X-ray/Optical/Radio Morphologies
The similar size measurements for these SNRs at X-ray, optical, and radio wavelengths suggests at first that these SNRs have similar morphologies at all wavelengths. However, in the case of r2-57, the brightest region in all three optical wavelengths is the eastern rim, while the brightest regions in the radio and X-ray images are the north-northeast and northwest parts of the SNR, respectively. Even with this low-count X-ray detection, we can begin to learn about the multi-wavelength structure of this SNR.
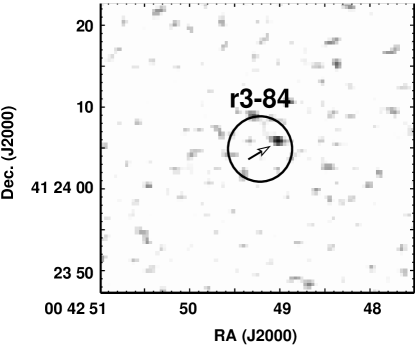
Although the low spatial resolution of the deep radio data limits detailed morphological comparison with the shorter wavelengths, the deconvolved sizes of the SNRs provide some interesting comparisons. The sizes are all consistent within the errors, but the size of r2-57 at 20 cm may be about half the size at 6 cm. If there is a real size difference, we attribute it as likely due to strong 20 cm radiation originating in different areas of the SNR than the 6 cm radiation. The small scale 20 cm structure seen in r3-84 (see Figure 5) hints that this hypothesis is reasonable by showing how these SNRs can have some complex structures at radio wavelengths.
The morphology of r3-84 appears to be more consistent across all wavelengths. While r3-84 is too far off axis and has too few counts to say anything detailed about its X-ray morphology, there is a hint that the northwest portion of the SNR is the brightest region in X-rays. This hint is consistent with the optical SNR, which is brightest in the northwest portion in all 3 narrow-band images. In addition, our high-resolution 20 cm data, shown in Figure 5, reveal that the northwest rim of the SNR houses the brightest radio region, consistent with the X-ray/optical shell.
The deconvolved size of r3-84 is consistent with the 10.0 size given by Braun (1990) and the 8′′ circles shown in Figure 2. This extended emission is not detected in the 1′′ resolution data because the noise level in the high-resolution data (0.1 mJy/beam) is too high. If the 1.2 mJy source detected in the 20 cm low resolution VLA archive data is homogeneously spread over the 8′′ disk, then the average surface flux density would be 0.04 mJy/beam in a 1.4′′ beam. Such emission would be below the noise of the high-resolution data. The radio counterpart of this SNR is comprised of a 10′′ shell with a bright region in the northwestern portion. Therefore, the morphology of this SNR, unlike that of r2-57, appears quite similar at all wavelengths.
As the measured sizes of the SNRs are consistent across all of the observed wavelengths, we can use the sizes and measured temperatures to approximate the ages using the Sedov solution as done in Kong et al. (2002a). We assume the SNRs are in the adiabatic expansion phase.
We adopt radii of 171 pc (r2-57) and 121 pc (r3-84) and shock temperatures of keV (r2-57) and keV (r3-84). We assume an initial explosion energy of (in units of 1051 erg s-1) for both SNRs. This value of is the average value from a sample of M31 SNRs surveyed by spectroscopic observations, bracketed by the range of measured values, ignoring the highest and lowest values (Blair et al., 1981). From equations (1) and (2) of Kong et al. (2002a), we obtain an age estimate of kyr and a density estimate of cm-3 for r2-57. Applying the same calculations to r3-84 yields an age estimate of 9 kyr and a density estimate of cm-3.
4 Conclusions
By comparing Chandra ACIS-S images with Local Group Survey [O III] images, we have discovered 2 new X-ray/optical/radio SNRs in M31. Both of these objects are previously-cataloged X-ray sources. One is a previously-cataloged radio source, and the other is a newly-discovered radio counterpart discovered in our study. One SNR (r2-57) is well resolved in the X-ray images; the other is marginally resolved. These SNRs have emission-line ratios, X-ray spectra, and sizes typical of other SNRs in M31. The temperatures and sizes of the SNRs provide age estimates of kyr (r2-57) and 9 kyr (r3-84).
While these relatively weak X-ray detections have been crucial for the discovery of resolved X-ray SNRs in M31, they have only begun to allow studies of the multi-wavelength structure of these objects. With a total of 5 SNRs resolved by Chandra in X-rays so far, it seems clear that, as deeper X-ray data become available, more of these objects are likely to be discovered and more detailed multi-wavelength morphological and spectral studies can be performed.
We thank John Raymond for advising in the interpretation of the [O III] fluxes. Support for this work was provided by NASA through grant number GO-9087 from the Space Telescope Science Institute and through grant number GO-3103X from the Chandra X-ray Center. MRG acknowledges support from NASA LTSA grant NAG5-10889. The National Radio Astronomy Observatory is a facility of the National Science Foundation operated under cooperative agreement by Associated Universities, Inc.
References
- Blair et al. (1981) Blair, W. P., Kirshner, R. P., & Chevalier, R. A. 1981, ApJ, 247, 879
- Braun & Walterbos (1993) Braun, R., & Walterbos, R. A. M. 1993, A&AS, 98, 327
- Cash (1979) Cash, W. 1979, ApJ, 228, 939
- Ciardullo et al. (1989) Ciardullo, R., Jacoby, G. H., Ford, H. C., & Neill, J. D. 1989, ApJ, 339, 53
- D’Odorico et al. (1980) D’Odorico, S., Dopita, M. A., & Benvenuti, P. 1980, A&AS, 40, 67
- Fesen et al. (1997) Fesen, R. A., Winkler, F., Rathore, Y., Downes, R. . A., & Wallace, D. 1997, AJ, 113, 767
- Freeman et al. (2001) Freeman, P., Doe, S., & Siemiginowska, A. 2001, in Proc. SPIE Vol. 4477, p. 76-87, Astronomical Data Analysis, Jean-Luc Starck; Fionn D. Murtagh; Eds., 76
- Gehrels (1986) Gehrels, N. 1986, ApJ, 303, 336
- Kong et al. (2002a) Kong, A. K. H., Garcia, M. R., Primini, F. A., & Murray, S. S. 2002a, ApJ, 580, L125
- Kong et al. (2002b) Kong, A. K. H., Garcia, M. R., Primini, F. A., Murray, S. S., Di Stefano, R., & McClintock, J. E. 2002b, ApJ, 577, 738
- Kong et al. (2003) Kong, A. K. H., Sjouwerman, L. O., Williams, B. F., Garcia, M. R., & Dickel, J. R. 2003, ApJ, 590, L21
- Levenson et al. (1995) Levenson, N. A., Kirshner, R. P., Blair, W. P., & Winkler, P. F. 1995, AJ, 110, 739
- Magnier et al. (1997) Magnier, E. A., Primini, F. A., Prins, S., van Paradijs, J., & Lewin, W. H. G. 1997, ApJ, 490, 649
- Magnier et al. (1995) Magnier, E. A., Prins, S., van Paradijs, J., Lewin, W. H. G., Supper, R., Hasinger, G., Pietsch, W., & Truemper, J. 1995, A&AS, 114, 215
- Massey et al. (2001) Massey, P., Hodge, P. W., Holmes, S., Jacoby, G., King, N. L., Olsen, K., Saha, A., & Smith, C. 2001, in American Astronomical Society Meeting, Vol. 199, 13005
- Mavromatakis et al. (2000) Mavromatakis, F., Papamastorakis, J., Paleologou, E. V. ., & Ventura, J. 2000, A&A, 353, 371
- Predehl & Schmitt (1995) Predehl, P., & Schmitt, J. H. M. M. 1995, A&A, 293, 889
- Prestwich et al. (2003) Prestwich, A. H., Irwin, J. A., Kilgard, R. E., Krauss, M. I., Zezas, A., Primini, F., Kaaret, P., & Boroson, B. 2003, ApJ, 595, 719
- Rubin et al. (1972) Rubin, V. C., Krishna Kumar, C., & Ford, W. K. J. 1972, ApJ, 177, 31
- Sjouwerman et al. (2004) Sjouwerman, L. O., et al. 2004, in prep.
- Stanek & Garnavich (1998) Stanek, K. Z., & Garnavich, P. M. 1998, ApJ, 503, L131
- Trudolyubov & Priedhorsky (2004) Trudolyubov, S., & Priedhorsky, W. 2004, in X-ray and Radio Connections, L. O. Sjouwerman; K. K. Dyer; Eds., in press (astro-ph/0404586; http://www.aoc.nrao.edu/events/xraydio)
- van Speybroeck et al. (1979) van Speybroeck, L., Epstein, A., Forman, W., Giacconi, R., Jones, C., Liller, W., & Smarr, L. 1979, ApJ, 234, L45
- Vancura et al. (1992) Vancura, O., Blair, W. P., Long, K. S., & Raymond, J. C. 1992, ApJ, 394, 158
- Williams (2003) Williams, B. F. 2003, AJ, 126, 1312
- Williams et al. (1995) Williams, B. F., Schmitt, M. D., & Winkler, P. F. 1995, in American Astronomical Society Meeting, Vol. 27, 883