An Optical and X-ray Examination of Two Radio Supernova Remnant Candidates in 30 Doradus
Abstract
The giant H II region 30 Doradus is known for its violent internal motions and bright diffuse X-ray emission, suggesting the existence of supernova remnants (SNRs), but no nonthermal radio emission has been detected. Recently, Lazendic et al. compared the H/H and radio/H ratios and suggested two small radio sources to be nonthermal and thus SNR candidates; however, no optical or X-ray counterparts were detected. We have used high-resolution optical images and high-dispersion spectra to examine the morphological, spectral, and kinematic properties of these two SNR candidates, and still find no optical evidence supporting their identification as SNRs. We have also determined the X-ray luminosities of these SNR candidates, and find them 1–3 orders of magnitude lower than those commonly seen in young SNRs. High extinction can obscure optical and X-ray signatures of an SNR, but would prohibit the use of a high radio/H ratio to identify nonthermal radio emission. We suggest that the SNR candidate MCRX J053831.8690620 is associated with a young star forming region; while the radio emission originates from the obscured star forming region, the observed optical emission is dominated by the foreground. We suggest that the SNR candidate MCRX J053838.8690730 is associated with a dust/molecular cloud, which obscures some optical emission but not the radio emission.
1 Introduction
The giant H II region 30 Doradus is a site of active star formation. A range of stellar ages are present in 30 Dor (Walborn & Blades, 1997), from enshrouded proto-stars (Rubio et al., 1998; Walborn et al., 1999, 2002; Brandner et al., 2001) through the 2-5 Myr old R136 cluster (Hunter et al., 1995; Selman et al., 1999) to the 20-25 Myr old Hodge 301 cluster (Grebel & Chu, 2000). The powerful ionizing flux from the young prominent R136 cluster makes 30 Dor the most luminous H II region in the entire Local Group. Fast stellar winds from the current-generation massive stars and supernova explosions from the former-generation massive stars have accelerated the interstellar medium (ISM) to high velocities with = 100–300 km s-1 and heated the ISM to X-ray-emitting temperatures (Chu & Kennicutt, 1994; Wang, 1999). While the observed diffuse X-ray emission and violent gas motion provide ample evidence for the existence of supernova remnants (SNRs) in 30 Dor, radio observations were unable to confirm the SNRs through spectral indices because of the overwhelming background thermal emission.
The existence of nonthermal radio emission superposed on thermal emission may be diagnosed from comparisons between radio continuum and hydrogen Balmer line emission. In H II regions the radio free-free emission and optical recombination line emission orginate from different mechanisms but make use of a common population of free electrons, while in SNRs the radio synchrotron emission and the optical recombination lines originate from both different materials and different mechanisms. The ratio of radio continuum to recombination line emission is much higher in SNRs than in H II regions; therefore, the existence of nonthermal radio emission can be diagnosed by a high radio/H flux ratio if the foreground extinction is low, e.g., N66 in the Small Magellanic Cloud (Ye et al., 1991).
Using a 13-cm radio map and an H image of 30 Dor, Dickel et al. (1994) found two regions with radio/H ratios 20 times higher than average and suggested that they represented an extra extinction of 3.3 mag. Recently, Lazendic et al. (2003) re-examined the radio/H ratios with a higher angular resolution at 3 cm and 6 cm, and used H and H images to make an independent assessment of the extinction. They identified four regions with high radio/H ratios but low H/H ratios or weak H emission. Two of these regions, corresponding to the ones identified by Dickel et al. (1994), were suggested to be SNR candidates; the remaining two were suggested to be young H II regions because they were coincident with previously identified proto-stellar objects (Lazendic et al., 2003). Note however that 30 Dor consists of a complex mixture of gas and dust and that the observed optical emission is inevitably biased toward regions on the near side of dust clouds; therefore, the extinction determined from the H/H ratios may not represent that of radio sources behind the dust. It is thus necessary to ascertain the co-spatiality of the radio and optical emission for SNR candidates identified by high radio/H and low H/H ratios, and to critically assess their nature at other wavelengths.
We will refer to the two radio SNR candidates in 30 Dor, MCRX J053831.8690620 and MCRX J053838.8690730, as candidates 1 and 2, respectively, throughout the rest of the paper. These two SNR candidates are small; their radio sizes, 10′′ and 8′′, correspond to 2.5 and 2 pc at the Large Magellanic Cloud (LMC) distance of 50 kpc. They show compact rather than shell structures at radio wavelengths and show no bright X-ray emission over the background. These properties are uncommon among known SNRs in the LMC or the Galaxy, but are similar to the compact radio SNR candidates found in distant starburst galaxies, such as M82 (Muxlow et al., 1994). Lazendic et al. (2003) argued that the complex interstellar environment in a giant H II region smothered the other SNR signatures111Lazendic et al. (2003) misprinted the UV absorption lines reported by Chu et al. (1994) as forbidden lines in their §4.1..
We have analyzed high-resolution optical images and spectra of the two radio SNR candidates in 30 Dor, but found no supporting evidence for their identification as SNRs. We have also derived their X-ray luminosities and find values low for young shell-type SNRs. This paper reports our optical and X-ray examination of the two radio SNR candidates in 30 Dor: §2 describes the observations used in our analysis, §3 discusses the optical morphologies, spectral properties, and kinematics of these SNR candidates; §4 provides an X-ray test of the SNR candidacy, and §5 summarizes our conclusions.
2 Optical and X-ray Observations
We have made use of archival Hubble Space Telescope (HST) WFPC2 images of 30 Dor taken with the H 6563 (F656N), [O III] 5007 (F502N), and [S II] 6717, 6731 (F673N) filters on 1994 January 2 with a total exposure time of 1000 s in each filter. These images were previously reported in detail by Scowen et al. (1998). We processed and calibrated these data using standard IRAF/STSDAS procedures as described by Chen et al. (2000). In addition, we have used the filter curves to determine the transmission appropriate for the 300 km s-1 red-shift of 30 Dor and used spectrophotometrically determined [N II]/H ratios (Mathis et al., 1985) to determine the contamination of the [N II] 6548 line to the H image. No corrections are needed for the [O III] and [S II] fluxes because the F502N and F673N filters are flat, but a net correction of +6% is needed for the H flux owing to the sloping filter curve and the [N II] contamination.
We have also used high-dispersion long-slit spectra obtained with the echelle spectrograph on the 4m telescope at Cerro Tololo Inter-American Observatory to study kinematic properties of the SNR candidates. The echelle observations of SNR candidate 1 were taken on 1995 January 20 at offsets of 15′′ and 18′′ south of R136; the instrumental setup has been described by Points et al. (1999). Roughly, the data cover both the H and [N II] 6548, 6584 lines with an instrumental FWHM of 16 km s-1 and an image scale of 3.75 km s-1 pixel-1 along the dispersion and 0267 pixel-1 along the slit. The observation that covered SNR candidate 2 was obtained on 1988 January 8 and belonged to the data set used by Chu & Kennicutt (1994) to study the kinematic structure of 30 Dor. This earlier observation used a different camera and CCD, resulting in an instrumental FWHM of 18 km s-1 and an image scale of 9.6 km s-1 pixel-1 along the dispersion and 0635 pixel-1 along the slit. A slit width of 250 m (164) was used for all echelle observations.
An archival Chandra ACIS-I GTO observation (Obs ID: 62520; PI: G. Garmire) of 30 Dor was also used in this paper. The observation was made on 1999 September 21 for an exposure time of 25.5 ks. The data were kindly provided to us by L. Townsley. Details of this observation will be reported in a paper by Townsley et al. (2004, in preparation).
3 Morphological, Spectral, and Kinematic Properties
Optical signatures of SNRs vary according to their origins, interstellar and stellar environments, and evolutionary stages. We will discuss the physical significance of the morphological and spectral signatures of SNRs and use the archival HST WFPC2 images to assess the nature of SNR candidates 1 and 2 in 30 Dor. We will also use the echelle spectra to search for high-velocity features as an indication of SNR shocks.
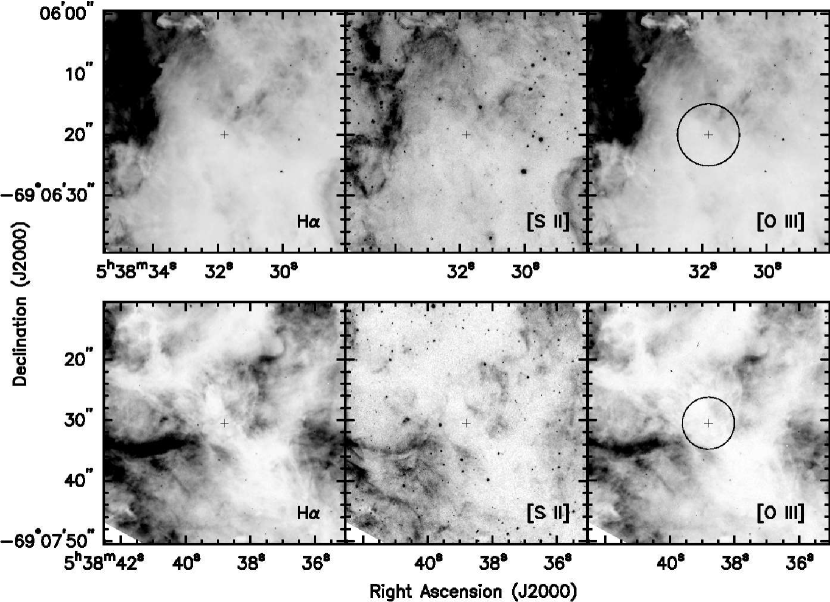
Figure 1 shows HST WFPC2 images of the two SNR candidates in the H, [S II] 6716, 6731, and [O III] 5007 lines. No distinct nebular features, such as shells, are seen at the positions of the SNR candidates. An ionized SNR shell morphology is visible only if the ambient medium is sufficiently dense in most directions. The threshold ambient hydrogen density can be estimated from the detection limit of the emission measure, , where is the electron density of the SNR shell material and is the line-of-sight length of the emitting region. Assuming an adiabatic SNR shock (so that ) and adopting the SNR radius as an order-of-magnitude approximation for , the threshold ambient density becomes 0.25 (emission measure/radius)1/2. The WFPC2 H image has been used to measure surface brightnesses. In the region of SNR candidate 1, the H surface brightness is ergs cm-2 s-1 arcsec-2, and the 3 detection limit above this background is ergs cm-2 s-1 arcsec-2. In the region of SNR candidate 2, the H surface brightness is ergs cm-2 s-1 arcsec-2, and the 3 detection limit above this background is ergs cm-2 s-1 arcsec-2. As the H surface brightness SB(H) = ergs cm-2 s-1 arcsec-2 for in units of cm-3 and in pc, these 3 detection limits correspond to emission measures of and cm-6 pc, respectively. The SNR candidates have radii of 1.25 pc and 1.0 pc, and thus both have a threshold of 25 H-atom cm-3. If these candidates were SNRs in a dense medium with H-atom cm-3 as derived by Lazendic et al. (2003) from their sizes, they should have shown visible shell structures in the HST WFPC2 H images displayed in Figure 1. The implication of the lack of H shell morphology depends on whether the optical emission is co-spatial with the radio sources or not. If they are co-spatial, the lack of visible shell structure raises doubts as to the SNR nature of the candidates. On the other hand, if the optical emission is dominated by a foreground component, then the H/H ratio is irrelevant to the interpretation of the radio sources. In either case, the existence of SNRs is not justified.
An SNR can be spectroscopically diagnosed by (1) a high [S II]/H ratio, e.g., 0.45 (Matonick & Fesen, 1997), if the SNR is not in a hard ultraviolent radiation field and the SNR is old enough for sulfur to become collisionally ionized to S+ in the post-shock region; (2) bright broad oxygen lines with no hydrogen Balmer line counterparts, if the SNR is young and dominated by O-rich supernova ejecta (e.g., Kirshner & Blair, 1980); or (3) hydrogen Balmer lines with an absence of forbidden lines such as [O I], [O III], and [S II], if the SNR is produced by a Type Ia supernova and the SNR interacts with a neutral ISM (Chevalier et al., 1980). Using the HST WFPC2 images, we have measured the H, [O III], and [S II] fluxes within 10′′- and 8′′-diameter apertures that correspond to the radio source sizes of SNR candidates 1 and 2. We find [S II]/H ratios of 0.090.01 and 0.100.01 and [O III]/H ratios of 1.10.1 and 0.510.04 for SNR candidates 1 and 2, respectively. Similar line ratios are present in surrounding regions, and these ratios are typical for an H II region photoionized by early-type O stars. Therefore, the optical emission toward the two SNR candidates does not show line ratios indicative of SNRs.
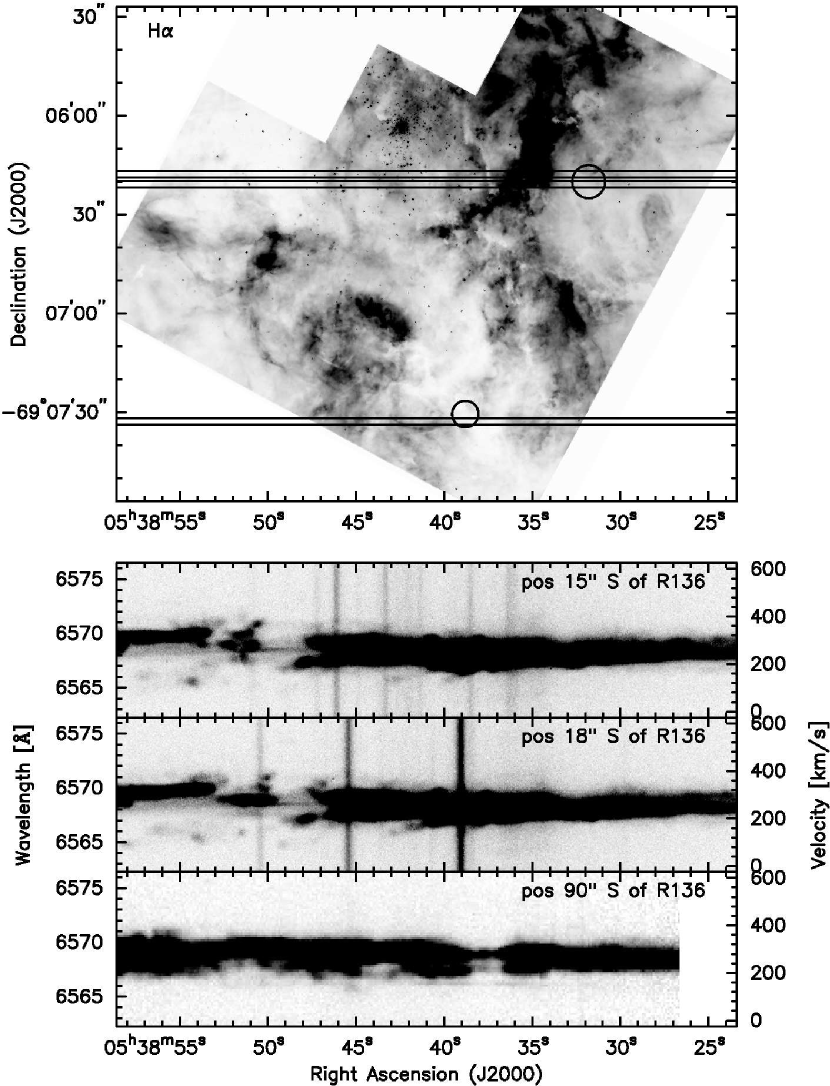
Chu & Kennicutt (1986, 1988, 1994) have demonstrated that SNRs can be effectively diagnosed kinematically by detections of shocked material at large velocity offsets from the systemic velocities, 100 km s-1, even if the SNRs are embedded in giant H II regions. In Figure 2, we show three east-west oriented long-slit echelle spectrograms of the H line; two intersect SNR candidate 1 and one intersects SNR candidate 2. It is evident in Figure 2 that high-velocity features are present in the X-ray-bright cavity that encompasses the R136 cluster, but not in the vicinity of the SNR candidates. The nebular kinematics do not show shocks to support the SNR nature of these two candidates.
Lazendic et al. (2003) cited a lower electron temperature and higher helium abundance reported by Rosa & Mathis (1987) in region 4B near candidate 2 to support the existence of supernova ejecta; however, this anomalous temperature and abundance was not confirmed by Lortet & Testor (1991). These latter authors further noted that this region was “particularly obscured”. Thus, we do not find any optical morphological, spectral, or kinematic properties of candidates 1 and 2 to support their identification as SNRs.
The suggestion of nonthermal radio emission from candidate 2 was mainly based on the high radio/H ratio, as the H emission was very weak (Lazendic et al., 2003). The HST WFPC2 images in Figure 1 and in the top panel of Figure 2 show that SNR candidate 2 is coincident with a portion of an irregularly shaped dust cloud, which appears as a void in the H image (Lazendic et al., 2003). The H echelle spectrogram in the bottom panel of Figure 2 shows the same two velocity components in the low surface brightness region of candidate 2 and in its neighboring regions, at heliocentric velocities of 280 and 220 km s-1. The continuation of kinematic features suggests that the lower surface brightness at candidate 2 is caused by extinction arising from a foreground dust cloud, which is clearly visible in the HST WFPC2 images. The H surface brightness in the dusty region is a factor of 10–20 lower than those of the neighboring regions for the 280 km s-1 component, and 5–9 times lower for the 220 km s-1 component. If the intrinsic surface brightness behind the dusty feature is similar to those of the neighboring regions, then the extra extinction is = 2.5–3.3 for the 280 km s-1 component and = 1.8–2.3 for the 220 km s-1 component. As the 280 km s-1 component is the brighter of the two, its extinction is a better approximation of the effective extinction of the total emission. Indeed, the extinction of the 280 km s-1 component is consistent with the 3.3 mag extra extinction implied by the radio/H ratio (Dickel et al., 1994; Lazendic et al., 2003). Therefore, we conclude that SNR candidate 2 corresponds to a dusty region with an extra extinction of 3 mag at the H line, and that there is no compelling evidence for nonthermal radio emission.
4 X-ray Test of the SNR Candidacy
The two SNR candidates in 30 Dor do not have corresponding X-ray sources (Lazendic et al., 2003; Wang, 1999). This is uncommon for young SNRs found in the Galaxy or the LMC, which are usually very luminous, particularly the ones with massive supernova progenitors; their X-ray luminosities frequently reach 1037 ergs s-1 (Mathewson et al., 1983).
We re-examined the archival Chandra ACIS-I observation 62520 centered at R136 (Townsley et al., 2002; Lazendic et al., 2003). To extract X-ray count rates for the two SNR candidates, we use a 5′′-radius source aperture centered at the radio position of each object and a 100′′-radius background aperture centered on an emission-free region at (J2000) = 05h39m5641, (J2000) = 69∘12′213. We find background-subtracted count rates of and counts s-1 for candidates 1 and 2, respectively. To convert these count rates to X-ray luminosities, we need to make assumptions of spectral shapes and foreground absorption. For spectral shapes, we have used Raymond & Smith (1977) models for thin plasma emission with 0.4 solar abundances at temperatures of = 0.5, 1.0, and 5.0 keV, as well as power-law models with a photon index of = 2.0 for pulsars and pulsar-wind nebulae (e.g., SNR 054069.3, Kaaret et al., 2001). For the foreground absorption, we assume visual extinctions of = 1, 3, 6, and 10 and adopt an LMC gas-to-dust ratio of H-atom cm-2 (Fitzpatrick, 1986). The X-ray luminosity () in the 0.5–10 keV band derived for these different models are listed in Table 1.
While young SNRs are known for their high X-ray luminosity, 1036–1037 ergs s-1 (Mathewson et al., 1983; Williams et al., 1999), the X-ray luminosities of the two radio SNR candidates in 30 Dor are 1–3 orders of magnitude lower. Their X-ray luminosities can be raised to 1036 ergs s-1 if the foreground extinction is higher than , but such a high extinction would produce a high radio/H ratio and remove the basis for the initial identification of nonthermal radio emission and abrogate the SNR candidacy.
Compact radio SNR candidates without X-ray counterparts have been reported in starburst galaxies (e.g., M82; Muxlow et al., 1994; Griffiths et al., 2000). The combination of high radio and low X-ray luminosities is expected for radiative SNRs expanding in the interclump medium of molecular clouds. As modeled by Chevalier & Fransson (2001), the X-ray luminosity of an SNR in a dense medium peaks before the radiative phase and remains 1037 ergs s-1 for up to 103 yr. A radiative SNR in a dense medium is faint in X-rays, but should be a strong emitter of optical forbidden lines. High extinctions in starburst galaxies have prevented the detection of optical counterparts of the compact radio SNR candidates. Such high extinction might exist in 30 Dor but again would invalidate the deduction of nonthermal radio emission from high radio/H ratios. Therefore, the absence of bright X-ray emission does not support the SNR nature of the radio SNR candidates in 30 Dor.
5 Summary and Conclusions
Based on comparisons of H/H and radio/H ratios Lazendic et al. (2003) suggested two radio SNR candidates in 30 Dor. We have examined their morphological, spectral, and kinematic properties at optical wavelengths, but do not find supporting evidence for their identification as SNRs. We have further examined their X-ray properties, and find their low X-ray luminosities inconsistent with young SNRs. Large extinction could obscure the optical and X-ray emission from a hypothetical SNR, but such large extinction would produce high H/H and radio/H ratios which contradict the observations and weaken the argument for nonthermal radio emission. Therefore, there is no compelling evidence that either of the radio SNR candidates are truly SNRs.
An indication of the true nature of the two radio SNR candidates in 30 Dor is provided by the recent Spitzer Space Telescope (SST) observations. Bright IR objects in massive star forming regions have been associated with proto-stellar objects ever since the pioneering observation of the BN object in Orion by Becklin & Neugebauer (1967). A press-release SST IRAC color composite image of 30 Dor222Available at http://www.spitzer.caltech.edu/Media/releases/ssc2004-01/ssc2004-01a.shtml. shows enhanced mid-IR emission coincident with both radio SNR candidates as well as the two high radio/H sources that were associated with proto-stellar objects by Lazendic et al. (2003). These two latter sources, MCRX J053848.3690442 and MCRX J053848.6690412, have been clearly demonstrated by HST NICMOS observations to contain compact embedded young clusters (Brandner et al., 2001; Walborn et al., 1999, 2002).
SNR candidate 1 is coincident with molecular clouds 30Dor-12 and 30Dor-13 (Johansson et al., 1998), and furthermore is near two Class I protostars, 30Dor-NIC07a and 30Dor-NIC07b (Brandner et al., 2001). Therefore, we suggest that candidate 1 is also associated with a young star forming region; while the observed radio emission originates from the embedded star forming region, the observed optical emission arises from the foreground.
SNR candidate 2 shows diffuse mid-IR emission, and is coincident with a visible dust cloud (Figs. 1 & 2) and the molecular cloud 30Dor-15 (Johansson et al., 1998). Its radio/H ratio suggests an extra extinction of 3 mag, which is supported by the H surface brightness variations in the bright 280 km s-1 component seen in the long-slit echelle observations. Thus we suggest that candidate 2 is associated with a dust/molecular cloud, which obscures some optical emission but not the radio emission. It is not clear whether star formation is taking place locally. Detailed analyses of the SST IRAC observations and high-resolution near-IR observations are needed to determine the star formation activity in this molecular cloud.
References
- Becklin & Neugebauer (1967) Becklin, E. E., & Neugebauer, G. 1967, ApJ, 147, 799
- Brandner et al. (2001) Brandner, W., Grebel, E. K., Barbá, R. H., Walborn, N. R., & Moneti, A. 2001, AJ, 122, 858
- Chen et al. (2000) Chen, C.-H. R., Chu, Y., Gruendl, R. A., & Points, S. D. 2000, AJ, 119, 1317
- Chevalier et al. (1980) Chevalier, R. A., Kirshner, R. P., & Raymond, J. C. 1980, ApJ, 235, 186
- Chevalier & Fransson (2001) Chevalier, R. A. & Fransson, C. 2001, ApJ, 558, L27
- Chu & Kennicutt (1986) Chu, Y.-H., & Kennicutt, R. C. 1986, ApJ, 311, 85
- Chu & Kennicutt (1988) Chu, Y.-H., & Kennicutt, R. C. 1988, AJ, 95, 1111
- Chu & Kennicutt (1994) Chu, Y.-H., & Kennicutt, R. C. 1994, ApJ, 425, 720
- Chu et al. (1994) Chu, Y.-H., Wakker, B., Mac Low, M.-M., & Garcia-Segura, G. 1994, AJ, 108, 1696
- Dickel et al. (1994) Dickel, J. R., Milne, D. K., Kennicutt, R. C., Chu, Y.-H., & Schommer, R. A. 1994, AJ, 107, 1067
- Fitzpatrick (1986) Fitzpatrick, E. L. 1986, AJ, 92, 1068
- Grebel & Chu (2000) Grebel, E. K. & Chu, Y.-H. 2000, AJ, 119, 787
- Griffiths et al. (2000) Griffiths, R. E., et al. 2000, Science, 290, 1325
- Hunter et al. (1995) Hunter, D. A., Shaya, E. J., Holtzman, J. A., Light, R. M., O’Neil, E. J., & Lynds, R. 1995, ApJ, 448, 179
- Johansson et al. (1998) Johansson, L. E. B., et al. 1998, A&A, 331, 857
- Kaaret et al. (2001) Kaaret, P., et al. 2001, ApJ, 546, 1159
- Kirshner & Blair (1980) Kirshner, R. P. & Blair, W. P. 1980, ApJ, 236, 135
- Lazendic et al. (2003) Lazendic, J. S., Dickel, J. R., & Jones, P. A. 2003, ApJ, 596, 287
- Lortet & Testor (1991) Lortet, M.-C., & Testor, G. 1991, A&AS, 89, 185
- Mathewson et al. (1983) Mathewson, D. S., Ford, V. L., Dopita, M. A., Tuohy, I. R., Long, K. S., & Helfand, D. J. 1983, ApJS, 51, 345
- Mathis et al. (1985) Mathis, J. S., Chu, Y.-H., & Peterson, D. E. 1985, ApJ, 292, 155
- Matonick & Fesen (1997) Matonick, D. M. & Fesen, R. A. 1997, ApJS, 112, 49
- Muxlow et al. (1994) Muxlow, T. W. B., Pedlar, A., Wilkinson, P. N., Axon, D. J., Sanders, E. M., & de Bruyn, A. G. 1994, MNRAS, 266, 455
- Points et al. (1999) Points, S. D., Chu, Y. H., Kim, S., Smith, R. C., Snowden, S. L., Brandner, W., & Gruendl, R. A. 1999, ApJ, 518, 298
- Raymond & Smith (1977) Raymond, J. C. & Smith, B. W. 1977, ApJS, 35, 419
- Rosa & Mathis (1987) Rosa, M., & Mathis, J. S. 1987, ApJ, 317, 163
- Rubio et al. (1998) Rubio, M., Barbá, R. H., Walborn, N. R., Probst, R. G., García, J., & Roth, M. R. 1998, AJ, 116, 1708
- Scowen et al. (1998) Scowen, P. A., et al. 1998, AJ, 116, 163
- Selman et al. (1999) Selman, F., Melnick, J., Bosch, G., & Terlevich, R. 1999, A&A, 347, 532
- Townsley et al. (2002) Townsley, L. et al. 2002, American Physical Society Meeting, abstract #B17.061
- Walborn et al. (1999) Walborn, N. R., Barbá, R. H., Brandner, W., Rubio, M., Grebel, E. K., & Probst, R. G. 1999, AJ, 117, 225
- Walborn & Blades (1997) Walborn, N. R. & Blades, J. C. 1997, ApJS, 112, 457
- Walborn et al. (2002) Walborn, N. R., Maíz-Apellániz, J., & Barbá, R. H. 2002, AJ, 124, 1601
- Williams et al. (1999) Williams, R. M., Chu, Y.-H., Dickel, J. R., Petre, R., Smith, R. C., & Tavarez, M. 1999, ApJS, 123, 467
- Wang (1999) Wang, Q. D. 1999, ApJ, 510, L139
- Ye et al. (1991) Ye, T., Turtle, A. J., & Kennicutt, R. C. 1991, MNRAS, 249, 722
| Model aaRS – Raymond & Smith (1977); PL – power-law. | of Cand. 1 | of Cand. 2 | |
|---|---|---|---|
| (mag) | (ergs s-1) | (ergs s-1) | |
| RS =0.5 keV | 1 | ||
| RS =1.0 keV | 1 | ||
| RS =5.0 keV | 1 | ||
| RS =0.5 keV | 3 | ||
| RS =1.0 keV | 3 | ||
| RS =5.0 keV | 3 | ||
| RS =0.5 keV | 6 | ||
| RS =1.0 keV | 6 | ||
| RS =5.0 keV | 6 | ||
| RS =0.5 keV | 10 | ||
| RS =1.0 keV | 10 | ||
| RS =5.0 keV | 10 | ||
| PL =2.0 | 1 | ||
| PL =2.0 | 3 | ||
| PL =2.0 | 6 | ||
| PL =2.0 | 10 |